DACSS 601: Data Science Fundamentals - FALL 2022
  • Fall 2022 Posts
  • Contributors
  • DACSS

Challenge 8

  • Course information
    • Overview
    • Instructional Team
    • Course Schedule
  • Weekly materials
    • Fall 2022 posts
    • final posts

On this page

  • Challenge Overview
  • Read in data
    • Briefly describe the data
  • Tidy Data (as needed)
  • Join Data

Challenge 8

challenge_8
Aleacia Messiah
snl
tidyverse
ggplot2
summarytools
lubridate
Joining Data
Author

Aleacia Messiah

Published

December 8, 2022

library(tidyverse)
library(ggplot2)
library(summarytools)
library(lubridate)

knitr::opts_chunk$set(echo = TRUE, warning=FALSE, message=FALSE)

Challenge Overview

Today’s challenge is to:

  1. read in multiple data sets, and describe the data set using both words and any supporting information (e.g., tables, etc)
  2. tidy data (as needed, including sanity checks)
  3. mutate variables as needed (including sanity checks)
  4. join two or more data sets and analyze some aspect of the joined data

(be sure to only include the category tags for the data you use!)

Read in data

Read in one (or more) of the following datasets, using the correct R package and command.

  • military marriages ⭐⭐
  • faostat ⭐⭐
  • railroads ⭐⭐⭐
  • fed_rate ⭐⭐⭐
  • debt ⭐⭐⭐
  • us_hh ⭐⭐⭐⭐
  • snl ⭐⭐⭐⭐⭐
# read in snl actors dataset
actors_orig <- read_csv("_data/snl_actors.csv")
# read in snl casts dataset
casts_orig <- read_csv("_data/snl_casts.csv")
# read in snl seasons dataset
seasons_orig <- read_csv("_data/snl_seasons.csv")
# view datasets
actors_orig
# A tibble: 2,306 × 4
   aid            url           type  gender 
   <chr>          <chr>         <chr> <chr>  
 1 Kate McKinnon  /Cast/?KaMc   cast  female 
 2 Alex Moffat    /Cast/?AlMo   cast  male   
 3 Ego Nwodim     /Cast/?EgNw   cast  unknown
 4 Chris Redd     /Cast/?ChRe   cast  male   
 5 Kenan Thompson /Cast/?KeTh   cast  male   
 6 Carey Mulligan /Guests/?3677 guest andy   
 7 Marcus Mumford /Guests/?3679 guest male   
 8 Aidy Bryant    /Cast/?AiBr   cast  female 
 9 Steve Higgins  /Crew/?StHi   crew  male   
10 Mikey Day      /Cast/?MiDa   cast  male   
# … with 2,296 more rows
casts_orig
# A tibble: 614 × 8
   aid                sid featured first_epid last_epid update…¹ n_epi…² seaso…³
   <chr>            <dbl> <lgl>         <dbl>     <dbl> <lgl>      <dbl>   <dbl>
 1 A. Whitney Brown    11 TRUE       19860222        NA FALSE          8   0.444
 2 A. Whitney Brown    12 TRUE             NA        NA FALSE         20   1    
 3 A. Whitney Brown    13 TRUE             NA        NA FALSE         13   1    
 4 A. Whitney Brown    14 TRUE             NA        NA FALSE         20   1    
 5 A. Whitney Brown    15 TRUE             NA        NA FALSE         20   1    
 6 A. Whitney Brown    16 TRUE             NA        NA FALSE         20   1    
 7 Alan Zweibel         5 TRUE       19800409        NA FALSE          5   0.25 
 8 Sasheer Zamata      39 TRUE       20140118        NA FALSE         11   0.524
 9 Sasheer Zamata      40 TRUE             NA        NA FALSE         21   1    
10 Sasheer Zamata      41 FALSE            NA        NA FALSE         21   1    
# … with 604 more rows, and abbreviated variable names ¹​update_anchor,
#   ²​n_episodes, ³​season_fraction
seasons_orig
# A tibble: 46 × 5
     sid  year first_epid last_epid n_episodes
   <dbl> <dbl>      <dbl>     <dbl>      <dbl>
 1     1  1975   19751011  19760731         24
 2     2  1976   19760918  19770521         22
 3     3  1977   19770924  19780520         20
 4     4  1978   19781007  19790526         20
 5     5  1979   19791013  19800524         20
 6     6  1980   19801115  19810411         13
 7     7  1981   19811003  19820522         20
 8     8  1982   19820925  19830514         20
 9     9  1983   19831008  19840512         19
10    10  1984   19841006  19850413         17
# … with 36 more rows
# view summaries of datasets
dfSummary(actors_orig)
Data Frame Summary  
actors_orig  
Dimensions: 2306 x 4  
Duplicates: 0  

------------------------------------------------------------------------------------------------------------
No   Variable      Stats / Values            Freqs (% of Valid)   Graph                 Valid      Missing  
---- ------------- ------------------------- -------------------- --------------------- ---------- ---------
1    aid           1. 'N Sync                   1 ( 0.0%)                               2306       0        
     [character]   2. 070 Shake                 1 ( 0.0%)                               (100.0%)   (0.0%)   
                   3. 10,000 Maniacs            1 ( 0.0%)                                                   
                   4. 14 Karat Soul             1 ( 0.0%)                                                   
                   5. 2 Chainz                  1 ( 0.0%)                                                   
                   6. 3-D                       1 ( 0.0%)                                                   
                   7. 3RDEYEGIRL                1 ( 0.0%)                                                   
                   8. 50 Cent                   1 ( 0.0%)                                                   
                   9. A Tribe Called Quest      1 ( 0.0%)                                                   
                   10. A$AP Rocky               1 ( 0.0%)                                                   
                   [ 2296 others ]           2296 (99.6%)         IIIIIIIIIIIIIIIIIII                       

2    url           1. /Cast/?AbEl               1 ( 0.0%)                               2249       57       
     [character]   2. /Cast/?AdSa               1 ( 0.0%)                               (97.5%)    (2.5%)   
                   3. /Cast/?AiBr               1 ( 0.0%)                                                   
                   4. /Cast/?AlFr               1 ( 0.0%)                                                   
                   5. /Cast/?AlMo               1 ( 0.0%)                                                   
                   6. /Cast/?AlZw               1 ( 0.0%)                                                   
                   7. /Cast/?AmPo               1 ( 0.0%)                                                   
                   8. /Cast/?AnDi               1 ( 0.0%)                                                   
                   9. /Cast/?AnGa               1 ( 0.0%)                                                   
                   10. /Cast/?AnMH              1 ( 0.0%)                                                   
                   [ 2239 others ]           2239 (99.6%)         IIIIIIIIIIIIIIIIIII                       

3    type          1. cast                    154 ( 6.7%)         I                     2306       0        
     [character]   2. crew                    170 ( 7.4%)         I                     (100.0%)   (0.0%)   
                   3. guest                  1926 (83.5%)         IIIIIIIIIIIIIIII                          
                   4. unknown                  56 ( 2.4%)                                                   

4    gender        1. andy                     21 ( 0.9%)                               2306       0        
     [character]   2. female                  671 (29.1%)         IIIII                 (100.0%)   (0.0%)   
                   3. male                   1226 (53.2%)         IIIIIIIIII                                
                   4. unknown                 388 (16.8%)         III                                       
------------------------------------------------------------------------------------------------------------
dfSummary(casts_orig)
Data Frame Summary  
casts_orig  
Dimensions: 614 x 8  
Duplicates: 0  

------------------------------------------------------------------------------------------------------------------------
No   Variable          Stats / Values                    Freqs (% of Valid)   Graph                 Valid      Missing  
---- ----------------- --------------------------------- -------------------- --------------------- ---------- ---------
1    aid               1. Kenan Thompson                  18 ( 2.9%)                                614        0        
     [character]       2. Darrell Hammond                 14 ( 2.3%)                                (100.0%)   (0.0%)   
                       3. Seth Meyers                     13 ( 2.1%)                                                    
                       4. Al Franken                      11 ( 1.8%)                                                    
                       5. Fred Armisen                    11 ( 1.8%)                                                    
                       6. Kate McKinnon                   10 ( 1.6%)                                                    
                       7. Tim Meadows                     10 ( 1.6%)                                                    
                       8. Aidy Bryant                      9 ( 1.5%)                                                    
                       9. Bobby Moynihan                   9 ( 1.5%)                                                    
                       10. Cecily Strong                   9 ( 1.5%)                                                    
                       [ 146 others ]                    500 (81.4%)          IIIIIIIIIIIIIIII                          

2    sid               Mean (sd) : 25.5 (13.1)           46 distinct values         .           :   614        0        
     [numeric]         min < med < max:                                             :   :   : . :   (100.0%)   (0.0%)   
                       1 < 26 < 46                                            : : . : : : : : : :                       
                       IQR (CV) : 22 (0.5)                                    : : : : : : : : : :                       
                                                                              : : : : : : : : : :                       

3    featured          1. FALSE                          451 (73.5%)          IIIIIIIIIIIIII        614        0        
     [logical]         2. TRUE                           163 (26.5%)          IIIII                 (100.0%)   (0.0%)   

4    first_epid        Mean (sd) : 19909635 (111264.8)   35 distinct values     :                   50         564      
     [numeric]         min < med < max:                                         :   :               (8.1%)     (91.9%)  
                       19770115 < 19901110 < 20141025                           :   :                                   
                       IQR (CV) : 156624.2 (0)                                : : . : :   : .                           
                                                                              : : : : : . : :                           

5    last_epid         Mean (sd) : 19944038 (126122.2)   17 distinct values           :             17         597      
     [numeric]         min < med < max:                                       :       :             (2.8%)     (97.2%)  
                       19751011 < 19950225 < 20140201                         :   .   : . . .                           
                       IQR (CV) : 190005 (0)                                  :   :   : : : :                           
                                                                              : : : : : : : :                           

6    update_anchor     1. FALSE                          541 (88.1%)          IIIIIIIIIIIIIIIII     614        0        
     [logical]         2. TRUE                            73 (11.9%)          II                    (100.0%)   (0.0%)   

7    n_episodes        Mean (sd) : 18.7 (4)              22 distinct values                   :     614        0        
     [numeric]         min < med < max:                                                       :     (100.0%)   (0.0%)   
                       1 < 20 < 24                                                            :                         
                       IQR (CV) : 2 (0.2)                                                     :                         
                                                                                      . . . : : :                       

8    season_fraction   Mean (sd) : 0.9 (0.2)             36 distinct values                     :   614        0        
     [numeric]         min < med < max:                                                         :   (100.0%)   (0.0%)   
                       0 < 1 < 1                                                                :                       
                       IQR (CV) : 0 (0.2)                                                       :                       
                                                                                                :                       
------------------------------------------------------------------------------------------------------------------------
dfSummary(seasons_orig)
Data Frame Summary  
seasons_orig  
Dimensions: 46 x 5  
Duplicates: 0  

-------------------------------------------------------------------------------------------------------------------
No   Variable     Stats / Values                    Freqs (% of Valid)   Graph                 Valid      Missing  
---- ------------ --------------------------------- -------------------- --------------------- ---------- ---------
1    sid          Mean (sd) : 23.5 (13.4)           46 distinct values   : :   :   :   :   :   46         0        
     [numeric]    min < med < max:                                       : : : : : : : : : :   (100.0%)   (0.0%)   
                  1 < 23.5 < 46                                          : : : : : : : : : :                       
                  IQR (CV) : 22.5 (0.6)                                  : : : : : : : : : :                       
                                                                         : : : : : : : : : :                       

2    year         Mean (sd) : 1997.5 (13.4)         46 distinct values   :                     46         0        
     [numeric]    min < med < max:                                       : : : : : : : : :     (100.0%)   (0.0%)   
                  1975 < 1997.5 < 2020                                   : : : : : : : : :                         
                  IQR (CV) : 22.5 (0)                                    : : : : : : : : :                         
                                                                         : : : : : : : : :                         

3    first_epid   Mean (sd) : 19975965 (134209.3)   46 distinct values   : :   :   :   :   :   46         0        
     [numeric]    min < med < max:                                       : : : : : : : : : :   (100.0%)   (0.0%)   
                  19751011 < 19975927 < 20201003                         : : : : : : : : : :                       
                  IQR (CV) : 224910.2 (0)                                : : : : : : : : : :                       
                                                                         : : : : : : : : : :                       

4    last_epid    Mean (sd) : 19985509 (134223.9)   46 distinct values   : :   :   :     : :   46         0        
     [numeric]    min < med < max:                                       : : : : : : : : : :   (100.0%)   (0.0%)   
                  19760731 < 19985512 < 20210410                         : : : : : : : : : :                       
                  IQR (CV) : 225066.2 (0)                                : : : : : : : : : :                       
                                                                         : : : : : : : : : :                       

5    n_episodes   Mean (sd) : 19.7 (2.3)            12 :  1 ( 2.2%)                            46         0        
     [numeric]    min < med < max:                  13 :  2 ( 4.3%)                            (100.0%)   (0.0%)   
                  12 < 20 < 24                      17 :  2 ( 4.3%)                                                
                  IQR (CV) : 1 (0.1)                18 :  2 ( 4.3%)                                                
                                                    19 :  3 ( 6.5%)      I                                         
                                                    20 : 23 (50.0%)      IIIIIIIIII                                
                                                    21 :  7 (15.2%)      III                                       
                                                    22 :  5 (10.9%)      II                                        
                                                    24 :  1 ( 2.2%)                                                
-------------------------------------------------------------------------------------------------------------------

Briefly describe the data

These datasets consist of the actors, casts, and seasons of Saturday Night Live (SNL) from 1975 to 2020. There are 2,306 observations and 4 variables (aid, url, type, gender) in the actors dataset, 614 observations and 8 variables (aid, sid, featured, first_epid, last_epid, update_anchor, n_episodes, season_fraction) in the casts dataset, and 46 observations and 5 variables (sid, year, first_epid, last_epid, n_episodes) in the seasons dataset. Within 46 seasons, there are records of the date of each actor’s (aid) first episode (first_epid) and last episode (last_epid) along with the date of the beginning (first_epid) and ending (last_epid) of each season. There is also sid which represents the season ID and featured which says whether the cast member was featured or not.

The mean number of episodes from the n_episodes variable is 19.7 per season and 18.7 per cast member. Out of all the cast members in the casts dataset, Kenan Thompson was involved in SNL the most often at 18 times with Darrell Hammond (14 times) and Seth Meyers (13 times) following after him.

Tidy Data (as needed)

Is your data already tidy, or is there work to be done? Be sure to anticipate your end result to provide a sanity check, and document your work here.

Note

These datasets are pretty tidy and organized well, so there’s not much to do here.

Are there any variables that require mutation to be usable in your analysis stream? For example, do you need to calculate new values in order to graph them? Can string values be represented numerically? Do you need to turn any variables into factors and reorder for ease of graphics and visualization?

Document your work here.

There are a few variables that require mutation: type and gender need to be converted into factors and first_epid and last_epid need to be converted to date format.

# convert type and gender variables into factors
actors <- actors_orig %>% 
  mutate(across(3:4, factor))
# create a new data frame named casts
casts <- casts_orig
# convert first_epid into date format
casts$first_epid <- ymd(casts$first_epid)
# convert last_epid into date format
casts$last_epid <- ymd(casts$last_epid)
# create a new data frame named seasons
seasons <- seasons_orig
# convert first_epid into date format
seasons$first_epid <- ymd(seasons$first_epid)
# convert last_epid into date format
seasons$last_epid <- ymd(seasons$last_epid)

Join Data

Be sure to include a sanity check, and double-check that case count is correct!

# join actors and casts into one data frame
ac <- full_join(actors, casts, by = "aid")
# create a jitter plot of gender vs. type with color based on whether the actor was featured or not
ggplot(ac, aes(`type`, `gender`)) +
  geom_jitter(aes(color = `featured`)) +
  labs(x = "Group Actor Belongs To",
       y = "Gender of Actor",
       title = "Jitter Plot of Gender of Actor vs. Group Actor Belongs To",
       subtitle = "The legend shows whether the actor was featured or not",
       caption = "Data: snl_actors.csv & snl_casts.csv")

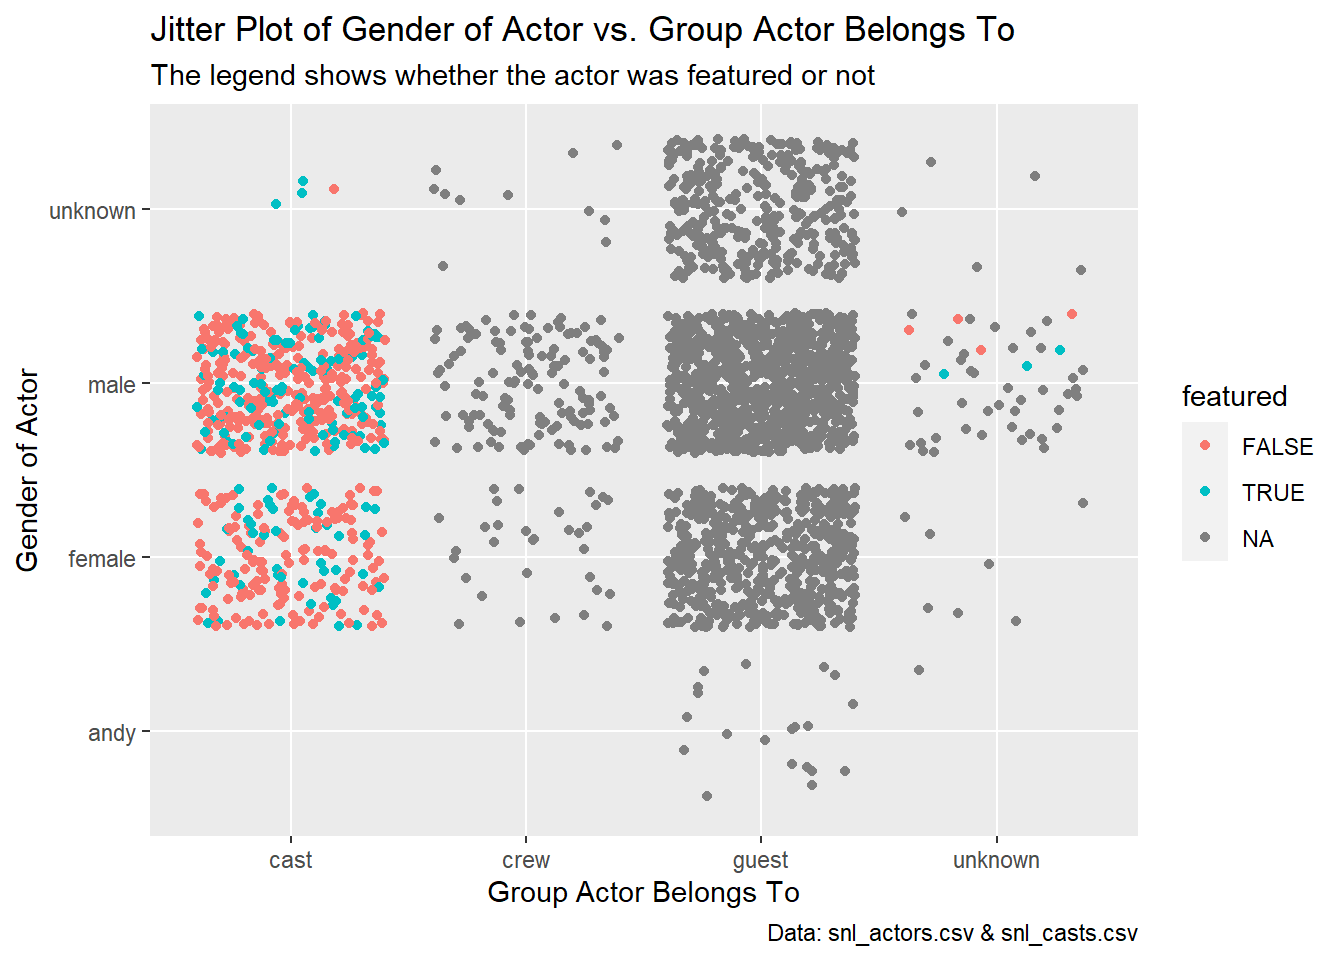
I decided to analyze the actors and casts datasets combined to compare the type of group the actor is in to the gender of the actor, with an aesthetic added to convey whether the actor was featured or not (featured). As illustrated by the jitter plot, the majority of featured actors are part of the cast, which is to be expected. However, there are a few that are part of the unknown group. Shown by the large concentration of points in the area, there is a large number of male, female, and unknown gender guests and more male cast members than female cast members. Although the crew is smaller than the number of cast members, most of the crew members are male like the cast. There is a gender factor called “andy” in this dataset which is hard to determine what it actually means. Although my first thought is that “andy” means non-binary or “enby,” looking through the guests that have this gender do not use non-binary pronouns or consider themselves non-binary. I would guess it either means androgynous or a placeholder for an unknown gender, but if it’s the latter, why not use “unknown”? Overall, I found this combined dataset interesting, especially the larger concentrations of points in the guests column.

Source Code
---
title: "Challenge 8"
author: "Aleacia Messiah"
description: "Joining Data"
date: "12/08/2022"
format:
  html:
    toc: true
    code-copy: true
    code-tools: true
categories:
  - challenge_8
  - Aleacia Messiah
  - snl
  - tidyverse
  - ggplot2
  - summarytools
  - lubridate
---

```{r}
#| label: setup
#| warning: false
#| message: false

library(tidyverse)
library(ggplot2)
library(summarytools)
library(lubridate)

knitr::opts_chunk$set(echo = TRUE, warning=FALSE, message=FALSE)
```

## Challenge Overview

Today's challenge is to:

1)  read in multiple data sets, and describe the data set using both words and any supporting information (e.g., tables, etc)
2)  tidy data (as needed, including sanity checks)
3)  mutate variables as needed (including sanity checks)
4)  join two or more data sets and analyze some aspect of the joined data

(be sure to only include the category tags for the data you use!)

## Read in data

Read in one (or more) of the following datasets, using the correct R package and command.

-   military marriages ⭐⭐
-   faostat ⭐⭐
-   railroads ⭐⭐⭐
-   fed_rate ⭐⭐⭐
-   debt ⭐⭐⭐
-   us_hh ⭐⭐⭐⭐
-   snl ⭐⭐⭐⭐⭐

```{r}
# read in snl actors dataset
actors_orig <- read_csv("_data/snl_actors.csv")
# read in snl casts dataset
casts_orig <- read_csv("_data/snl_casts.csv")
# read in snl seasons dataset
seasons_orig <- read_csv("_data/snl_seasons.csv")
# view datasets
actors_orig
casts_orig
seasons_orig
# view summaries of datasets
dfSummary(actors_orig)
dfSummary(casts_orig)
dfSummary(seasons_orig)
```

### Briefly describe the data

These datasets consist of the actors, casts, and seasons of Saturday Night Live (SNL) from 1975 to 2020. There are 2,306 observations and 4 variables (`aid`, `url`, `type`, `gender`) in the actors dataset, 614 observations and 8 variables (`aid`, `sid`, `featured`, `first_epid`, `last_epid`, `update_anchor`, `n_episodes`, `season_fraction`) in the casts dataset, and 46 observations and 5 variables (`sid`, `year`, `first_epid`, `last_epid`, `n_episodes`) in the seasons dataset. Within 46 seasons, there are records of the date of each actor's (`aid`) first episode (`first_epid`) and last episode (`last_epid`) along with the date of the beginning (`first_epid`) and ending (`last_epid`) of each season. There is also `sid` which represents the season ID and `featured` which says whether the cast member was featured or not.

The mean number of episodes from the `n_episodes` variable is 19.7 per season and 18.7 per cast member. Out of all the cast members in the casts dataset, Kenan Thompson was involved in SNL the most often at 18 times with Darrell Hammond (14 times) and Seth Meyers (13 times) following after him.

## Tidy Data (as needed)

Is your data already tidy, or is there work to be done? Be sure to anticipate your end result to provide a sanity check, and document your work here.

::: callout-note
## Note

These datasets are pretty tidy and organized well, so there's not much to do here.
:::

Are there any variables that require mutation to be usable in your analysis stream? For example, do you need to calculate new values in order to graph them? Can string values be represented numerically? Do you need to turn any variables into factors and reorder for ease of graphics and visualization?

Document your work here.

There are a few variables that require mutation: `type` and `gender` need to be converted into factors and `first_epid` and `last_epid` need to be converted to date format.

```{r}
# convert type and gender variables into factors
actors <- actors_orig %>% 
  mutate(across(3:4, factor))
# create a new data frame named casts
casts <- casts_orig
# convert first_epid into date format
casts$first_epid <- ymd(casts$first_epid)
# convert last_epid into date format
casts$last_epid <- ymd(casts$last_epid)
# create a new data frame named seasons
seasons <- seasons_orig
# convert first_epid into date format
seasons$first_epid <- ymd(seasons$first_epid)
# convert last_epid into date format
seasons$last_epid <- ymd(seasons$last_epid)
```

## Join Data

Be sure to include a sanity check, and double-check that case count is correct!

```{r}
# join actors and casts into one data frame
ac <- full_join(actors, casts, by = "aid")
# create a jitter plot of gender vs. type with color based on whether the actor was featured or not
ggplot(ac, aes(`type`, `gender`)) +
  geom_jitter(aes(color = `featured`)) +
  labs(x = "Group Actor Belongs To",
       y = "Gender of Actor",
       title = "Jitter Plot of Gender of Actor vs. Group Actor Belongs To",
       subtitle = "The legend shows whether the actor was featured or not",
       caption = "Data: snl_actors.csv & snl_casts.csv")
```

I decided to analyze the actors and casts datasets combined to compare the `type` of group the actor is in to the `gender` of the actor, with an aesthetic added to convey whether the actor was featured or not (`featured`). As illustrated by the jitter plot, the majority of featured actors are part of the cast, which is to be expected. However, there are a few that are part of the unknown group. Shown by the large concentration of points in the area, there is a large number of male, female, and unknown gender guests and more male cast members than female cast members. Although the crew is smaller than the number of cast members, most of the crew members are male like the cast. There is a `gender` factor called "andy" in this dataset which is hard to determine what it actually means. Although my first thought is that "andy" means non-binary or "enby," looking through the guests that have this gender do not use non-binary pronouns or consider themselves non-binary. I would guess it either means androgynous or a placeholder for an unknown gender, but if it's the latter, why not use "unknown"? Overall, I found this combined dataset interesting, especially the larger concentrations of points in the guests column.