Code
library(tidyverse)
library(tibble)
library(dplyr)
library(stringr)
library(ggplot2)

knitr::opts_chunk$set(echo = TRUE, warning=FALSE, message=FALSE)library(tidyverse)
library(tibble)
library(dplyr)
library(stringr)
library(ggplot2)
knitr::opts_chunk$set(echo = TRUE, warning=FALSE, message=FALSE)This dataset is enrollment of students at Massachusetts Public Schools from 2015 - 2021.
The dataset has 70 columns and 70,138 rows. The variables include RowID, State, County, District, and school name. There are state IDs for each of these areas. There are columns that describe the school type as well as the low and high grade for each school. Other important variables are the year, term, and grade. There are also demographics broken into gender (male, female, non-binary, gender unknown) and race (white, black, hispanic, native_american, ative_american_alaskan_native, asian, native_hawaiian, asian_pacific_islander, native_hawaiian_pacific_islander, multiracial, unknown_race) and other details such as ELL, Homeless, low income, free and reduced, disability, section 504. This information is given twice - the columns are repeated with int at the end - I believe this is converting to integer form. Those variables are all double, but the columns with int are characters. I want to get rid of columns “district_state_type,” “county_state_id,” “term,” and “school_state_type” because they are all N/A. I will also take out the demographic columns that don’t end in int because I would prefer the other form.
enrollment <- read_csv("_data/enrollments_Naughton.csv")enrollment_new <- select(enrollment,
rowid,
state,
county,
admin_level,
district_nces_id,
district_state_id,
district,
school,
ccd_school_type,
ccd_charter_school,
ccd_school_lvl,
ccd_school_low_grade,
ccd_school_high_grade,
year,
grade,
ends_with("_int") )
enrollment_newI first want to look at Boston’s enrollment. When I did this, I noticed that in 2021, enrollment for schools were listed as “Boston - School Name” so I will need to take out “Boston -” so that the name of the school is consistent with the other years.
enrollment_Boston8 <- enrollment_new  %>%
  filter( district =="Boston", grade=="grade_8") %>%
  select(school, year, grade, male_int, female_int, non_binary_int, total_int) %>%
  mutate(school = str_remove_all(school, "Boston - "))%>%
   mutate(school = str_remove_all(school, "Boston: "))%>%
  rename("Total" = "total_int")%>%
   drop_na(school)%>%
arrange(school, year)


enrollment_Boston8
Next, I graphed the enrollment during the 8th grade of Boston schools whose total was 100 or more in 2015. This was 14 schools:
total_Boston8 <-select(enrollment_Boston8, "school",year, Total) %>%
  filter(school%in% c("Boston Latin",
                      "Boston Latin Academy",
                      "Clarence R Edwards Middle",
                      "Curley K-8 School",
                      "Edison K-8",
                      "James P Timilty Middle",
                      "John W McCormack",
                      "Lilla G. Frederick Middle School",
                      "Mario Umana Academy",
                      "O'Bryant School Math/Science",
                      "TechBoston Academy",
                      "Washington Irving Middle"))
total_Boston8ggplot(total_Boston8, aes(year, Total)) +
geom_line(aes(group = school)) +
geom_point(aes(colour = school))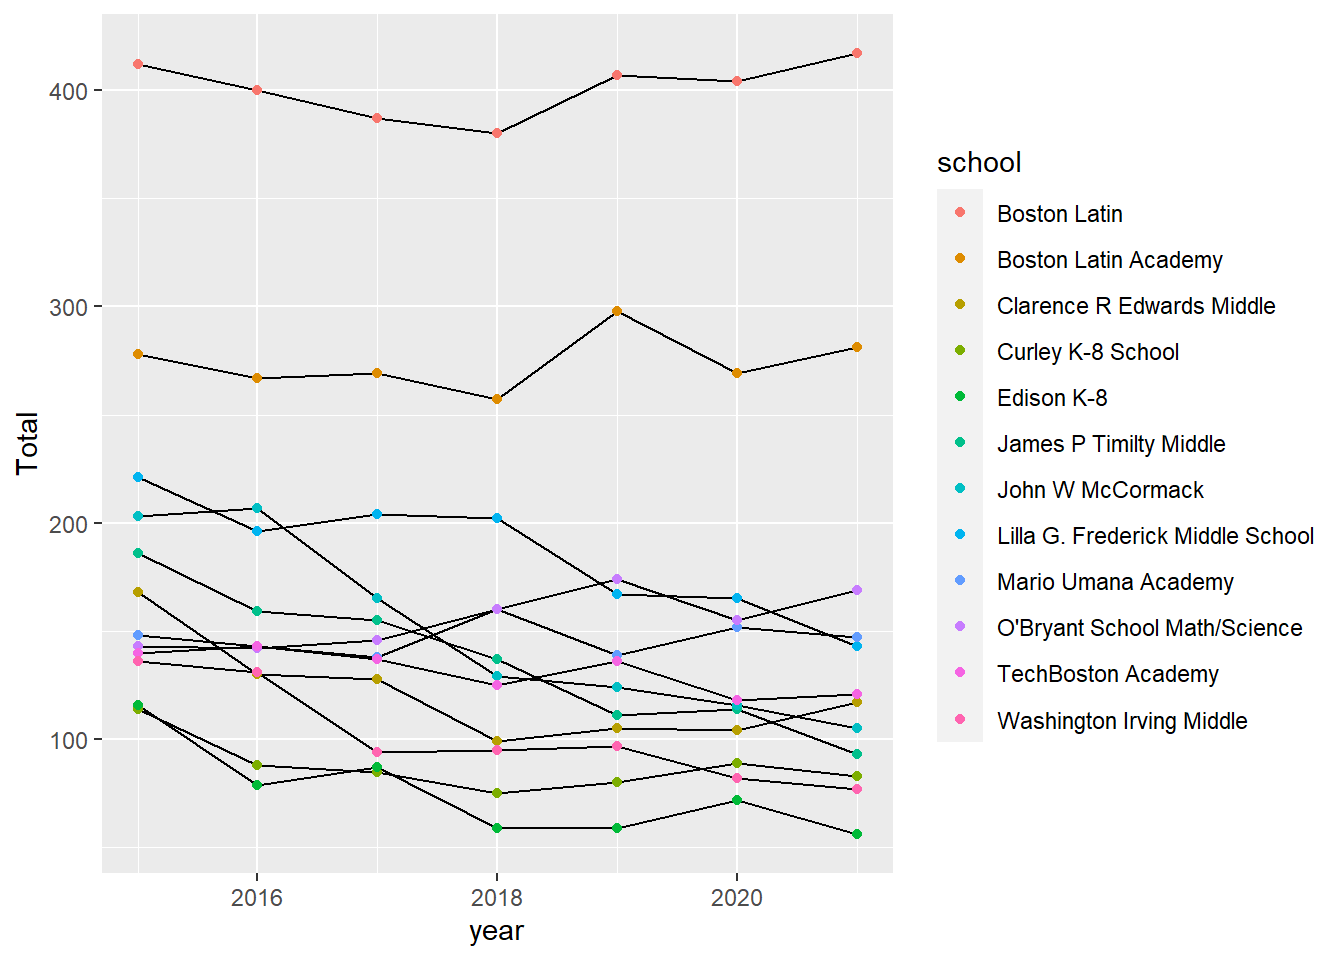
ggplot(total_Boston8, aes(year, Total)) +
  geom_line(aes(group = school)) +
  geom_point(aes(colour = school),
             show.legend = FALSE) +
  facet_wrap(~ school, nrow = 4)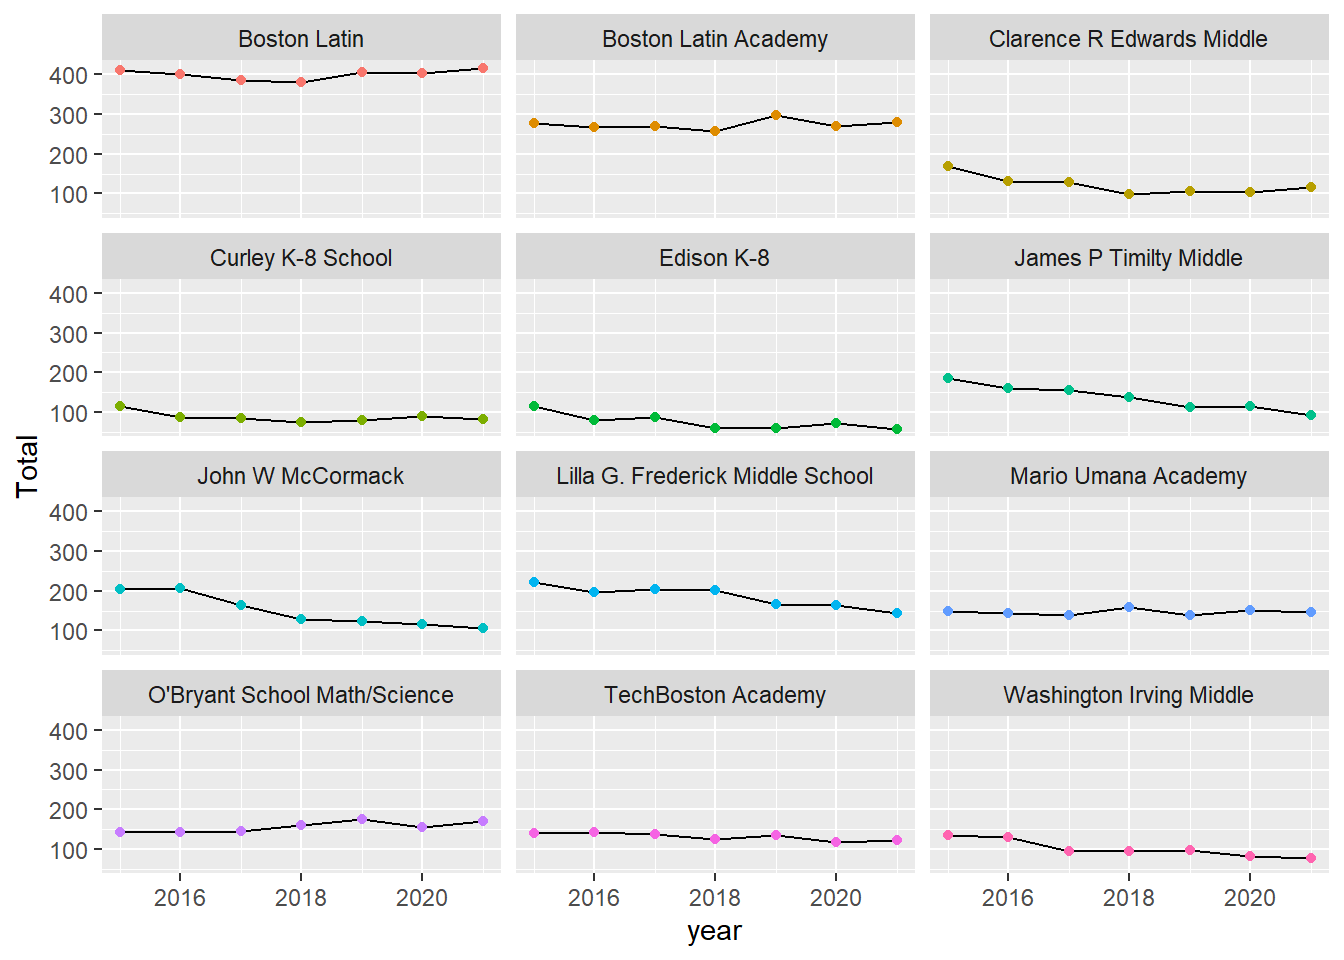
Some potential research questions for this could be:
Which schools should be closed or combined?
Which schools need more seats available to them?
Which schools and districts need more resources (teachers, staff, classroom materials, technology, school lunches, programs, etc)?
Which areas of the state are growing?
Which high schools will grow or shrink by looking at cross grade data?