HW3 - Tasks from HW2 (Read in a dataset, clean data, provide narrative) - Include descriptive statistics (e.g, mean, median, and standard deviation for numerical variables, and frequencies and/or mode for categorical variables - Include relevant visualizations using ggplot2 to complement these descriptive statistics. Be sure to use faceting, coloring, and titles as needed. Each visualization should be accompanied by descriptive text that highlights: the variable(s) used what questions might be answered with the visualizations what conclusions you can draw - Use group_by() and summarize() to compute descriptive stats and/or visualizations for any relevant groupings. For example, if you were interested in how average income varies by state, you might compute mean income for all states combined, and then compare this to the range and distribution of mean income for each individual state in the US. - Identify limitations of your visualization, such as: What questions are left unanswered with your visualizations What about the visualizations may be unclear to a naive viewer How could you improve the visualizations for the final project
Read in a dataset
I decided to use the same data as for HW2 from open source called The Armed Conflict Location & Event Data Project (ACLED) https://acleddata.com/about-acled/.
Code
library(readr)library(summarytools)
Attaching package: 'summarytools'
The following object is masked from 'package:tibble':

    view
Generated by summarytools 1.0.1 (R version 4.2.1) 2022-12-20
Brief description of the data
The dataset contains information about protests and acts of political violence (including state) in 9 EU countries of Eastern and Central Europe in 2021.
The dataframe includes 3734 cases. Each case is event (protest/terrorist attack/armed forces action etc)
There are 31 variables
Variables contain information about the event: date, event type, sub event type, type of actors and their interaction (“inter1”, “inter2”, “interaction”), actors names, place, source of information, notes (details of what happened during the protest) and number of fatalities. Columns 5-6,8-24,26-29.
Variables that contain different numeric and character identifiers of the country and event.Columns 1-4,7,25,30-31.
Clean the data
Remove certain columns.The same as in HW2.
I also decided to remove columns 10-11, 13-14. They contain information about a specific organization (name, country). It seems to me that this kind of data needs qualitative analysis or some categorization. Variable inter1 and inter2 contain information about actors. They categorize actors to 5 (inter1) and 6 (inter2) groups. Probably some detailed categorization is needed (like ideology of the organization) but that is a task for bigger research or a question of how data is gethered.
Organize dates (in a different way than in HW2)
Replace empty sting
Mutate variables due to the codebook https://acleddata.com/acleddatanew/wp-content/uploads/2021/11/ACLED_Codebook_v1_January-2021.pdf
# Replace empty sting with NA'slibrary(dplyr) protests <-na_if(protests, '')# Change variables due to the codebookprotests <- protests %>%mutate(inter1 =case_when( inter1 ==1~"State Forces", inter1 ==3~"Political Militas", inter1 ==5~"Rioters", inter1 ==6~"Protesters", inter1 ==8~"External/Other Forces"))protests <- protests %>%mutate(inter2 =case_when( inter2 ==1~"State Forces", inter2 ==3~"Political Militas", inter2 ==5~"Rioters", inter2 ==6~"Protesters", inter2 ==7~"Civilians", inter2 ==8~"External/Other Forces", inter2 ==0~"NA"))protests$inter2 <-na_if(protests$inter2, 'NA')protests <- protests %>%mutate(interaction =case_when(interaction ==10~"sole military action", interaction ==13~"military versus political militia", interaction ==15~"military versus rioters", interaction ==16~"military versus protesters", interaction ==17~"military versus civilians", interaction ==18~"military versus other", interaction ==33~"political militia versus political militia", interaction ==37~"political militia versus civilians", interaction ==50~"sole rioter action", interaction ==55~"rioters versus rioters", interaction ==56~"rioters versus protesters", interaction ==57~"rioters versus civilians", interaction ==58~"rioters versus others", interaction ==60~"sole protester action", interaction ==66~"protesters versus protesters", interaction ==78~"other actor versus civilians", interaction ==80~"sole other action"))# Renameprotests <- protests %>%rename("actor1_type"="inter1", "actor2_type"="inter2")# Reorder variableslibrary(forcats)protests <- protests %>%mutate(sub_event_type =fct_relevel(sub_event_type, "Peaceful protest", "Protest with intervention", "Mob violence", "Violent demonstration", "Change to group/activity", "Arrests", "Attack", "Other", "Looting/property destruction", "Disrupted weapons use"))protests <- protests %>%mutate(actor1_type =fct_relevel(actor1_type, "Protesters", "Rioters", "State Forces", "Political Militas", "External/Other Forces"))protests <- protests %>%mutate(actor2_type =fct_relevel(actor2_type, "State Forces", "Civilians", "Protesters", "Rioters", "Political Militas", "External/Other Forces"))protests <- protests %>%mutate(country =fct_relevel(country, "Poland", "Bulgaria", "Romania", "Czech Republic", "Lithuania", "Hungary", "Estonia", "Slovakia", "Latvia"))table(protests$source_scale)
            International                  National    National-International
                       38                      2679                        15
        National-Regional                 New media        New media-National
                       19                       320                         3
                    Other       Other-International            Other-National
                      340                         3                        20
          Other-New media         Other-Subnational                  Regional
                        1                         2                       180
   Regional-International               Subnational Subnational-International
                        2                        83                         4
     Subnational-National
                       25
The dataset gives information about protests and acts of political violence in 9 countries of Eastern and Central Europe (all counties are in the European Union) in 2021. The countries included in the dataframe are Bulgaria, Czech Republic, Estonia, Hungary, Latvia, Lithuania, Poland, Romania, Slovakia. The cases are events. So we have all information about the protest event. When and where it happened, who took part in it, was it peaceful or violet, how many fatalities it had and from which source we know about it.
What happened? Variables “event_type”, “sub_event_type” and “fatalities” gives information about how we categorize political event. “event_type”, “sub_event_type” are categorical variables which mean type of the event and basically refer to different levels and types of radicalization during the protest.
When the event happened? Variable “event_date” contains information about event day, month and year.
Where it happened? There are several variables which help to understand where protest took place. They all are categorical. First, we know “country”, second, administrative division (“admin1”),third, city or village (“location”). Columns “longitude” and “latitude” may be used to visualize a map of events.
Who participated?
Variables “actor1_type” and “actor2_type” give information about type of group which took part in the event. actor1_type has 5 types, actor2_type 6. “Interaction” contains 17 types of interaction which are different combinations of actors. These variables are categorical.
It is important to understand that actors and divided into two main groups. First is main actor, the one who organizes the protest (column “actor1”, “assoc_actor”, “inter1”) and the one who plays role of the opposition at the event for example police or opposing organization (“actor2”, “assoc_actor2”, “inter2”). Interaction between them is categorized in variable “interaction”
Descriptive statistics
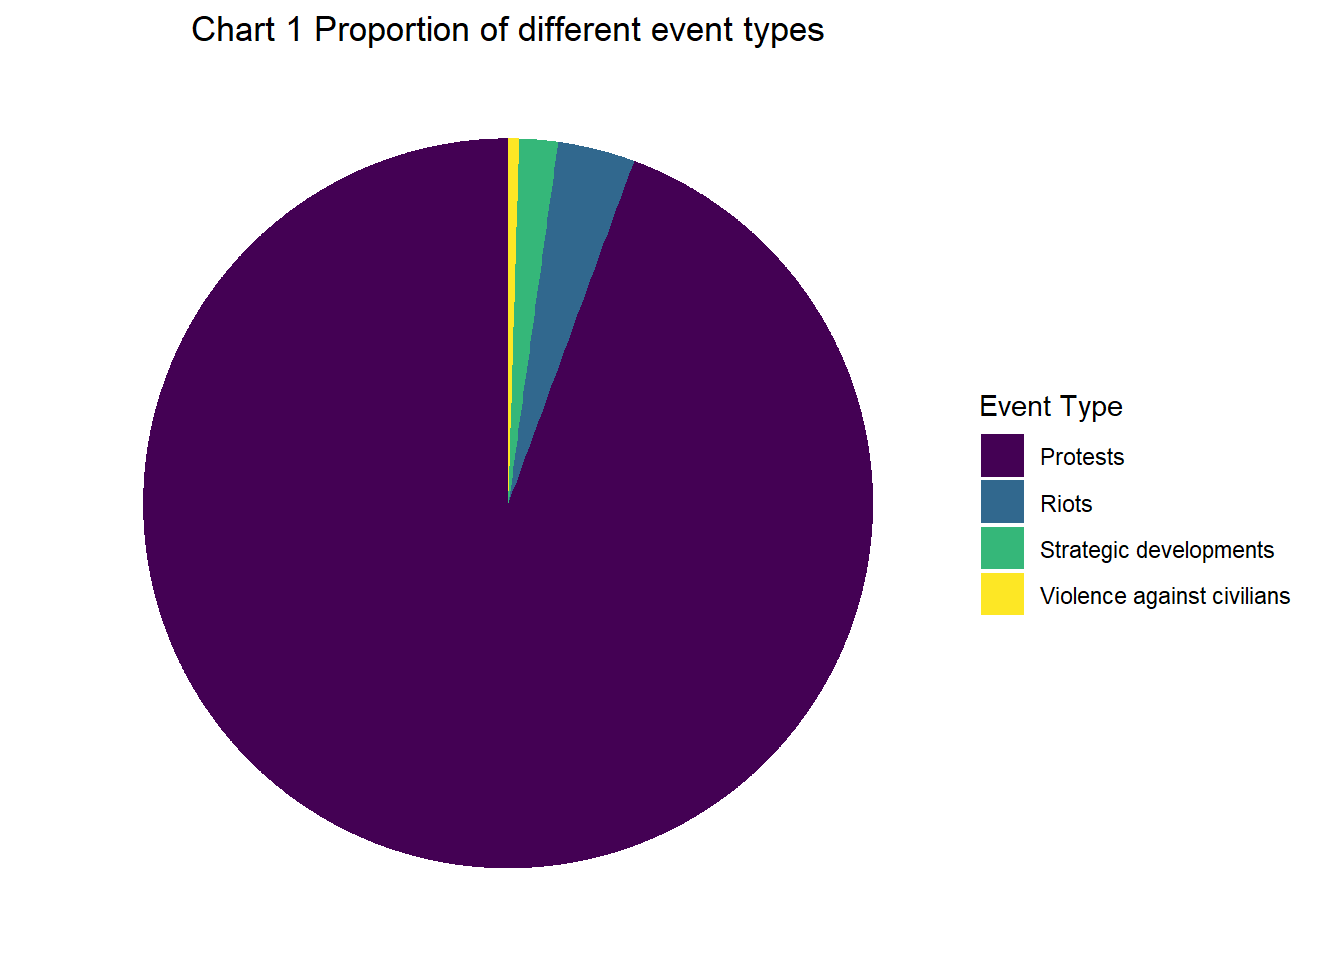
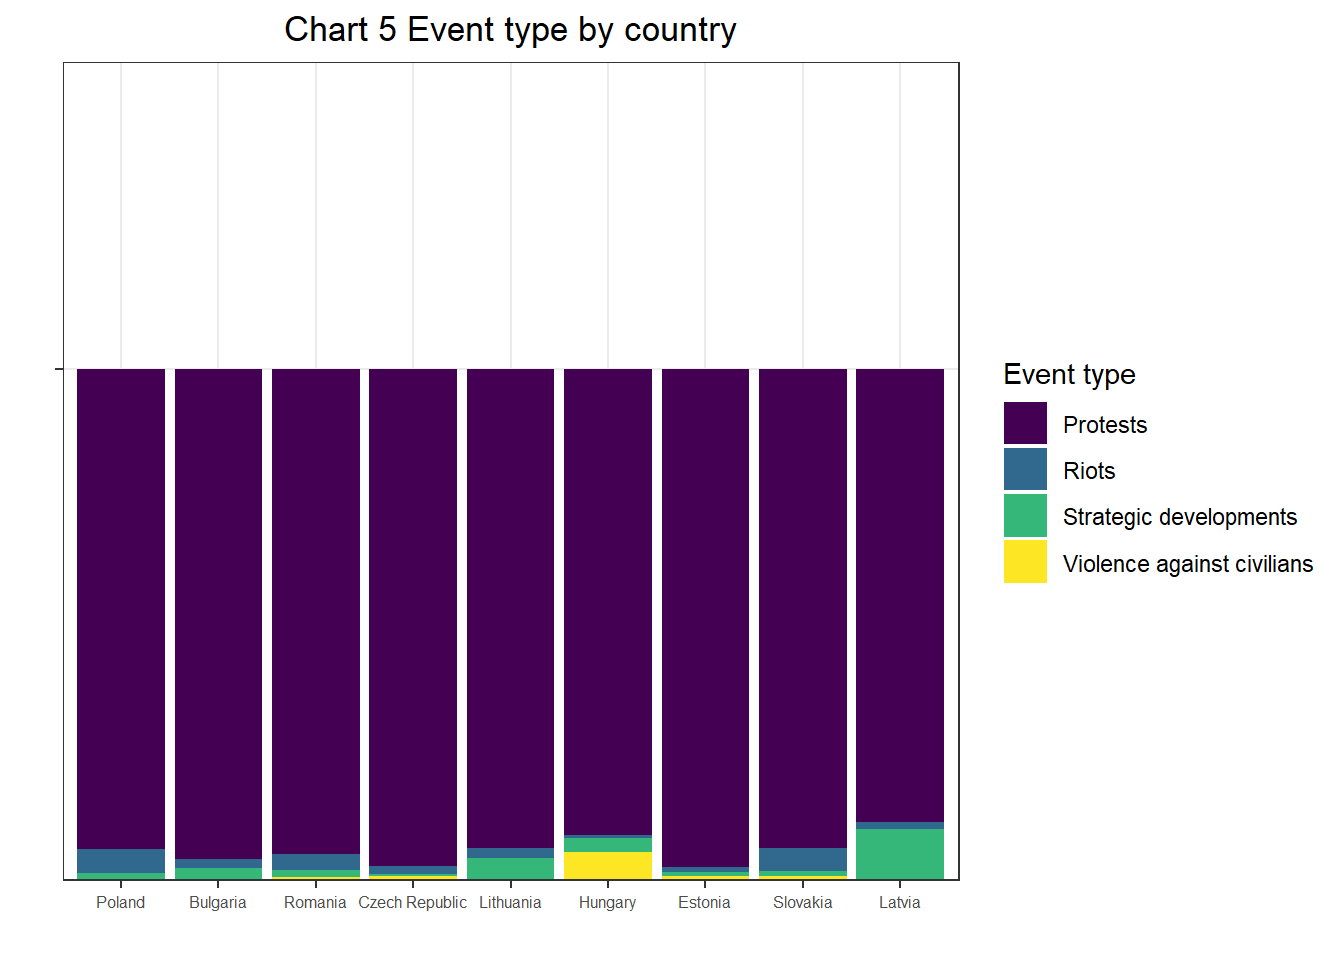
In 2021 most frequent type of event was protest. 3525 of 3734 which constitutes 94,4% of all events (variable event type). Protests and Strategic Developments do not contain violence while Riots and Violence against civilians are radical actions which contain different type of violent behavior. At the next chart we see proportions of these 4 event types in all nine countries.
*Strategic Developments are non violent actions of state and non-state groups which possibly can use violence (for example peace agreements). This type is captured to track all activities of possibly violent groups.
The chart answers the questions about what type of political activism and political violence is most frequent in Eastern Europe countries. We see that vast majority of events are peaceful. It states for some level of political stability in the region. It is important to remember that data refers to Eastern European countries that are members of the European Union, so the conclusion is representational not for Eastern Europe in general but for a geographical group of countries within the EU.
Code
library(viridis)
Loading required package: viridisLite
Code
ggplot(protests, aes(x ="", y ="", fill = event_type)) +geom_col() +guides(fill =guide_legend(title ="Event Type")) +scale_fill_viridis_d() +coord_polar(theta ="y") +theme_void() +ggtitle("Chart 1 Proportion of different event types") +theme(plot.title =element_text(hjust =0.5))
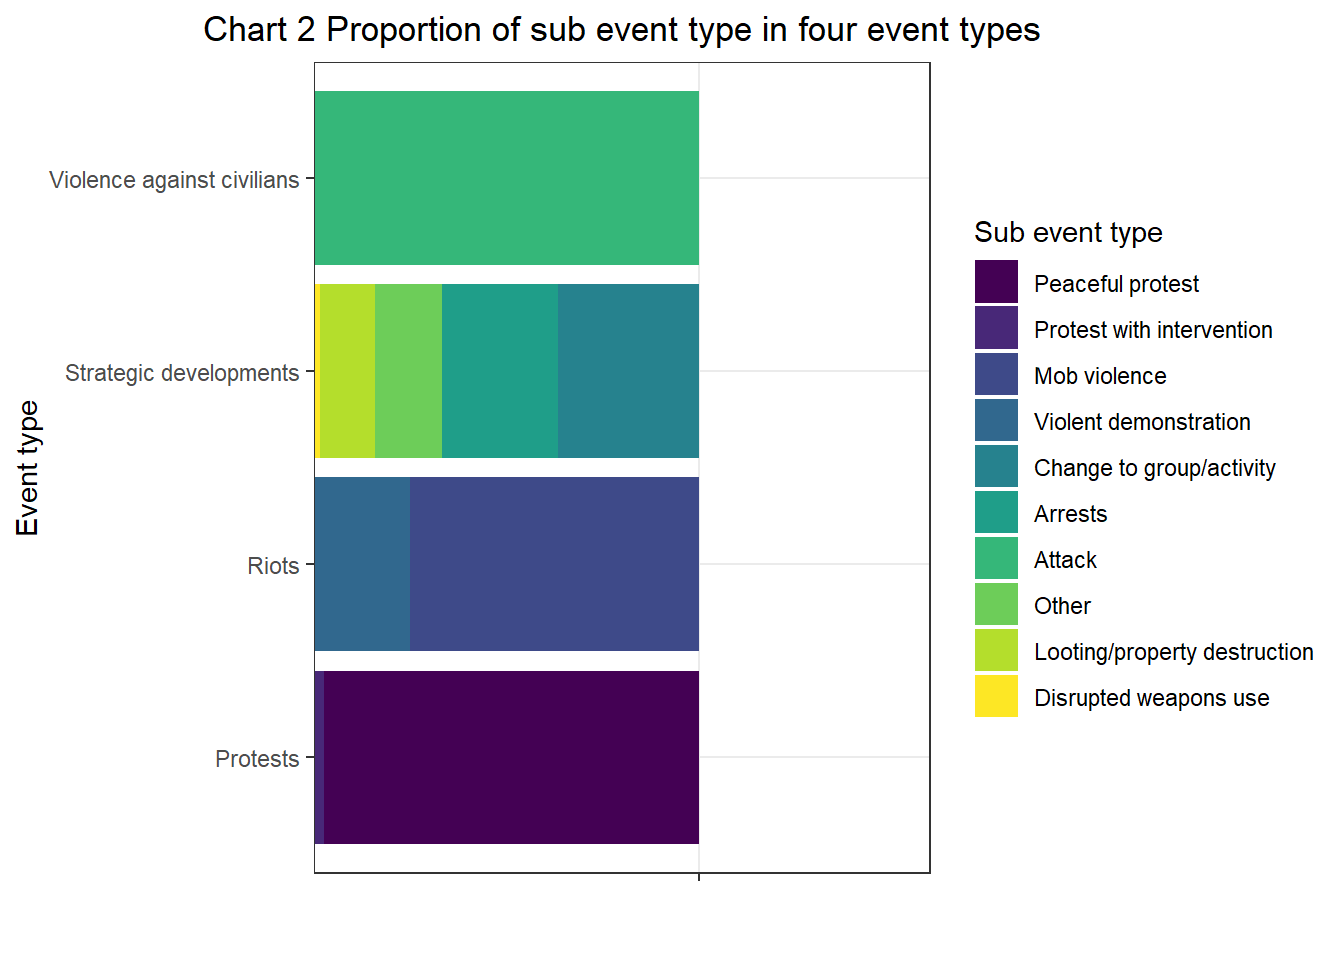
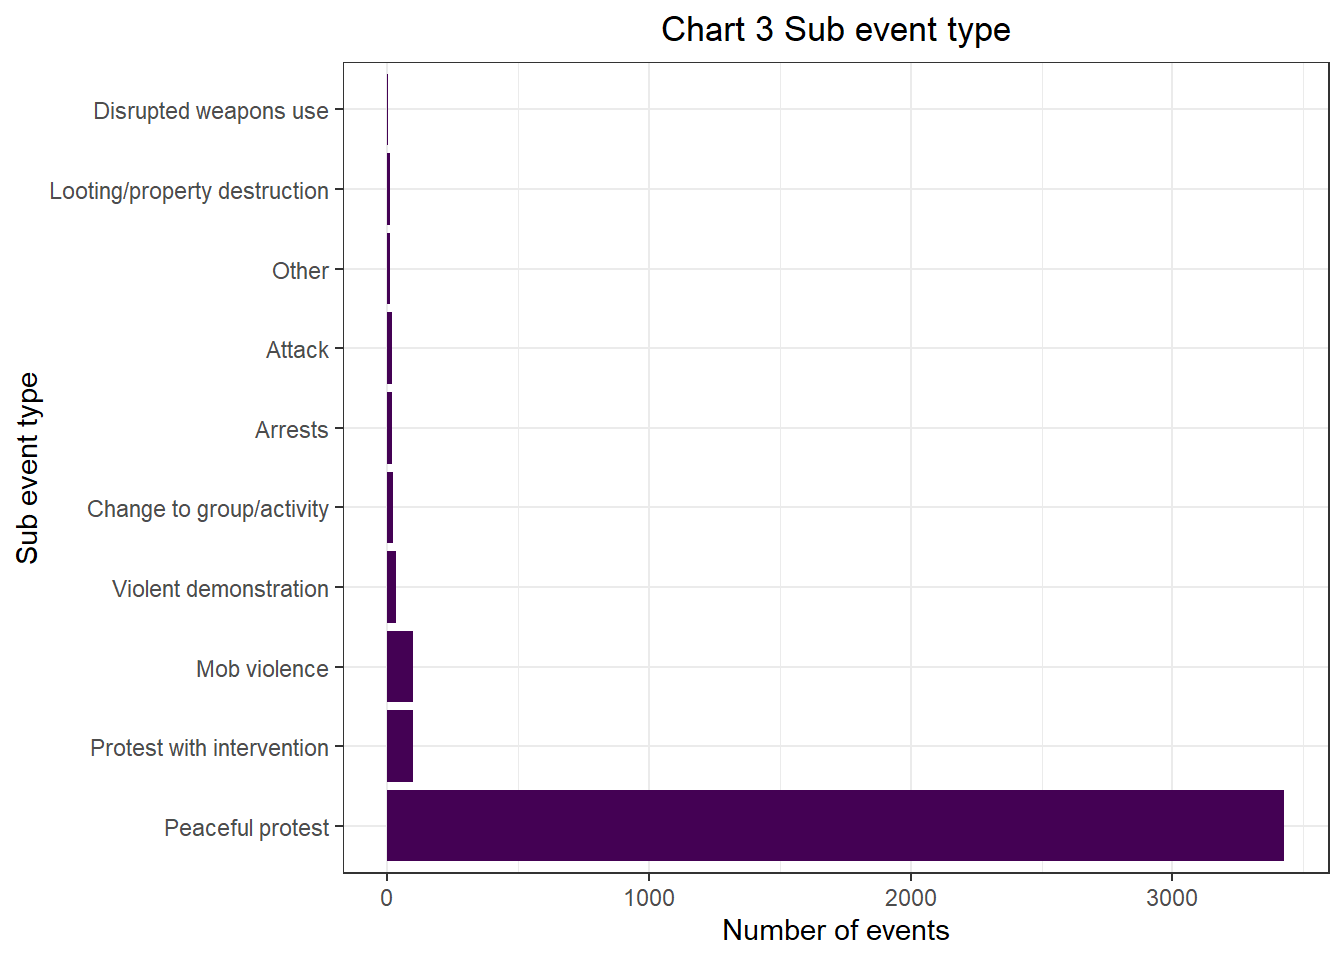
Four event types are divided into 10 subcategories which constitute variable “Sub event types”. Next two charts show - proportion of each sub event type in each event type (for all countries in 2021), - number of events of each sub event type (for all countries in 2021).
“Protest” can be “peaceful” or “with intervention” (means that peaceful protesters are intervened by some opposition group). Vast majority of protests are peaceful (chart 2). Also “Peaceful protest” constituted for 91,8% of all events (3427 of 3734) in nine countries in 2021 (chart 3).
“Riots” are divided into “mob violence” (violent action of group against another group) and “violent demonstration” (vandalism, road-blocking, using barricades etc). Mob violence is more frequent and than violent demonstration (chart 2).
“Sttrategic development” has 5 categories. Most frequent if them are “change of group/activity” (refers to state forces) and “arrests” (chart 2).
“Violence against civilians” contained “Attack” (chart 2). Attacks against civilians are not frequent - 18 cases of 3734 (chart 3) which is 0,5% of all events.
So these two charts answer the question about which subcategory dominates in event types and which subcategory is more common among subcategories in general. I think that popularity of peaceful protests and relatively little percent of interrupted protests is a sign of stability, freedom of political activism and sefty of protesters. Also it is interesting that when we refer to Riots we refer more to violence of group against group than about vandalism. This fact may be interesting for further analysis.
Code
ggplot(protests, aes(y="", x=event_type, fill = sub_event_type)) +geom_bar(position="fill", stat="identity") +coord_flip() +xlab("Event type") +ylab ("") +theme_bw() +scale_fill_viridis(discrete = T) +ggtitle ("Chart 2 Proportion of sub event type in four event types") +labs (fill ="Sub event type") +theme(plot.title =element_text(hjust =0.5))
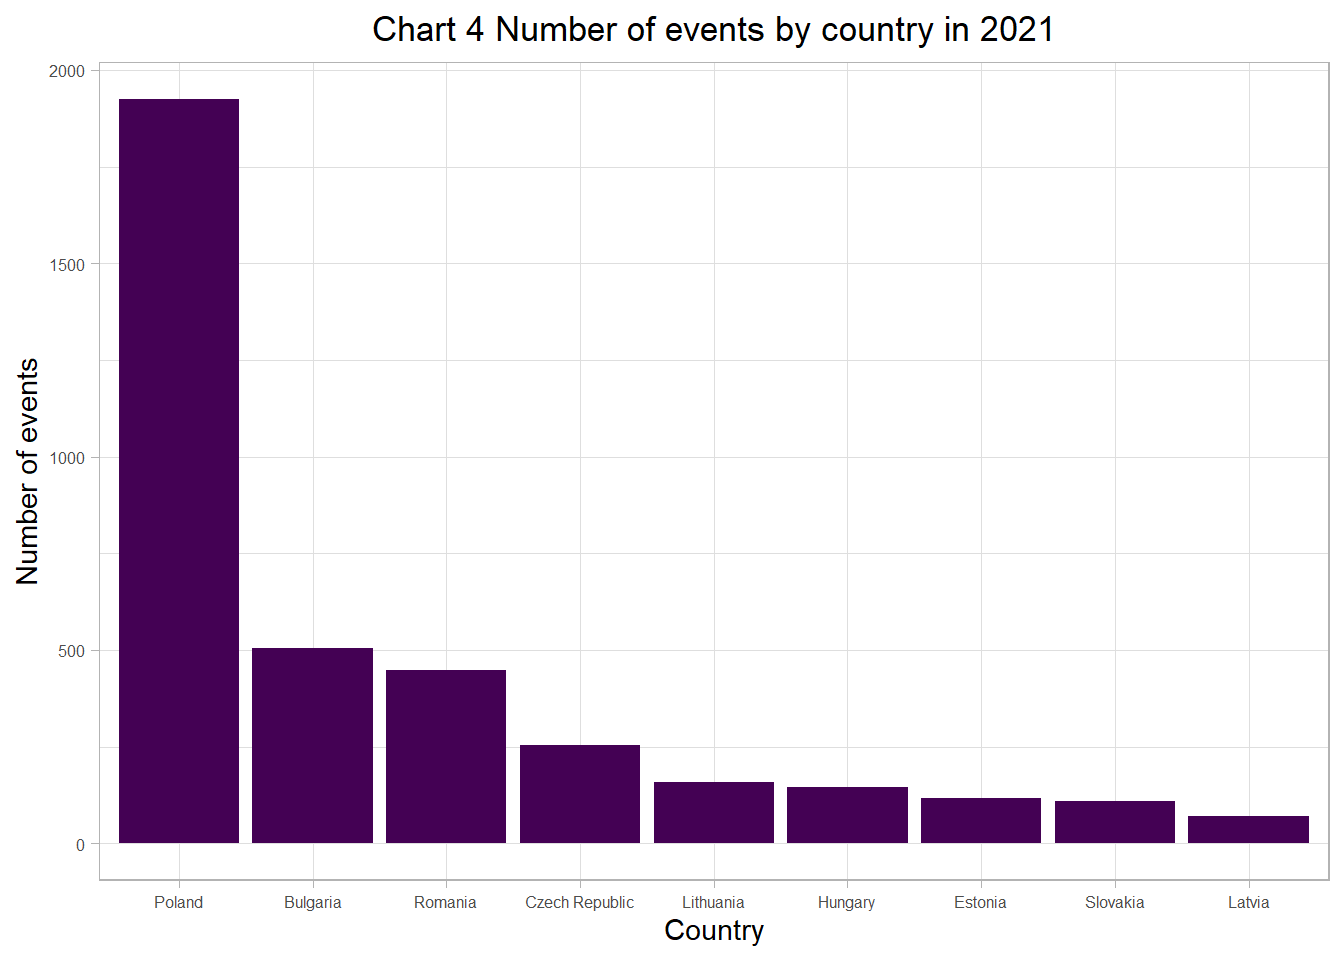
Next chart shows number of events by country. We can clearly see difference between Poland and other countries. Polish protests are 51% of all in the region.
Code
ggplot(protests, aes(country)) +geom_bar(fill="#440154ff") +theme_light() +theme(axis.text =element_text(size =6)) +ggtitle("Chart 4 Number of events by country in 2021") +ylab("Number of events") +xlab("Country") +theme(plot.title =element_text(hjust =0.5))
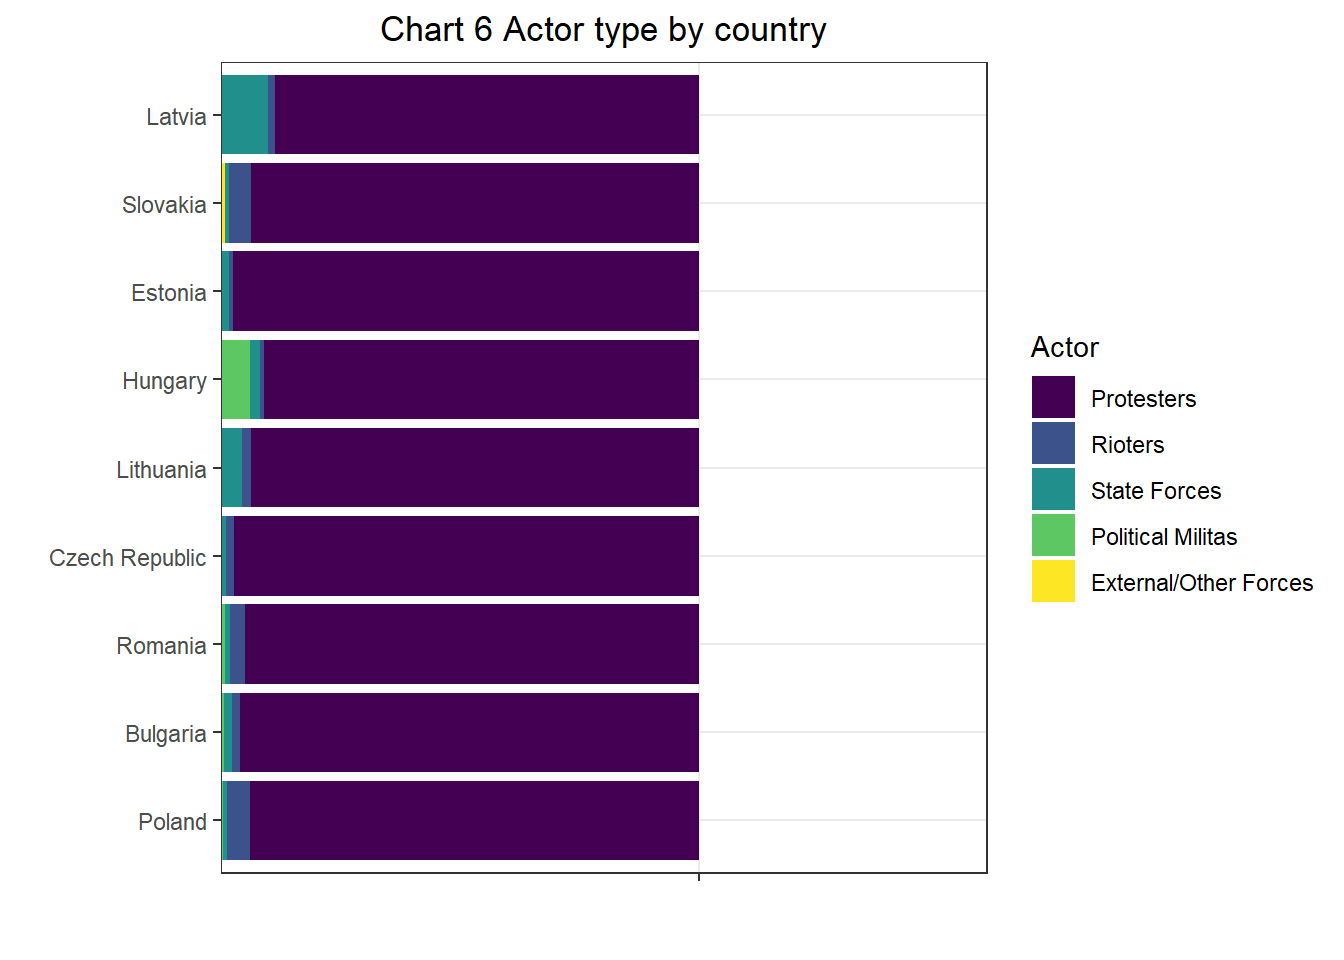
Chart 5 and 6 answer to the question what type of event is more popular in each country and who is actor at these events. At chart 5 we can see which event type was more frequent in each country. For example there were more events of violence against civilians than in other countries. Latvia has more strategic developments. Chart 6 shows who frequently is an actor in political activism and political violence.
ggplot(protests, aes(y="", x=country, fill = actor1_type)) +geom_bar(position="fill", stat="identity") +coord_flip() +xlab("") +ylab ("") +theme_bw() +scale_fill_viridis(discrete = T) +ggtitle ("Chart 6 Actor type by country") +labs (fill ="Actor") +theme(plot.title =element_text(hjust =0.5))
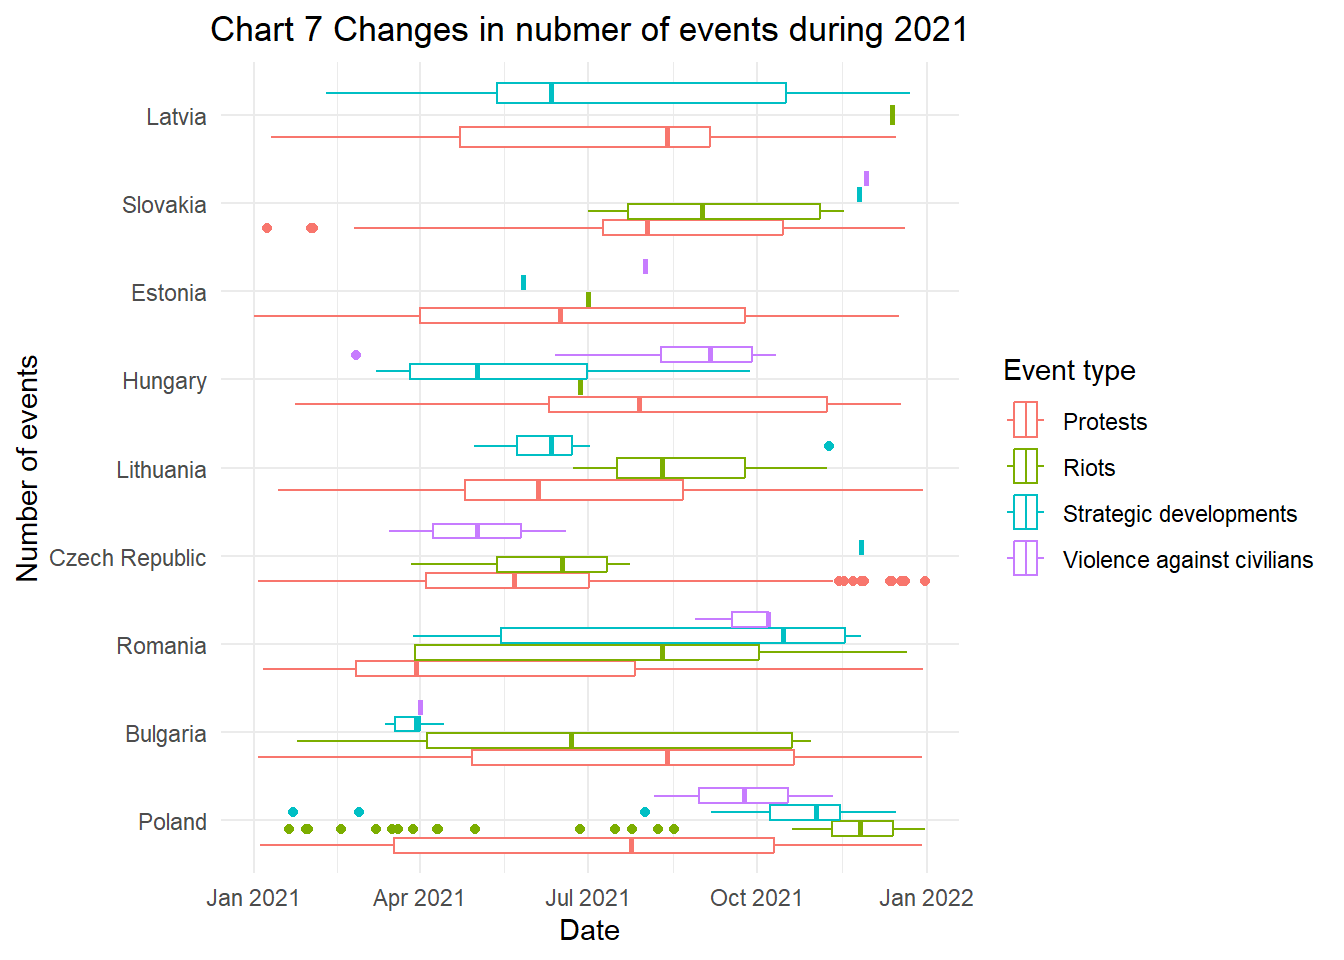
Next chart shows during which season in 2021 different types of event where more frequent. It gives information only about 2021. It should answer the question if there are some period of year when protest/riots or other event are less popular. This data do not show enough cases to make some presumption. But this graph reflects the idea that weather influences protest activities.
Code
ggplot(protests, aes(x = event_date, y = country, color = event_type)) +geom_boxplot() +labs(title ="Chart 7 Changes in nubmer of events during 2021",x ="Date",y ="Number of events") +theme_minimal() +theme(plot.title =element_text(hjust =0.5)) +labs(color ="Event type")
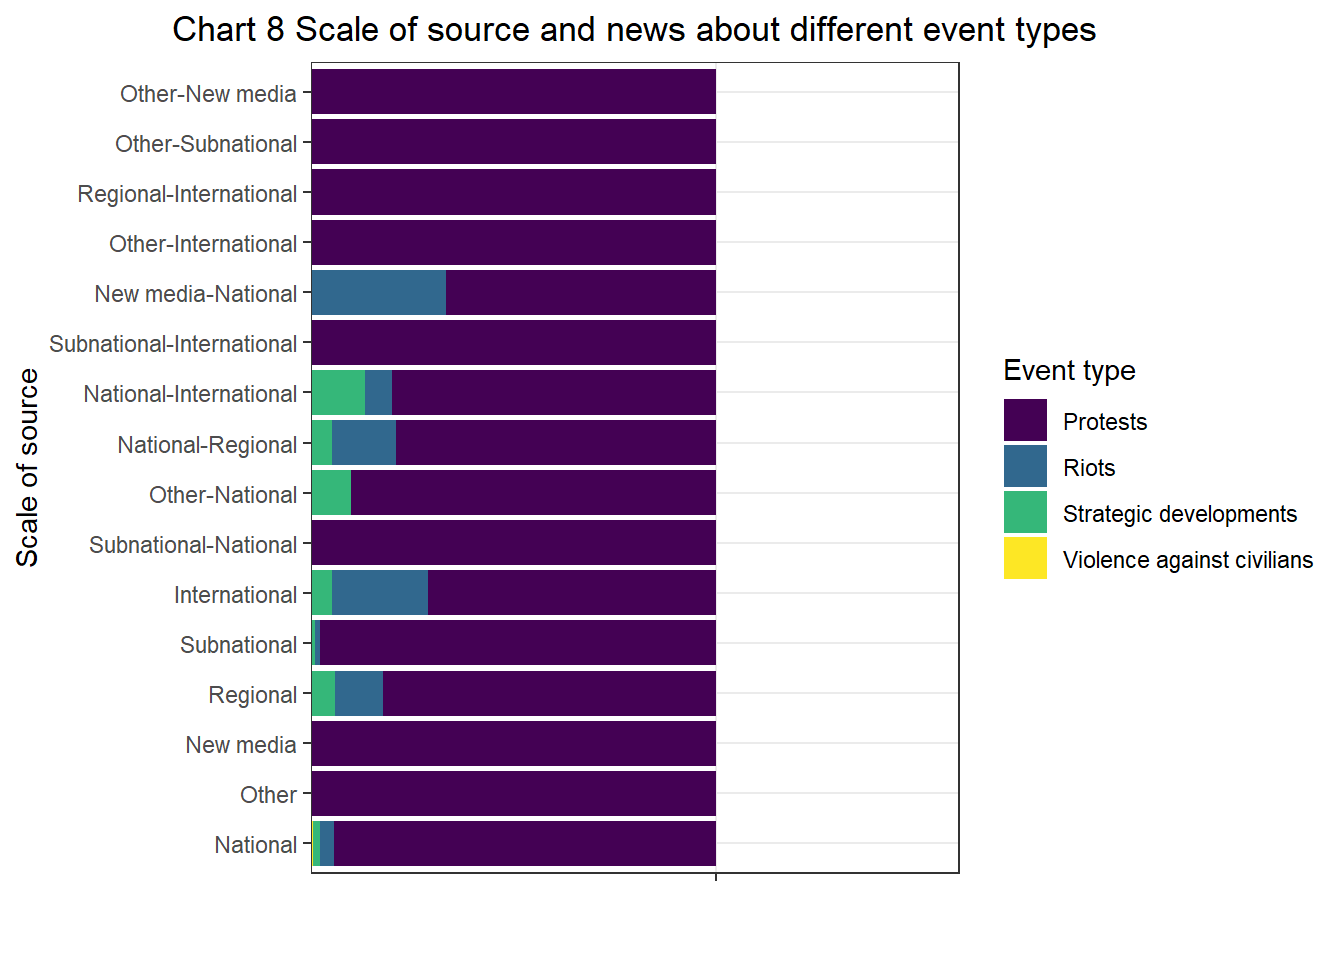
Last chart shows which type of event is more frequent in different media. For example international media have bigger proportion of mentions about riots. It may be due to different reasons but I think it would be worth to make further exploration. Radicals tend to seek media attention so we may look where they get it.
Code
ggplot(protests, aes(y="", x=source_scale, fill = event_type)) +geom_bar(position="fill", stat="identity") +coord_flip() +xlab("Scale of source") +ylab ("") +theme_bw() +scale_fill_viridis(discrete = T) +ggtitle ("Chart 8 Scale of source and news about different event types") +labs (fill ="Event type") +theme(plot.title =element_text(hjust =0.5))
the visualization do not answer how two actors interact and in which country state actor is more active with protesters
when I finished working with the data I understood that charts are very simple because data is categorical so I am not sure how if I can choose this dataset for final project
Source Code
---title: "HW3"author: "Mariia Dubyk"desription: "HW3"date: "10/12/2022"format: html: toc: true code-fold: true code-copy: true code-tools: truecategories: - HW3---```{r}#| label: setup#| warning: falselibrary(tidyverse)library(ggplot2)knitr::opts_chunk$set(echo =TRUE)```HW3- Tasks from HW2 (Read in a dataset, clean data, provide narrative)- Include descriptive statistics (e.g, mean, median, and standard deviation for numerical variables, and frequencies and/or mode for categorical variables- Include relevant visualizations using ggplot2 to complement these descriptive statistics. Be sure to use faceting, coloring, and titles as needed. Each visualization should be accompanied by descriptive text that highlights: the variable(s) used what questions might be answered with the visualizations what conclusions you can draw- Use group_by() and summarize() to compute descriptive stats and/or visualizations for any relevant groupings. For example, if you were interested in how average income varies by state, you might compute mean income for all states combined, and then compare this to the range and distribution of mean income for each individual state in the US.- Identify limitations of your visualization, such as: What questions are left unanswered with your visualizations What about the visualizations may be unclear to a naive viewer How could you improve the visualizations for the final project## Read in a datasetI decided to use the same data as for HW2 from open source called The Armed Conflict Location & Event Data Project (ACLED) https://acleddata.com/about-acled/.```{r}library(readr)library(summarytools)protest_orig <-read.csv("_data/protest.csv", head =TRUE, sep=";")print(dfSummary(protest_orig, varnumbers =FALSE,na.col =FALSE,style ="multiline",plain.ascii =FALSE,headings =FALSE,graph.magnif = .8),method ="render")```## Brief description of the dataThe dataset contains information about protests and acts of political violence (including state) in 9 EU countries of Eastern and Central Europe in 2021. - The dataframe includes 3734 cases. Each case is event (protest/terrorist attack/armed forces action etc)- There are 31 variables(1) Variables contain information about the event: date, event type, sub event type, type of actors and their interaction ("inter1", "inter2", "interaction"), actors names, place, source of information, notes (details of what happened during the protest) and number of fatalities. Columns 5-6,8-24,26-29.(2) Variables that contain different numeric and character identifiers of the country and event.Columns 1-4,7,25,30-31.## Clean the data- Remove certain columns.The same as in HW2.I also decided to remove columns 10-11, 13-14. They contain information about a specific organization (name, country). It seems to me that this kind of data needs qualitative analysis or some categorization. Variable inter1 and inter2 contain information about actors. They categorize actors to 5 (inter1) and 6 (inter2) groups. Probably some detailed categorization is needed (like ideology of the organization) but that is a task for bigger research or a question of how data is gethered.- Organize dates (in a different way than in HW2)- Replace empty sting- Mutate variables due to the codebook https://acleddata.com/acleddatanew/wp-content/uploads/2021/11/ACLED_Codebook_v1_January-2021.pdf- rename variables```{r}# Leave selected columnsprotests <-select(protest_orig, "data_id", "event_date", "event_type", "sub_event_type", "inter1", "inter2", "interaction", "country", "admin1", "location", "latitude", "longitude", "source_scale", "fatalities")# Organize dateslibrary(date)protests$event_date <-as.Date(protests$event_date, format("%d.%m.%Y"))class(protests$event_date)# Replace empty sting with NA'slibrary(dplyr) protests <-na_if(protests, '')# Change variables due to the codebookprotests <- protests %>%mutate(inter1 =case_when( inter1 ==1~"State Forces", inter1 ==3~"Political Militas", inter1 ==5~"Rioters", inter1 ==6~"Protesters", inter1 ==8~"External/Other Forces"))protests <- protests %>%mutate(inter2 =case_when( inter2 ==1~"State Forces", inter2 ==3~"Political Militas", inter2 ==5~"Rioters", inter2 ==6~"Protesters", inter2 ==7~"Civilians", inter2 ==8~"External/Other Forces", inter2 ==0~"NA"))protests$inter2 <-na_if(protests$inter2, 'NA')protests <- protests %>%mutate(interaction =case_when(interaction ==10~"sole military action", interaction ==13~"military versus political militia", interaction ==15~"military versus rioters", interaction ==16~"military versus protesters", interaction ==17~"military versus civilians", interaction ==18~"military versus other", interaction ==33~"political militia versus political militia", interaction ==37~"political militia versus civilians", interaction ==50~"sole rioter action", interaction ==55~"rioters versus rioters", interaction ==56~"rioters versus protesters", interaction ==57~"rioters versus civilians", interaction ==58~"rioters versus others", interaction ==60~"sole protester action", interaction ==66~"protesters versus protesters", interaction ==78~"other actor versus civilians", interaction ==80~"sole other action"))# Renameprotests <- protests %>%rename("actor1_type"="inter1", "actor2_type"="inter2")# Reorder variableslibrary(forcats)protests <- protests %>%mutate(sub_event_type =fct_relevel(sub_event_type, "Peaceful protest", "Protest with intervention", "Mob violence", "Violent demonstration", "Change to group/activity", "Arrests", "Attack", "Other", "Looting/property destruction", "Disrupted weapons use"))protests <- protests %>%mutate(actor1_type =fct_relevel(actor1_type, "Protesters", "Rioters", "State Forces", "Political Militas", "External/Other Forces"))protests <- protests %>%mutate(actor2_type =fct_relevel(actor2_type, "State Forces", "Civilians", "Protesters", "Rioters", "Political Militas", "External/Other Forces"))protests <- protests %>%mutate(country =fct_relevel(country, "Poland", "Bulgaria", "Romania", "Czech Republic", "Lithuania", "Hungary", "Estonia", "Slovakia", "Latvia"))table(protests$source_scale)protests <- protests %>%mutate(source_scale =fct_relevel(source_scale, "National", "Other", "New media", "Regional", "Subnational", "International", "Subnational-National", "Other-National", "National-Regional", "National-International", "Subnational-International", "New media-National", "Other-International", "Regional-International", "Other-Subnational", "Other-New media"))```## Provide a narrative about the data setThe dataset gives information about protests and acts of political violence in 9 countries of Eastern and Central Europe (all counties are in the European Union) in 2021. The countries included in the dataframe are Bulgaria, Czech Republic, Estonia, Hungary, Latvia, Lithuania, Poland, Romania, Slovakia. The cases are events. So we have all information about the protest event. When and where it happened, who took part in it, was it peaceful or violet, how many fatalities it had and from which source we know about it.(1) What happened?Variables "event_type", "sub_event_type" and "fatalities" gives information about how we categorize political event. "event_type", "sub_event_type" are categorical variables which mean type of the event and basically refer to different levels and types of radicalization during the protest.(2) When the event happened? Variable "event_date" contains information about event day, month and year.(3) Where it happened? There are several variables which help to understand where protest took place. They all are categorical. First, we know "country", second, administrative division ("admin1"),third, city or village ("location"). Columns "longitude" and "latitude" may be used to visualize a map of events.(4) Who participated?- Variables "actor1_type" and "actor2_type" give information about type of group which took part in the event. actor1_type has 5 types, actor2_type 6. "Interaction" contains 17 types of interaction which are different combinations of actors. These variables are categorical.It is important to understand that actors and divided into two main groups. First is main actor, the one who organizes the protest (column "actor1", "assoc_actor", "inter1") and the one who plays role of the opposition at the event for example police or opposing organization ("actor2", "assoc_actor2", "inter2"). Interaction between them is categorized in variable "interaction"### Descriptive statisticsIn 2021 most frequent type of event was protest. 3525 of 3734 which constitutes 94,4% of all events (variable event type). Protests and Strategic Developments do not contain violence while Riots and Violence against civilians are radical actions which contain different type of violent behavior. At the next chart we see proportions of these 4 event types in all nine countries.*Strategic Developments are non violent actions of state and non-state groups which possibly can use violence (for example peace agreements). This type is captured to track all activities of possibly violent groups.The chart answers the questions about what type of political activism and political violence is most frequent in Eastern Europe countries. We see that vast majority of events are peaceful. It states for some level of political stability in the region. It is important to remember that data refers to Eastern European countries that are members of the European Union, so the conclusion is representational not for Eastern Europe in general but for a geographical group of countries within the EU.```{r}library(viridis)ggplot(protests, aes(x ="", y ="", fill = event_type)) +geom_col() +guides(fill =guide_legend(title ="Event Type")) +scale_fill_viridis_d() +coord_polar(theta ="y") +theme_void() +ggtitle("Chart 1 Proportion of different event types") +theme(plot.title =element_text(hjust =0.5))```Four event types are divided into 10 subcategories which constitute variable "Sub event types". Next two charts show- proportion of each sub event type in each event type (for all countries in 2021),- number of events of each sub event type (for all countries in 2021)."Protest" can be "peaceful" or "with intervention" (means that peaceful protesters are intervened by some opposition group). Vast majority of protests are peaceful (chart 2). Also "Peaceful protest" constituted for 91,8% of all events (3427 of 3734) in nine countries in 2021 (chart 3)."Riots" are divided into "mob violence" (violent action of group against another group) and "violent demonstration" (vandalism, road-blocking, using barricades etc). Mob violence is more frequent and than violent demonstration (chart 2)."Sttrategic development" has 5 categories. Most frequent if them are "change of group/activity" (refers to state forces) and "arrests" (chart 2)."Violence against civilians" contained "Attack" (chart 2). Attacks against civilians are not frequent - 18 cases of 3734 (chart 3) which is 0,5% of all events.So these two charts answer the question about which subcategory dominates in event types and which subcategory is more common among subcategories in general. I think that popularity of peaceful protests and relatively little percent of interrupted protests is a sign of stability, freedom of political activism and sefty of protesters.Also it is interesting that when we refer to Riots we refer more to violence of group against group than about vandalism. This fact may be interesting for further analysis.```{r}ggplot(protests, aes(y="", x=event_type, fill = sub_event_type)) +geom_bar(position="fill", stat="identity") +coord_flip() +xlab("Event type") +ylab ("") +theme_bw() +scale_fill_viridis(discrete = T) +ggtitle ("Chart 2 Proportion of sub event type in four event types") +labs (fill ="Sub event type") +theme(plot.title =element_text(hjust =0.5))``````{r}ggplot(protests, aes(sub_event_type)) +geom_bar(fill="#440154ff") +coord_flip() +xlab("Sub event type") +ylab ("Number of events") +theme_bw() +scale_fill_viridis(discrete = T) +ggtitle ("Chart 3 Sub event type") +theme(plot.title =element_text(hjust =0.5))```Next chart shows number of events by country. We can clearly see difference between Poland and other countries. Polish protests are 51% of all in the region. ```{r}ggplot(protests, aes(country)) +geom_bar(fill="#440154ff") +theme_light() +theme(axis.text =element_text(size =6)) +ggtitle("Chart 4 Number of events by country in 2021") +ylab("Number of events") +xlab("Country") +theme(plot.title =element_text(hjust =0.5))```Chart 5 and 6 answer to the question what type of event is more popular in each country and who is actor at these events. At chart 5 we can see which event type was more frequent in each country. For example there were more events of violence against civilians than in other countries. Latvia has more strategic developments. Chart 6 shows who frequently is an actor in political activism and political violence.```{r}ggplot(protests, aes(y="", x=country, fill = event_type)) +geom_bar(position="fill", stat="identity") +xlab("") +ylab ("") +theme_bw() +theme(axis.text =element_text(size =6)) +scale_fill_viridis(discrete = T) +ggtitle ("Chart 5 Event type by country") +labs (fill ="Event type") +theme(plot.title =element_text(hjust =0.5))``````{r}ggplot(protests, aes(y="", x=country, fill = actor1_type)) +geom_bar(position="fill", stat="identity") +coord_flip() +xlab("") +ylab ("") +theme_bw() +scale_fill_viridis(discrete = T) +ggtitle ("Chart 6 Actor type by country") +labs (fill ="Actor") +theme(plot.title =element_text(hjust =0.5))```Next chart shows during which season in 2021 different types of event where more frequent. It gives information only about 2021. It should answer the question if there are some period of year when protest/riots or other event are less popular. This data do not show enough cases to make some presumption. But this graph reflects the idea that weather influences protest activities.```{r}ggplot(protests, aes(x = event_date, y = country, color = event_type)) +geom_boxplot() +labs(title ="Chart 7 Changes in nubmer of events during 2021",x ="Date",y ="Number of events") +theme_minimal() +theme(plot.title =element_text(hjust =0.5)) +labs(color ="Event type")```Last chart shows which type of event is more frequent in different media. For example international media have bigger proportion of mentions about riots. It may be due to different reasons but I think it would be worth to make further exploration. Radicals tend to seek media attention so we may look where they get it.```{r}ggplot(protests, aes(y="", x=source_scale, fill = event_type)) +geom_bar(position="fill", stat="identity") +coord_flip() +xlab("Scale of source") +ylab ("") +theme_bw() +scale_fill_viridis(discrete = T) +ggtitle ("Chart 8 Scale of source and news about different event types") +labs (fill ="Event type") +theme(plot.title =element_text(hjust =0.5))```- the visualization do not answer how two actors interact and in which country state actor is more active with protesters - when I finished working with the data I understood that charts are very simple because data is categorical so I am not sure how if I can choose this dataset for final project