library(tidyverse)
library(ggplot2)
library(lubridate)

knitr::opts_chunk$set(echo = TRUE, warning=FALSE, message=FALSE)
Challenge 8
challenge_8
snl
Joining Data
Challenge Overview
Today’s challenge is to:
- read in multiple data sets, and describe the data set using both words and any supporting information (e.g., tables, etc)
- tidy data (as needed, including sanity checks)
- mutate variables as needed (including sanity checks)
- join two or more data sets and analyze some aspect of the joined data
(be sure to only include the category tags for the data you use!)
Read in data
Read in one (or more) of the following datasets, using the correct R package and command.
- military marriages ⭐⭐
- faostat ⭐⭐
- railroads ⭐⭐⭐
- fed_rate ⭐⭐⭐
- debt ⭐⭐⭐
- us_hh ⭐⭐⭐⭐
- snl ⭐⭐⭐⭐⭐
snl_seasons <- read_csv("_data/snl_seasons.csv")
snl_casts <- read_csv("_data/snl_casts.csv")
snl_actors <- read_csv("_data/snl_actors.csv")

view(snl_seasons)
view(snl_casts)
view(snl_actors)
Briefly describe the data
I imported three datasets related to SNL(Saturday Night Live). I’ll start with the snl_seasons dataset. It describes when the season started and ended and how many episodes each season consisted of. The snl_casts dataset describes the number of episodes each cast member was there for and their name. Sometimes the first episode or the last episode they appeared on was included. Something to be noted is that both snl_seasons and snl_casts datasets included a sid (season id) which I can use as a primary key to join both of these datasets. In the snl_actors dataset, we have the actors name, gender, if they were an actor or cast member and some url. A note here is that both the snl_casts and snl_actors datasets includes an aid (actor id) that I can use as the primary key to join these two datasets.
Tidy Data (as needed)
Is your data already tidy, or is there work to be done? Be sure to anticipate your end result to provide a sanity check, and document your work here.
  snl_seasons$first_epid <- ymd(snl_seasons$first_epid)
  snl_seasons$last_epid <- ymd(snl_seasons$last_epid)
  snl_seasons
# A tibble: 46 × 5
sid year first_epid last_epid n_episodes
<dbl> <dbl> <date> <date> <dbl>
1 1 1975 1975-10-11 1976-07-31 24
2 2 1976 1976-09-18 1977-05-21 22
3 3 1977 1977-09-24 1978-05-20 20
4 4 1978 1978-10-07 1979-05-26 20
5 5 1979 1979-10-13 1980-05-24 20
6 6 1980 1980-11-15 1981-04-11 13
7 7 1981 1981-10-03 1982-05-22 20
8 8 1982 1982-09-25 1983-05-14 20
9 9 1983 1983-10-08 1984-05-12 19
10 10 1984 1984-10-06 1985-04-13 17
# … with 36 more rows snl_casts$first_epid <- ymd(snl_casts$first_epid)
snl_casts$last_epid <- ymd(snl_casts$last_epid)
snl_casts %>% filter(!is.na(first_epid)|!is.na(last_epid))# A tibble: 67 × 8
aid sid featured first_epid last_epid updat…¹ n_epi…² seaso…³
<chr> <dbl> <lgl> <date> <date> <lgl> <dbl> <dbl>
1 A. Whitney Brown 11 TRUE 1986-02-22 NA FALSE 8 0.444
2 Alan Zweibel 5 TRUE 1980-04-09 NA FALSE 5 0.25
3 Sasheer Zamata 39 TRUE 2014-01-18 NA FALSE 11 0.524
4 Fred Wolf 22 TRUE NA 1996-10-19 FALSE 3 0.15
5 Casey Wilson 33 TRUE 2008-02-23 NA FALSE 8 0.667
6 Kristen Wiig 31 TRUE 2005-11-12 NA FALSE 15 0.789
7 Patrick Weathers 6 TRUE 1980-12-13 NA FALSE 10 0.769
8 Damon Wayans 11 TRUE NA 1986-03-15 FALSE 12 0.667
9 Michaela Watkins 34 TRUE 2008-11-15 NA FALSE 15 0.682
10 Julia Sweeney 16 TRUE 1990-11-10 NA FALSE 16 0.8
# … with 57 more rows, and abbreviated variable names ¹update_anchor,
# ²n_episodes, ³season_fraction snl_casts# A tibble: 614 × 8
aid sid featured first_epid last_epid update…¹ n_epi…² seaso…³
<chr> <dbl> <lgl> <date> <date> <lgl> <dbl> <dbl>
1 A. Whitney Brown 11 TRUE 1986-02-22 NA FALSE 8 0.444
2 A. Whitney Brown 12 TRUE NA NA FALSE 20 1
3 A. Whitney Brown 13 TRUE NA NA FALSE 13 1
4 A. Whitney Brown 14 TRUE NA NA FALSE 20 1
5 A. Whitney Brown 15 TRUE NA NA FALSE 20 1
6 A. Whitney Brown 16 TRUE NA NA FALSE 20 1
7 Alan Zweibel 5 TRUE 1980-04-09 NA FALSE 5 0.25
8 Sasheer Zamata 39 TRUE 2014-01-18 NA FALSE 11 0.524
9 Sasheer Zamata 40 TRUE NA NA FALSE 21 1
10 Sasheer Zamata 41 FALSE NA NA FALSE 21 1
# … with 604 more rows, and abbreviated variable names ¹update_anchor,
# ²n_episodes, ³season_fractionAre there any variables that require mutation to be usable in your analysis stream? For example, do you need to calculate new values in order to graph them? Can string values be represented numerically? Do you need to turn any variables into factors and reorder for ease of graphics and visualization?
Document your work here.
I needed to turn the values of first and last episode of the snl_seasons and snl_casts datasets into readable dates. So the format of these dates are year-month-day. For the casts dataset, since a lot of the rows have N/A for both first and last episode date. I deleted those conditions and only kept the ones in which at least one value( first episode or last episode) doesn’t have N/A as the value.
snl_seasons_casts <- snl_casts %>%
  inner_join(snl_seasons, by = "sid")
snl_seasons_casts
# A tibble: 614 × 12
aid sid featu…¹ first_ep…² last_epi…³ updat…⁴ n_epi…⁵ seaso…⁶ year
<chr> <dbl> <lgl> <date> <date> <lgl> <dbl> <dbl> <dbl>
1 A. Whitney… 11 TRUE 1986-02-22 NA FALSE 8 0.444 1985
2 A. Whitney… 12 TRUE NA NA FALSE 20 1 1986
3 A. Whitney… 13 TRUE NA NA FALSE 13 1 1987
4 A. Whitney… 14 TRUE NA NA FALSE 20 1 1988
5 A. Whitney… 15 TRUE NA NA FALSE 20 1 1989
6 A. Whitney… 16 TRUE NA NA FALSE 20 1 1990
7 Alan Zweib… 5 TRUE 1980-04-09 NA FALSE 5 0.25 1979
8 Sasheer Za… 39 TRUE 2014-01-18 NA FALSE 11 0.524 2013
9 Sasheer Za… 40 TRUE NA NA FALSE 21 1 2014
10 Sasheer Za… 41 FALSE NA NA FALSE 21 1 2015
# … with 604 more rows, 3 more variables: first_epid.y <date>,
# last_epid.y <date>, n_episodes.y <dbl>, and abbreviated variable names
# ¹featured, ²first_epid.x, ³last_epid.x, ⁴update_anchor, ⁵n_episodes.x,
# ⁶season_fractionsnl <- snl_seasons_casts %>%
inner_join(snl_actors, by = "aid")
snl# A tibble: 614 × 15
aid sid featu…¹ first_ep…² last_epi…³ updat…⁴ n_epi…⁵ seaso…⁶ year
<chr> <dbl> <lgl> <date> <date> <lgl> <dbl> <dbl> <dbl>
1 A. Whitney… 11 TRUE 1986-02-22 NA FALSE 8 0.444 1985
2 A. Whitney… 12 TRUE NA NA FALSE 20 1 1986
3 A. Whitney… 13 TRUE NA NA FALSE 13 1 1987
4 A. Whitney… 14 TRUE NA NA FALSE 20 1 1988
5 A. Whitney… 15 TRUE NA NA FALSE 20 1 1989
6 A. Whitney… 16 TRUE NA NA FALSE 20 1 1990
7 Alan Zweib… 5 TRUE 1980-04-09 NA FALSE 5 0.25 1979
8 Sasheer Za… 39 TRUE 2014-01-18 NA FALSE 11 0.524 2013
9 Sasheer Za… 40 TRUE NA NA FALSE 21 1 2014
10 Sasheer Za… 41 FALSE NA NA FALSE 21 1 2015
# … with 604 more rows, 6 more variables: first_epid.y <date>,
# last_epid.y <date>, n_episodes.y <dbl>, url <chr>, type <chr>,
# gender <chr>, and abbreviated variable names ¹featured, ²first_epid.x,
# ³last_epid.x, ⁴update_anchor, ⁵n_episodes.x, ⁶season_fractionJoin Data
Be sure to include a sanity check, and double-check that case count is correct!
I joined snl seasons and casts datasets by the primary key sid and then further joined that joined dataset with primary key aid to add the snl actors dataset in.
snl %>%
   ggplot(aes(n_episodes.y, year, color = gender)) +
geom_point() 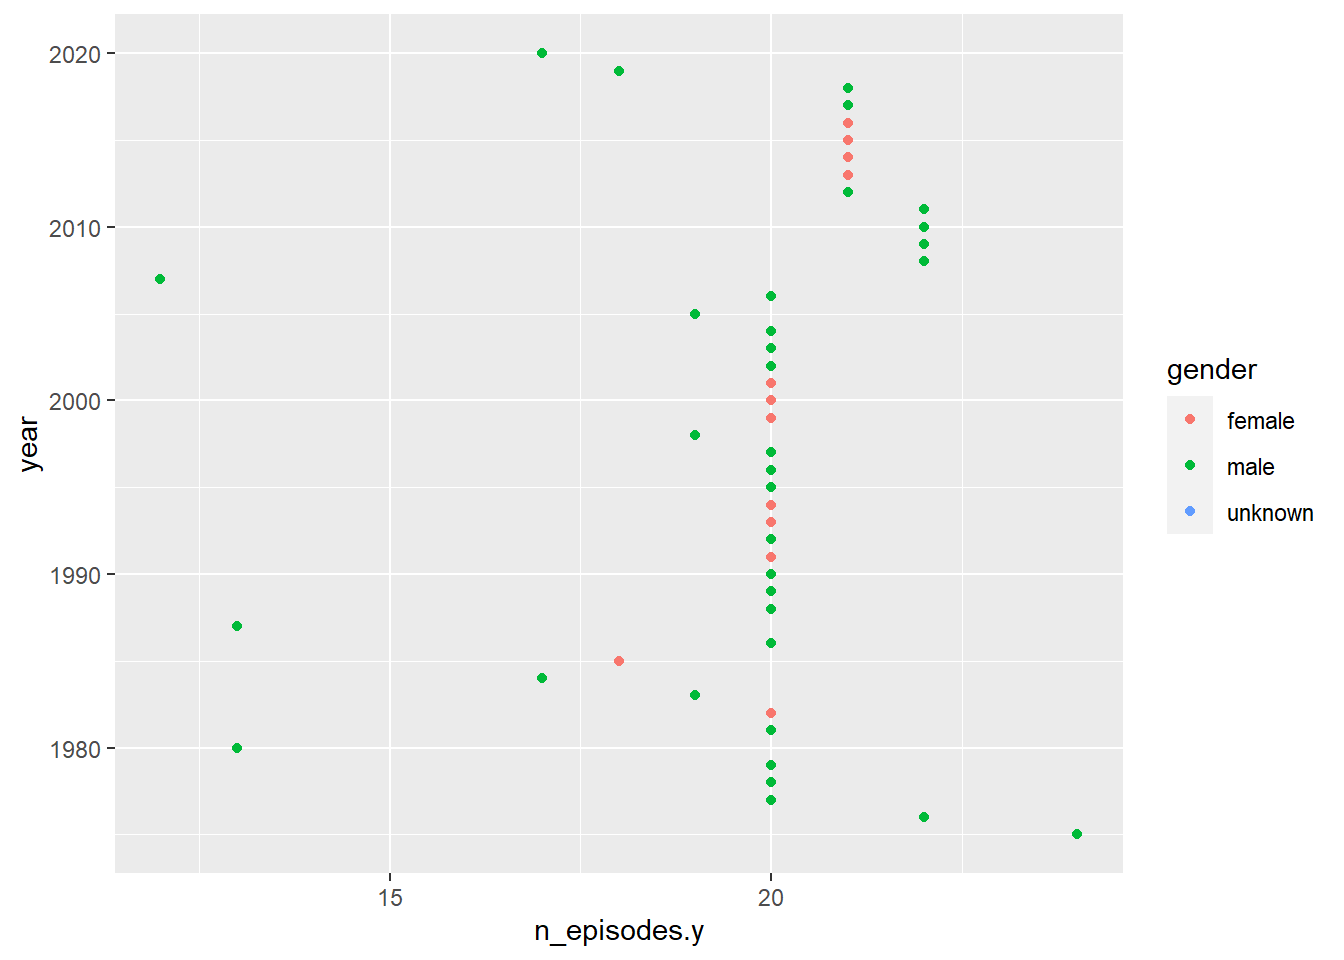
I wanted to see which gender did more snl episodes per year. We can see a lot of green dots which shows me that there were not that many female cast members/guests. However, most females were on the show somewhere between 18-22 episodes a year. The males on the show were there between 7 and 23 episodes a year.
snl %>%
   ggplot(aes(n_episodes.y, gender, color = featured)) +
geom_point() 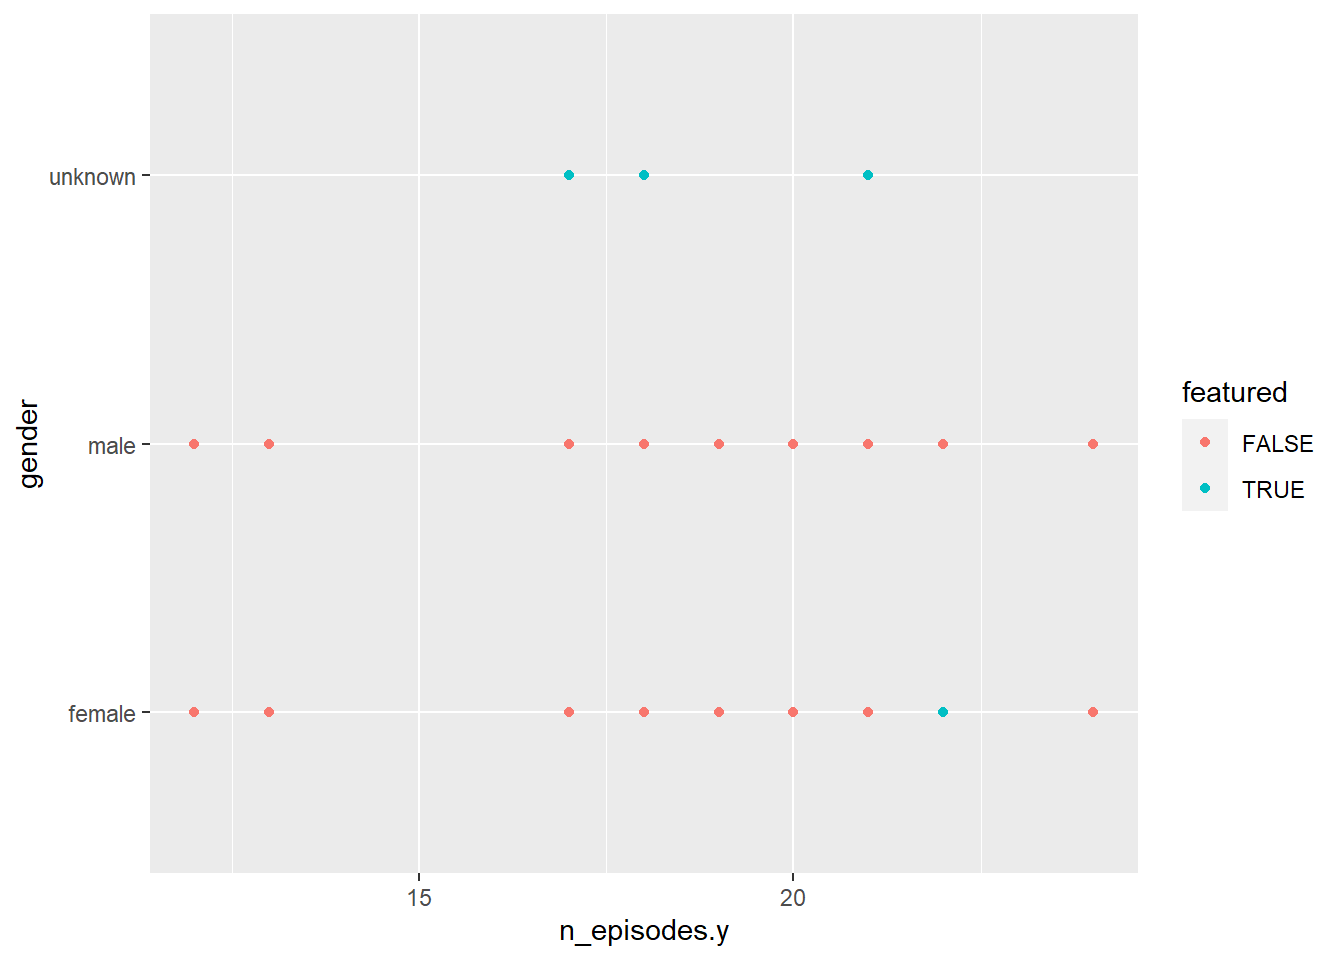
I can see here a lot the gender specified as “unknown” were featured on the show but not actual cast members. Only one female was featured on the show. The other males and females were all cast members and not just features.