library(tidyverse)

knitr::opts_chunk$set(echo = TRUE, warning=FALSE, message=FALSE)Homework 2
homwork_2
nfl_2019
library(readr)
nfl <- read_csv("_data/nfl2019.csv")
View(nfl)
nfl <- read_csv("_data/nfl2019.csv",
skip = 1,
col_names = c("delete", "Opponent", "Home_Ranking", "Opponent_Ranking", "Home_1st_Downs", "Home_Total_Yards", "Home_Passing_Yards", "Home_Rushing_Yards", "Home_Turnovers", "Opponent_1st_Downs", "Opponent_Total_Yards","Opponent_Passing_Yards", "Opponent_Rushing_Yards", "Opponent_Turnovers", "Home_Offensive_Ranking", "Home_Defensive_Ranking", "Home_Special_Teams", "Home", "Year", "Winner")) %>%
select(!starts_with("delete")) %>%
na_if("Skipped")Clean Data:
I needed to clean the data by renaming the columns to make more sense about which team’s values I’m looking at which is why each column except for the year and the winner has wither home or opponent attached to it. It was getting a little confusing without knowing which team had which ranking or which team got a certain number of passing yards. Clean data by assigning a number to each team name and a column with a W or L depending on which team wins and potential research questions include will the team with the most passing yards always win. Will the team with the most receiving yards always win? Will the team with a higher offensive rating. Rename columns to clean data as well. Will the team with the higher ranking let’s say >10 always win?
mean(nfl$Home_Total_Yards)[1] 348.048mean(nfl$Opponent_Total_Yards)[1] 346.2134mean(nfl$Home_Passing_Yards)[1] 231.8302mean(nfl$Opponent_Passing_Yards)[1] 230.5542mean(nfl$Home_Rushing_Yards)[1] 116.2179mean(nfl$Opponent_Rushing_Yards)[1] 115.6592nfl%>%
ggplot(aes(x=`Home_Passing_Yards`, y=`Year`)) +
geom_point()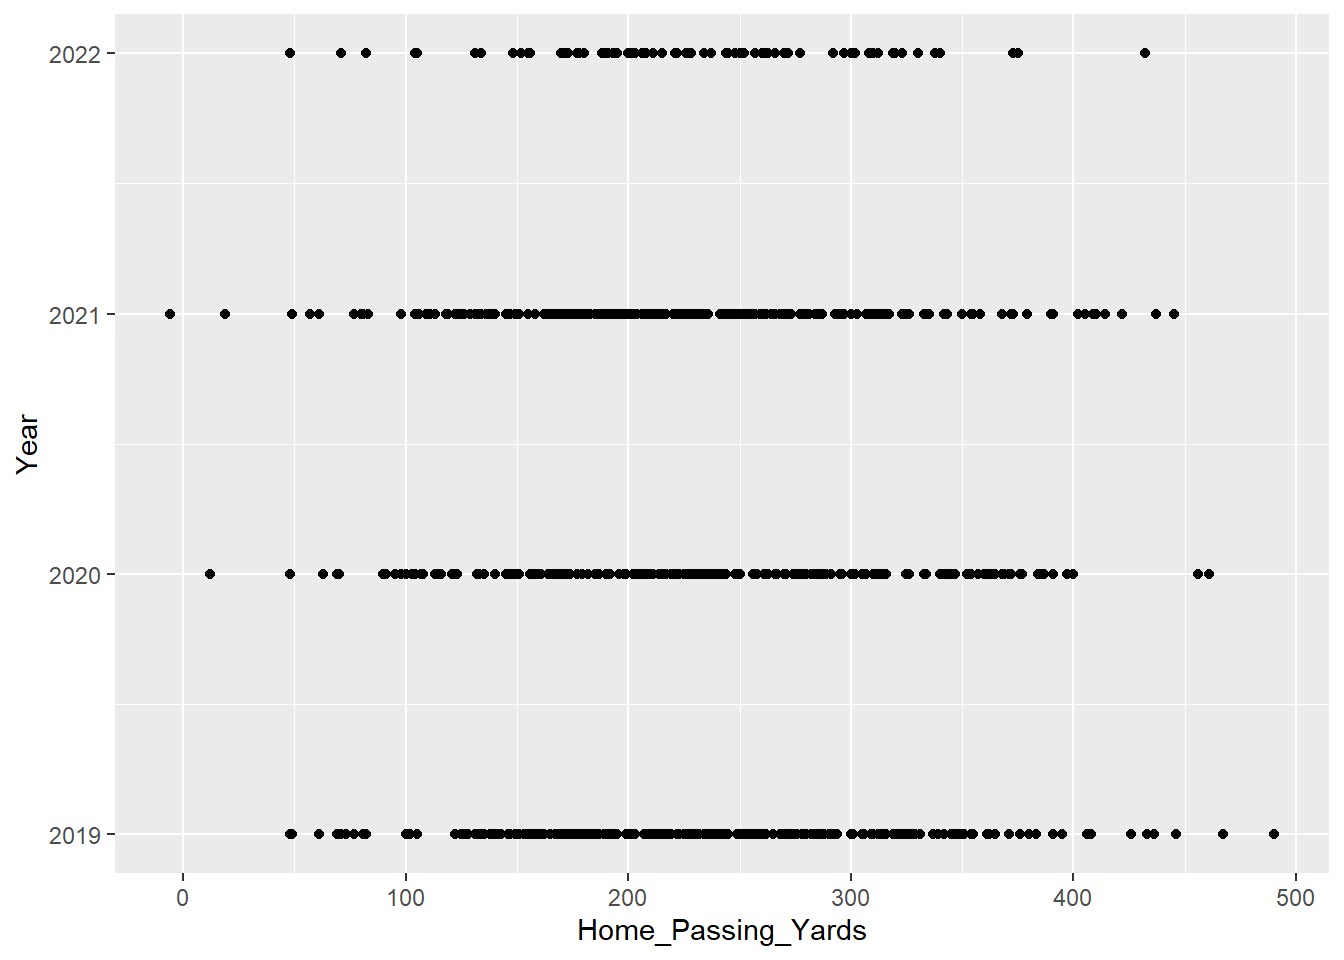
nfl%>%
  ggplot(aes(x=`Opponent_Passing_Yards`, y=`Year`)) +
  geom_point()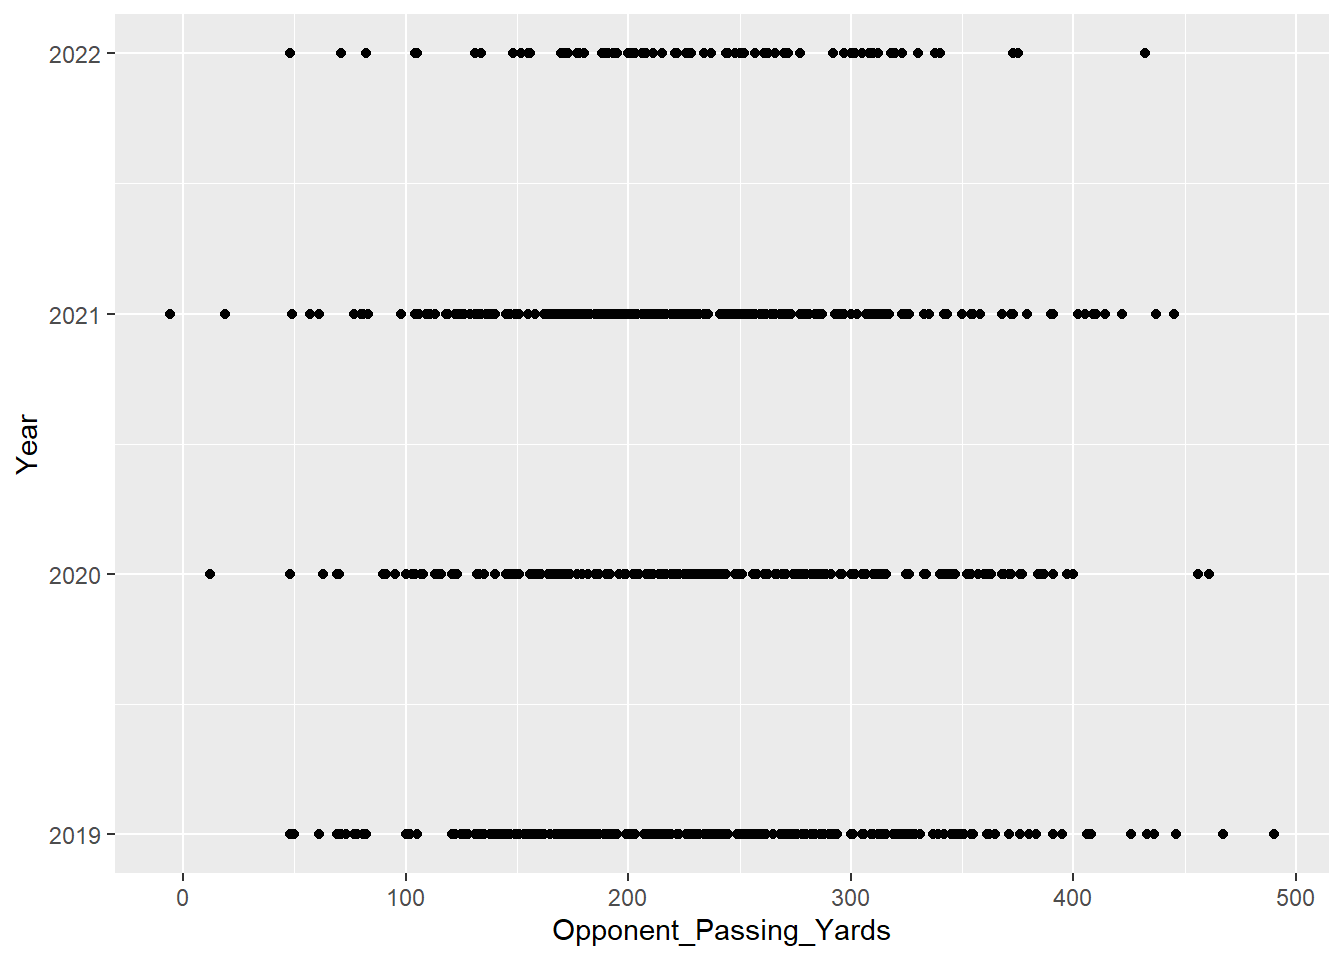
Potential Research Questions: 1. Does the winning team always have the most passing yards in the game? 2. Does the winning team always have the most receiving yards in the game? 3. Does the higher ranking teams always win? 4. If one team has more 1st downs than the other team, do they also win? 5. What do the team’s number of first downs have to with the team’s total yards? Do they correlate? 6. Do the team’s number of turnovers correlate to the winner? To the team’s total number of downs?
#If Condtion I want to do:
If opp == winning team then make new column with value W Else if home == winning team then make new column with value L