# Needed to get multiple functions for operations on datasetlibrary(tidyverse)# Needed to get function paged_tablelibrary(rmarkdown)# Needed to get function read_xlslibrary(readxl)# Needed to get function ggplotlibrary(ggplot2)# Needed to get function str_detectlibrary(stringr)knitr::opts_chunk$set(echo =TRUE, warning=FALSE, message=FALSE)
Read in the Data
Code
# First two rows are Title and third row is blank, hence skipping 3 rows using skip = 3. One column between STATE and COUNTY and another between COUNTY and TOTAL are blank, hence skipping those using col_types.dataFromExcel <-read_xls('_data/StateCounty2012.xls', skip=3, col_types =c("text", "skip", "text", "skip", "numeric"))# Printing the read data as a paged tablepaged_table(dataFromExcel)
The dataset shows the State as well as County wise Railroad Employment for the year 2012. As can be seen from the table, the data has been Grouped StateWise and shows the Total railroad employment of each State as well.
Describe the data
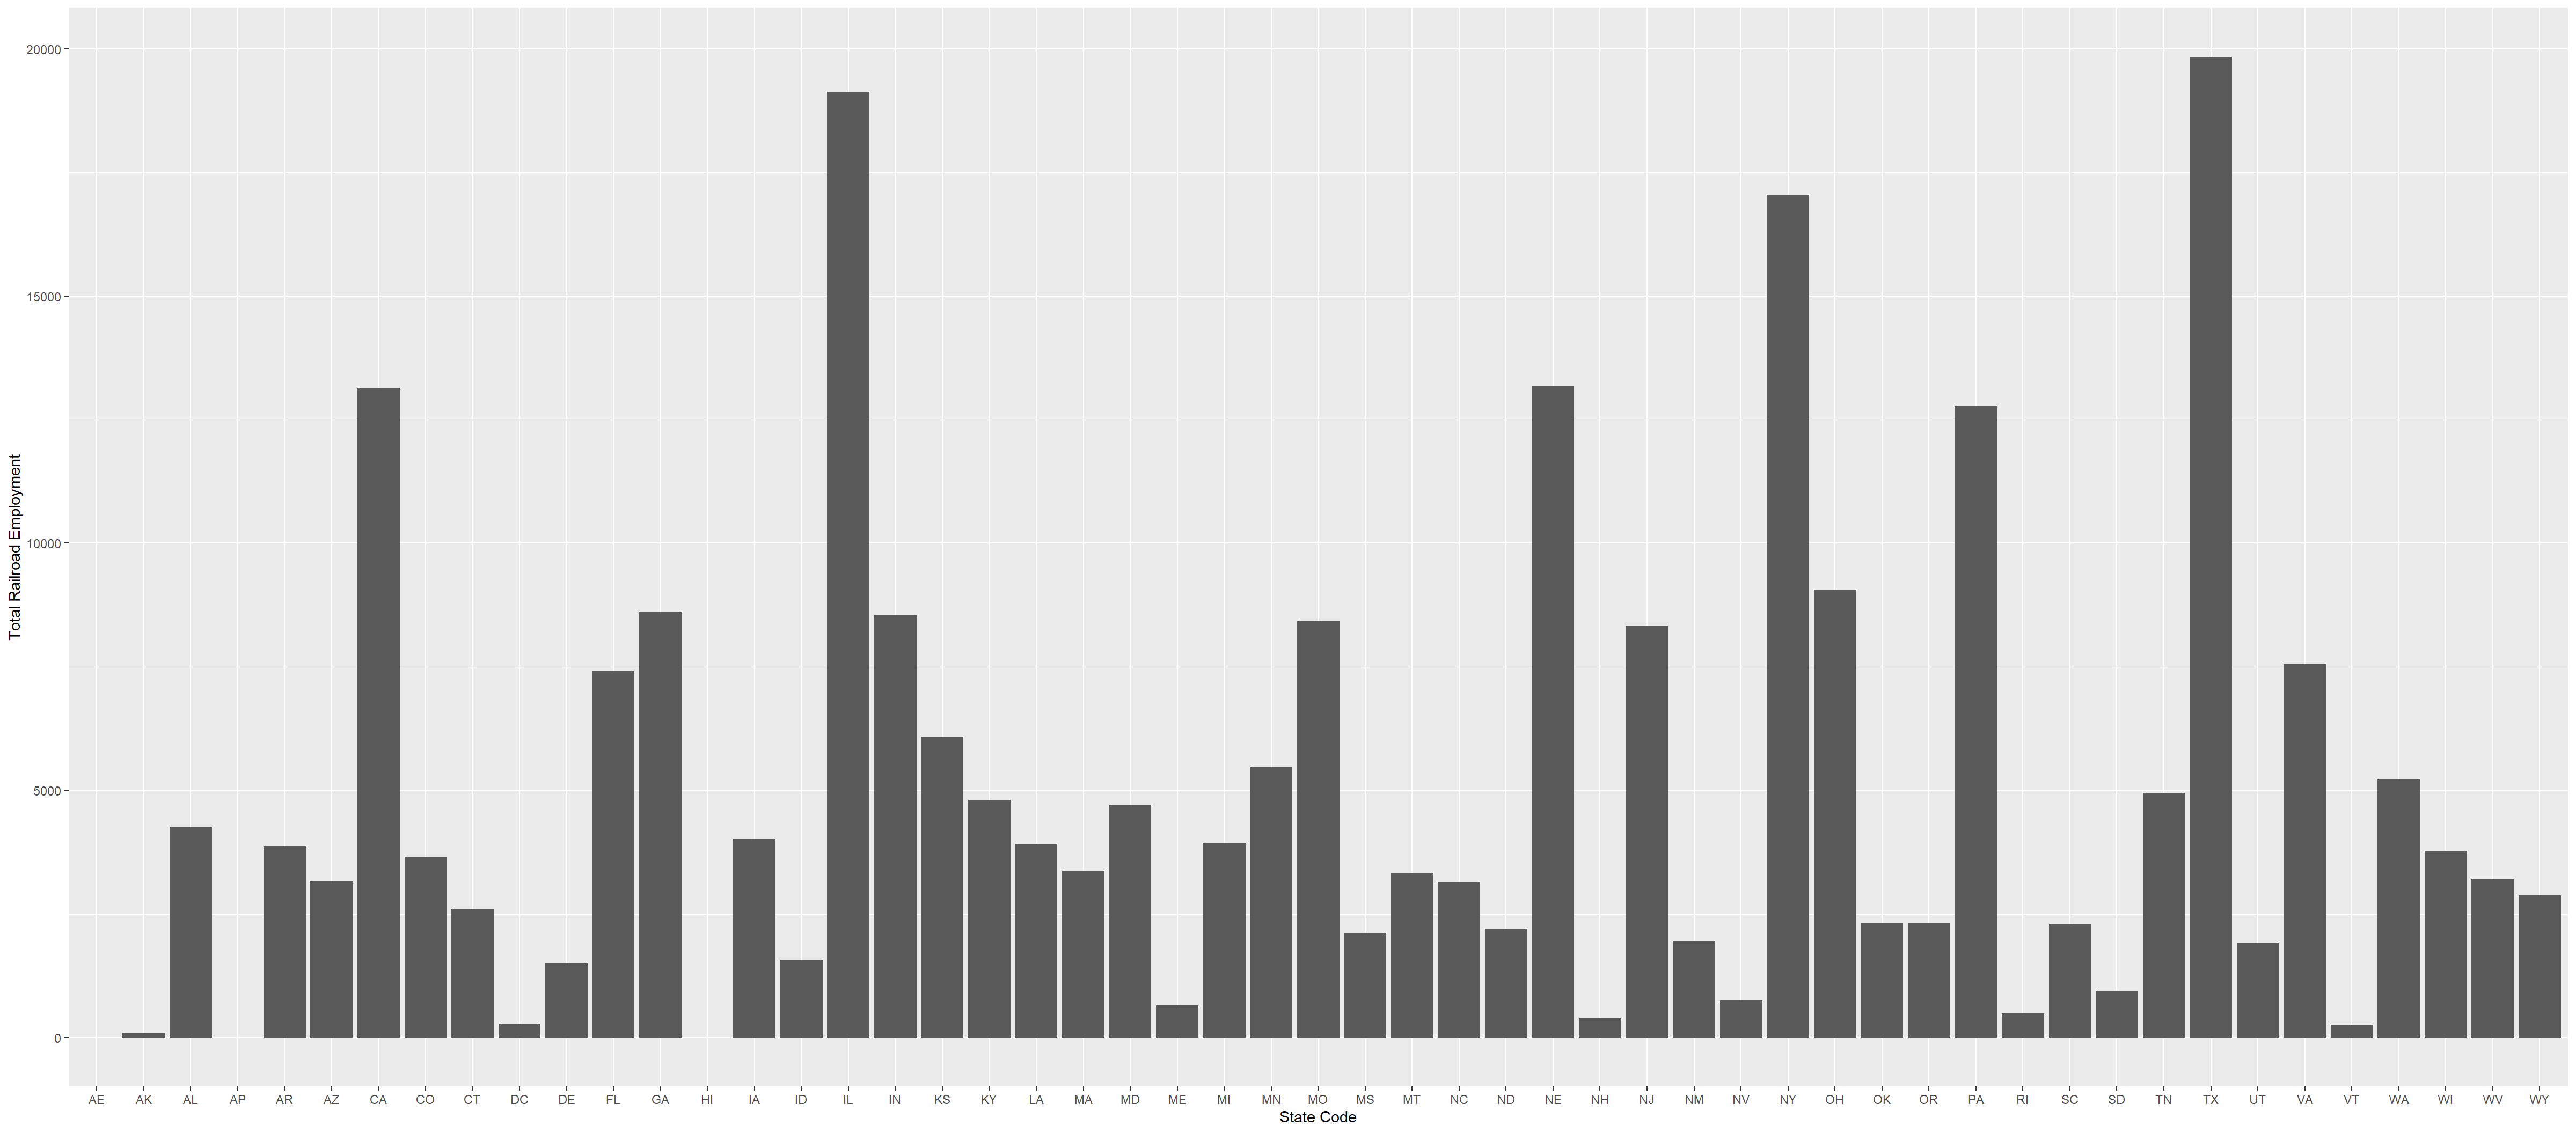
The data shown in the graph is State to the Total Railroad Employment for that State in the year 2012. It has been extracted from the table above. States AE and AP have Military designation. The dataset excludes 2,896 employees without an address.
Code
# Using filter, fetch only the rows that have the word "Total" in STATE column values and ignore the one having "Grand" This helps us to get total employment for each state. Then using mutate, create new column StateCode from the STATE column by taking the word before space using regex.dataFromExcel <- dataFromExcel %>%filter(str_detect(STATE, 'Total') &!str_detect(STATE, 'Grand')) %>%mutate('StateCode'=str_extract(STATE, "[^ ]+"))# Plot the column graph of StateCode to Total Employmentggplot(dataFromExcel, aes(x=StateCode,y=TOTAL)) +geom_col() +labs(x ="State Code", y ="Total Railroad Employment")
Source Code
---title: "Challenge 1"author: "Kavya Harlalka"desription: "Reading in data and creating a post"date: "09/15/2022"format: html: toc: true code-fold: true code-copy: true code-tools: truecategories: - challenge_1 - railroads---```{r Setup}#| warning: false#| message: false# Needed to get multiple functions for operations on datasetlibrary(tidyverse)# Needed to get function paged_tablelibrary(rmarkdown)# Needed to get function read_xlslibrary(readxl)# Needed to get function ggplotlibrary(ggplot2)# Needed to get function str_detectlibrary(stringr)knitr::opts_chunk$set(echo =TRUE, warning=FALSE, message=FALSE)```## Read in the Data```{r ReadData}# First two rows are Title and third row is blank, hence skipping 3 rows using skip = 3. One column between STATE and COUNTY and another between COUNTY and TOTAL are blank, hence skipping those using col_types.dataFromExcel <-read_xls('_data/StateCounty2012.xls', skip=3, col_types =c("text", "skip", "text", "skip", "numeric"))# Printing the read data as a paged tablepaged_table(dataFromExcel)```The dataset shows the State as well as County wise Railroad Employment for the year 2012. As can be seen from the table, the data has been Grouped StateWise and shows the Total railroad employment of each State as well.## Describe the dataThe data shown in the graph is State to the Total Railroad Employment for that State in the year 2012. It has been extracted from the table above. States AE and AP have Military designation. The dataset excludes 2,896 employees without an address. ```{r SummarizeData, fig.width=25, fig.height=11}# Using filter, fetch only the rows that have the word "Total" in STATE column values and ignore the one having "Grand" This helps us to get total employment for each state. Then using mutate, create new column StateCode from the STATE column by taking the word before space using regex.dataFromExcel <- dataFromExcel %>%filter(str_detect(STATE, 'Total') &!str_detect(STATE, 'Grand')) %>%mutate('StateCode'=str_extract(STATE, "[^ ]+"))# Plot the column graph of StateCode to Total Employmentggplot(dataFromExcel, aes(x=StateCode,y=TOTAL)) +geom_col() +labs(x ="State Code", y ="Total Railroad Employment")```