Code
library(tidyverse)

knitr::opts_chunk$set(echo = TRUE, warning=FALSE, message=FALSE)library(tidyverse)
knitr::opts_chunk$set(echo = TRUE, warning=FALSE, message=FALSE)Today’s challenge is to:
Read in one (or more) of the following datasets, using the correct R package and command.
abc_poll<-read.csv("_data/abc_poll_2021.csv")
library(summarytools)
view(dfSummary(abc_poll))
Error in nchar(xx): invalid multibyte string, element 4The dataframe shows responses to the questionnaire. The respondents are adults (age 18-91) from the USA. We can see some demographic data like education, income, age, state, etc (column 4-17). Responses to other questions (probably about views or experience) are in columns 18-28. Column 2 probably identifies language of the respondent. Dataset contains of 527 observations and 30 variables (not including “id”). Some variables are dichotomous, and other variables may have several possible values.
From the first sight data looks tidy. - We have each response in a separate column. - I did not find missing data. - I need to look closer at column 8 “ppethm” and think if it would be proper to make two variables of it or remove information after comma. - Also it might be easier to understand data if columns had different names.
abc_poll<-rename(abc_poll, language = xspanish, age =  ppage, education5 = ppeduc5, education = ppeducat, gender = ppgender, ethnicity = ppethm, household_size = pphhsize, income = ppinc7, marital_status = ppmarit5, region = ppreg4, rent = pprent, state = ppstaten, work = PPWORKA, employment = ppemploy)
abc_poll <- abc_poll%>%
  mutate(ethnicity = str_remove (ethnicity, ", Non-Hispanic"))
Any additional comments?
Some variables should turned into factors. I will try to do it with QPID. This variable need to be reordered so that for example bar chart looked better.
Document your work here.
abc_poll<-abc_poll %>%
  mutate(QPID = fct_recode(QPID, "dem" = "A Democrat",
                                "rep" = "A Republican",
                                "ind" = "An Independent",
                                "na" = "Skipped",
                              "other" = "Something else")) %>%
  mutate(QPID = fct_relevel(QPID, "dem", "ind", "rep","other", "na"))

ggplot(abc_poll, aes(QPID)) + geom_bar()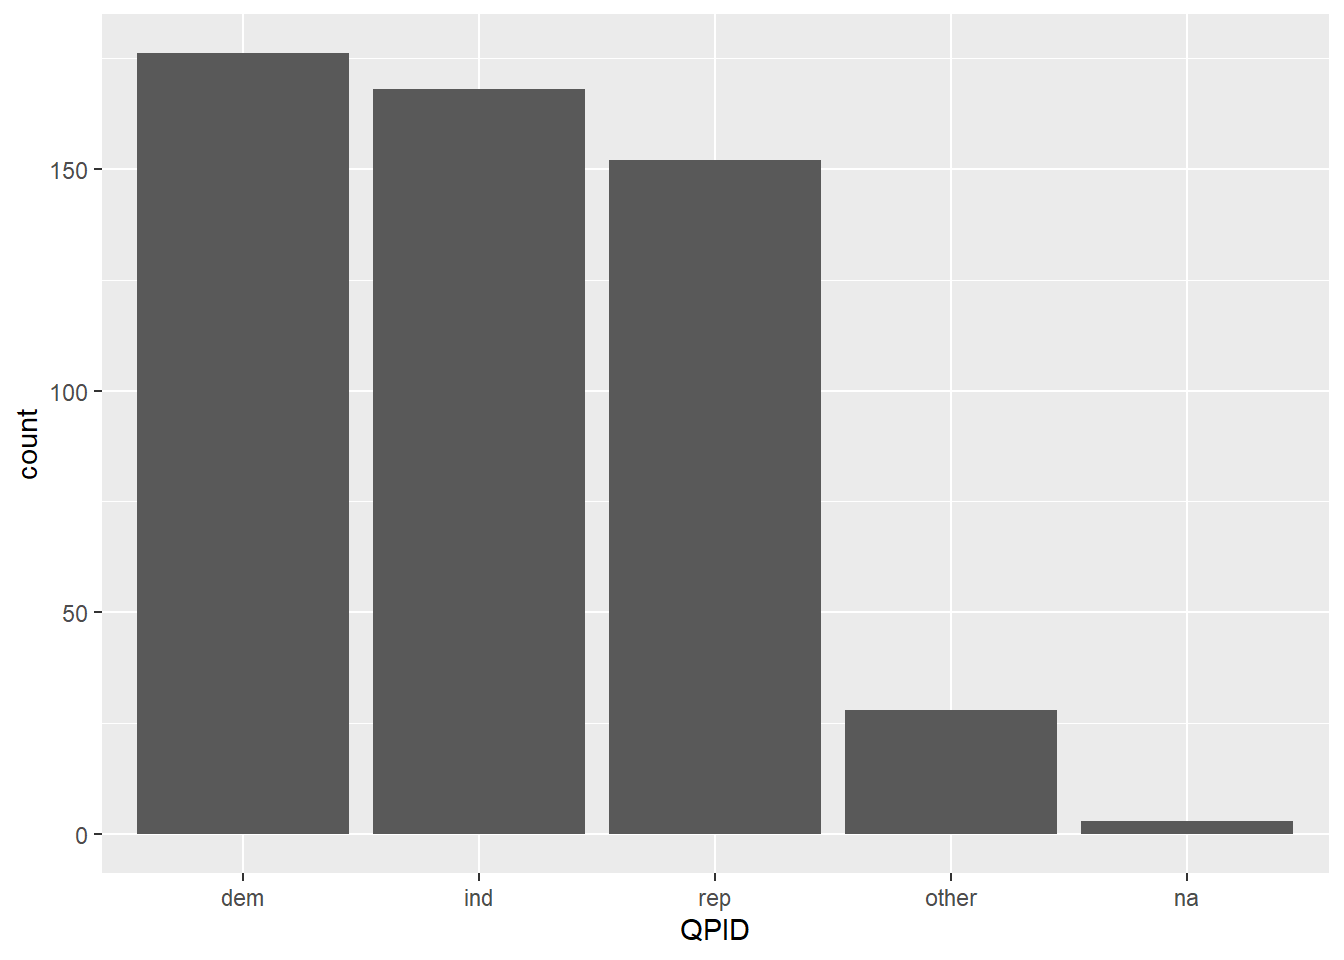
Any additional comments?