library(tidyverse)
library(ggplot2)

knitr::opts_chunk$set(echo = TRUE, warning=FALSE, message=FALSE)
Challenge 8
challenge_8
railroads
snl
faostat
debt
Joining Data
Challenge Overview
Today’s challenge is to:
- read in multiple data sets, and describe the data set using both words and any supporting information (e.g., tables, etc)
- tidy data (as needed, including sanity checks)
- mutate variables as needed (including sanity checks)
- join two or more data sets and analyze some aspect of the joined data
(be sure to only include the category tags for the data you use!)
Read in data
Read in one (or more) of the following datasets, using the correct R package and command.
- military marriages ⭐⭐
- faostat ⭐⭐
- railroads ⭐⭐⭐
- fed_rate ⭐⭐⭐
- debt ⭐⭐⭐
- us_hh ⭐⭐⭐⭐
- snl ⭐⭐⭐⭐⭐
codes <- read.csv("_data/FAOSTAT_country_groups.csv")
cattle <- read.csv("_data/FAOSTAT_cattle_dairy.csv")
Briefly describe the data
Majorly, I’m going to use the FAO Stat Cattle dataset. This data on food and agriculture is available to the general public for more than 245 nations. Information on cow milk, including variables for units sold and product value, is specifically contained in this file. The information spans the years 1960 to 2018. There are more than 36,000 rows of data in this file.
So that we don’t have to examine the data at such a detailed, individual nation level, the second file I will be integrating is a codebook that organizes the countries. To run analysis on these groups within the cattle/dairy dataset, I want to join in the country group variable.
Tidy Data (as needed)
I will use the “Area.code” that each row’s country has been given to join in the country group variable. However, the country file refers to it as “Country Code,” thus I am also renaming the variable to “Country Code” here.
cattlenew <- rename (cattle, "Country Code"= "Area.Code" )
head(cattlenew)
Domain.Code Domain Country Code Area Element.Code
1 QL Livestock Primary 2 Afghanistan 5318
2 QL Livestock Primary 2 Afghanistan 5420
3 QL Livestock Primary 2 Afghanistan 5510
4 QL Livestock Primary 2 Afghanistan 5318
5 QL Livestock Primary 2 Afghanistan 5420
6 QL Livestock Primary 2 Afghanistan 5510
Element Item.Code Item Year.Code Year Unit Value
1 Milk Animals 882 Milk, whole fresh cow 1961 1961 Head 700000
2 Yield 882 Milk, whole fresh cow 1961 1961 hg/An 5000
3 Production 882 Milk, whole fresh cow 1961 1961 tonnes 350000
4 Milk Animals 882 Milk, whole fresh cow 1962 1962 Head 700000
5 Yield 882 Milk, whole fresh cow 1962 1962 hg/An 5000
6 Production 882 Milk, whole fresh cow 1962 1962 tonnes 350000
Flag Flag.Description
1 F FAO estimate
2 Fc Calculated data
3 F FAO estimate
4 F FAO estimate
5 Fc Calculated data
6 F FAO estimatecodesnew <- rename (codes, "Country Code"= "Country.Code" )
head(cattlenew) Domain.Code Domain Country Code Area Element.Code
1 QL Livestock Primary 2 Afghanistan 5318
2 QL Livestock Primary 2 Afghanistan 5420
3 QL Livestock Primary 2 Afghanistan 5510
4 QL Livestock Primary 2 Afghanistan 5318
5 QL Livestock Primary 2 Afghanistan 5420
6 QL Livestock Primary 2 Afghanistan 5510
Element Item.Code Item Year.Code Year Unit Value
1 Milk Animals 882 Milk, whole fresh cow 1961 1961 Head 700000
2 Yield 882 Milk, whole fresh cow 1961 1961 hg/An 5000
3 Production 882 Milk, whole fresh cow 1961 1961 tonnes 350000
4 Milk Animals 882 Milk, whole fresh cow 1962 1962 Head 700000
5 Yield 882 Milk, whole fresh cow 1962 1962 hg/An 5000
6 Production 882 Milk, whole fresh cow 1962 1962 tonnes 350000
Flag Flag.Description
1 F FAO estimate
2 Fc Calculated data
3 F FAO estimate
4 F FAO estimate
5 Fc Calculated data
6 F FAO estimateJoin Data
I’ll join the two tables using left join.
head(codes) Country.Group.Code Country.Group Country.Code Country M49.Code ISO2.Code
1 5100 Africa 4 Algeria 12 DZ
2 5100 Africa 7 Angola 24 AO
3 5100 Africa 53 Benin 204 BJ
4 5100 Africa 20 Botswana 72 BW
5 5100 Africa 233 Burkina Faso 854 BF
6 5100 Africa 29 Burundi 108 BI
ISO3.Code
1 DZA
2 AGO
3 BEN
4 BWA
5 BFA
6 BDIcattlefinal <- left_join(cattlenew, codesnew, by = "Country Code" )
head(cattlefinal) Domain.Code Domain Country Code Area Element.Code
1 QL Livestock Primary 2 Afghanistan 5318
2 QL Livestock Primary 2 Afghanistan 5318
3 QL Livestock Primary 2 Afghanistan 5318
4 QL Livestock Primary 2 Afghanistan 5318
5 QL Livestock Primary 2 Afghanistan 5318
6 QL Livestock Primary 2 Afghanistan 5318
Element Item.Code Item Year.Code Year Unit Value Flag
1 Milk Animals 882 Milk, whole fresh cow 1961 1961 Head 700000 F
2 Milk Animals 882 Milk, whole fresh cow 1961 1961 Head 700000 F
3 Milk Animals 882 Milk, whole fresh cow 1961 1961 Head 700000 F
4 Milk Animals 882 Milk, whole fresh cow 1961 1961 Head 700000 F
5 Milk Animals 882 Milk, whole fresh cow 1961 1961 Head 700000 F
6 Milk Animals 882 Milk, whole fresh cow 1961 1961 Head 700000 F
Flag.Description Country.Group.Code Country.Group
1 FAO estimate 5300 Asia
2 FAO estimate 5306 Central Asia and Southern Asia
3 FAO estimate 5802 Land Locked Developing Countries
4 FAO estimate 5801 Least Developed Countries
5 FAO estimate 5858 Low income economies
6 FAO estimate 5815 Low Income Food Deficit Countries
Country M49.Code ISO2.Code ISO3.Code
1 Afghanistan 4 AF AFG
2 Afghanistan 4 AF AFG
3 Afghanistan 4 AF AFG
4 Afghanistan 4 AF AFG
5 Afghanistan 4 AF AFG
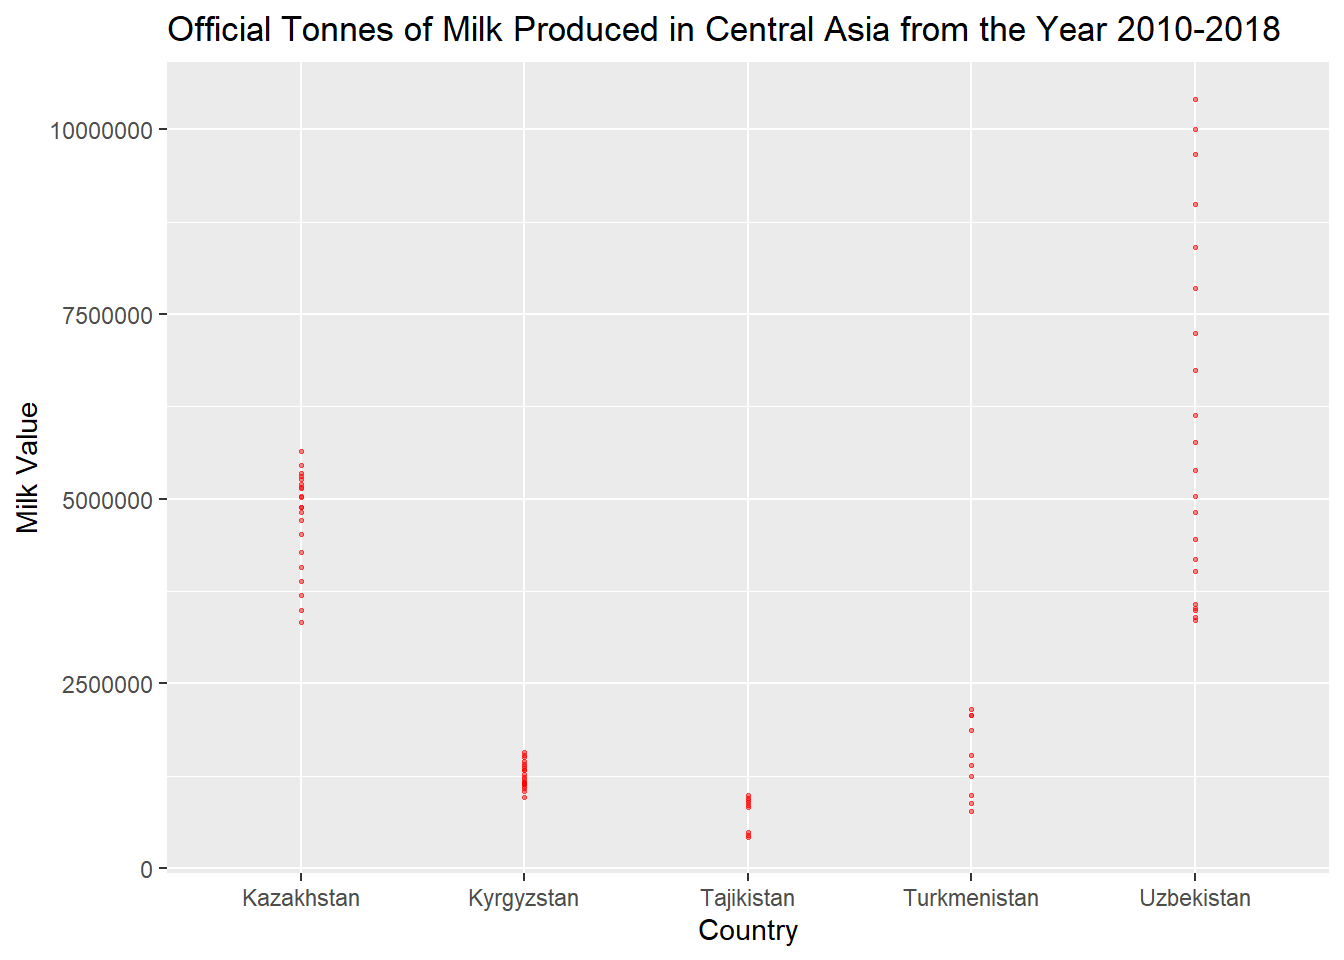
6 Afghanistan 4 AF AFGcattlefinal %>%
filter(Year >= 1998) %>%
filter(`Flag.Description` == "Official data") %>%
filter(`Country.Group`=="Central Asia") %>%
filter(`Unit` == "tonnes") %>%
ggplot(aes(x=`Area`, y=`Value`)) +
geom_point(
color="red",
fill="#69b3a2",
size=.5,
alpha=.5
)+
labs(title = "Official Tonnes of Milk Produced in Central Asia from the Year 2010-2018", x="Country", y="Milk Value") +
scale_y_continuous(labels = function(x) format(x, scientific = FALSE))