Code
# Import important libraries needed for functions
library(tidyverse)
library(rmarkdown)
library(summarytools)
library(dplyr)

knitr::opts_chunk$set(echo = TRUE, warning=FALSE, message=FALSE)# Import important libraries needed for functions
library(tidyverse)
library(rmarkdown)
library(summarytools)
library(dplyr)
knitr::opts_chunk$set(echo = TRUE, warning=FALSE, message=FALSE)# Read data from the file
load("_data/starwars1.RData")
# Printing the read data as a paged table
paged_table(starwars.1)This dataset represents characters in the fictional world of Star Wars. It gives details like their names, species, origin, etc. It also gives the height and mass of each character and the number of films they appeared in.
I chose the species column to group the data to provide certain analysis. The first analysis we do is look at the average height, the average mass and average no of films of each species as shown below :-
# Group dataset by species, ignoring values that have species as NA
dataGroupedBySpecies <- starwars.1 %>%
  group_by(species) %>%
  filter(!is.na(species))

# Analyze the grouped data by finding the average height mass and noOfFilms per species.
dataSummary <- dataGroupedBySpecies %>%
  summarise(
    avg_height = mean(height.in, na.rm = TRUE),
    avg_mass = mean(mass.lbs, na.rm = TRUE),
    avg_number_of_films = mean(n.films, na.rm = TRUE)
  ) %>%
  arrange(species)
paged_table(dataSummary)
This gives us an insight of how which species have highest appearances in the films as well as how the height and mass varies by the species.
We can further look at the heights of different characters of certain species to get an insight on how it varies with species using the below graph :-
# Use group data to get species with more than 2 rows and plot a graph that shows relation between species and their height
dataGroupedBySpecies %>%
  filter(n() >= 2) %>%
  ggplot(aes(x=species,
     y=height.in)) +
     geom_point() +
     theme_minimal() +
     xlab("Species") +
     ylab("Height")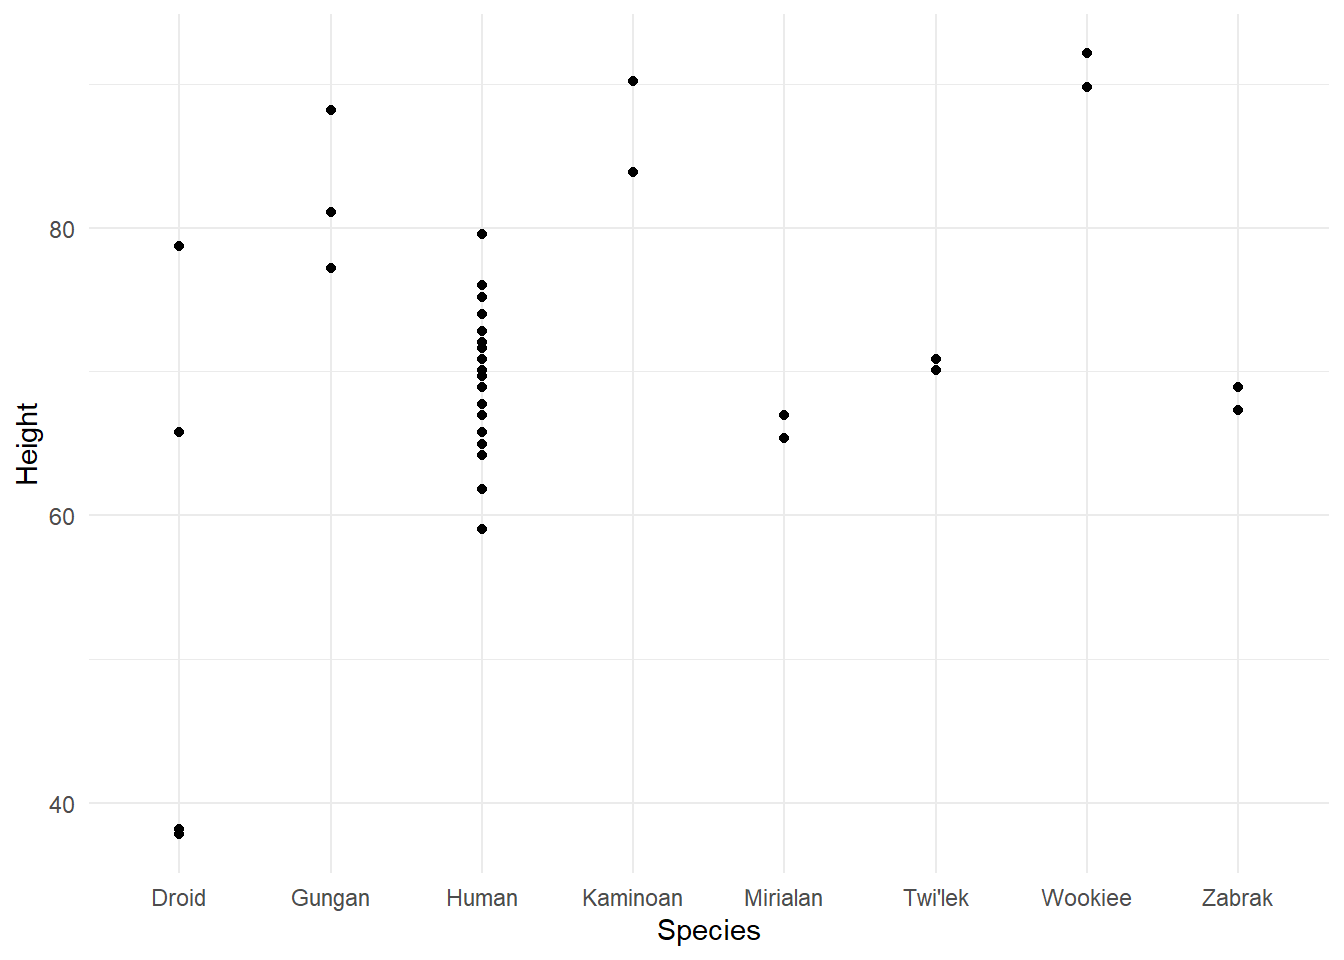
We take only the species for which we have atleast 2 character data. As can be seen, Droids are usually smaller while Wookies are usually much bigger.
We can analyze the origin of each species as well which species has more character origins in Original films as compared to prequels or sequels. This can be seen in the table below :-
# Percentage of species origin
prop.table(table(select(dataGroupedBySpecies, character.origin))) %>%
  `*`(100) %>%
  round(2)
character.origin
species Original Trilogy Prequels Sequels
Aleena 0.00 1.20 0.00
Besalisk 0.00 1.20 0.00
Cerean 0.00 1.20 0.00
Chagrian 0.00 1.20 0.00
Clawdite 0.00 1.20 0.00
Droid 4.82 1.20 1.20
Dug 0.00 1.20 0.00
Ewok 1.20 0.00 0.00
Geonosian 0.00 1.20 0.00
Gungan 0.00 3.61 0.00
Human 21.69 16.87 3.61
Hutt 1.20 0.00 0.00
Iktotchi 0.00 1.20 0.00
Kaleesh 0.00 1.20 0.00
Kaminoan 0.00 2.41 0.00
Kel Dor 0.00 1.20 0.00
Mirialan 0.00 2.41 0.00
Mon Calamari 1.20 0.00 0.00
Muun 0.00 1.20 0.00
Nautolan 0.00 1.20 0.00
Neimodian 0.00 1.20 0.00
Pau'an 0.00 1.20 0.00
Quermian 0.00 1.20 0.00
Rodian 1.20 0.00 0.00
Skakoan 0.00 1.20 0.00
Sullustan 1.20 0.00 0.00
Tholothian 0.00 1.20 0.00
Togruta 0.00 1.20 0.00
Toong 0.00 1.20 0.00
Toydarian 0.00 1.20 0.00
Trandoshan 1.20 0.00 0.00
Twi'lek 1.20 1.20 0.00
Vulptereen 0.00 1.20 0.00
Wookiee 1.20 1.20 0.00
Xexto 0.00 1.20 0.00
Yoda's species 1.20 0.00 0.00
Zabrak 0.00 2.41 0.00Though this is not scientific data (since the data is fictional) but just to give an example of possible research queries that can be answered, we could find the correlation between the height and weight in the star wars universe from the complete data set.
# Find correlation between height and weight of characters in the star wars universe
cor.test(starwars.1$height.in, starwars.1$mass.lbs, method=c("pearson", "kendall", "spearman"), use = "complete.obs")
    Pearson's product-moment correlation

data:  starwars.1$height.in and starwars.1$mass.lbs
t = 1.02, df = 57, p-value = 0.312
alternative hypothesis: true correlation is not equal to 0
95 percent confidence interval:
 -0.1265364  0.3770395
sample estimates:
      cor
0.1338842
The data seen above is explained using the following terms
The p-value of the test is 0.312, which is not less than the significance level alpha = 0.05. We can conclude that height and weight are not significantly correlated in the Star wars universe.