library(tidyverse)
library(ggplot2)

knitr::opts_chunk$set(echo = TRUE, warning=FALSE, message=FALSE)
Challenge 6
challenge_6
hotel_bookings
Visualizing Time and Relationships
Challenge Overview
Today’s challenge is to:
- read in a data set, and describe the data set using both words and any supporting information (e.g., tables, etc)
- tidy data (as needed, including sanity checks)
- mutate variables as needed (including sanity checks)
- create at least one graph including time (evolution)
- try to make them “publication” ready (optional)
- Explain why you choose the specific graph type
- Create at least one graph depicting part-whole or flow relationships
- try to make them “publication” ready (optional)
- Explain why you choose the specific graph type
R Graph Gallery is a good starting point for thinking about what information is conveyed in standard graph types, and includes example R code.
(be sure to only include the category tags for the data you use!)
Read in data
Read in one (or more) of the following datasets, using the correct R package and command.
- debt ⭐
- fed_rate ⭐⭐
- abc_poll ⭐⭐⭐
- usa_hh ⭐⭐⭐
- hotel_bookings ⭐⭐⭐⭐
- AB_NYC ⭐⭐⭐⭐⭐
bookings <- read.csv("_data/hotel_bookings.csv")
bookings %>%  head()
hotel is_canceled lead_time arrival_date_year arrival_date_month
1 Resort Hotel 0 342 2015 July
2 Resort Hotel 0 737 2015 July
3 Resort Hotel 0 7 2015 July
4 Resort Hotel 0 13 2015 July
5 Resort Hotel 0 14 2015 July
6 Resort Hotel 0 14 2015 July
arrival_date_week_number arrival_date_day_of_month stays_in_weekend_nights
1 27 1 0
2 27 1 0
3 27 1 0
4 27 1 0
5 27 1 0
6 27 1 0
stays_in_week_nights adults children babies meal country market_segment
1 0 2 0 0 BB PRT Direct
2 0 2 0 0 BB PRT Direct
3 1 1 0 0 BB GBR Direct
4 1 1 0 0 BB GBR Corporate
5 2 2 0 0 BB GBR Online TA
6 2 2 0 0 BB GBR Online TA
distribution_channel is_repeated_guest previous_cancellations
1 Direct 0 0
2 Direct 0 0
3 Direct 0 0
4 Corporate 0 0
5 TA/TO 0 0
6 TA/TO 0 0
previous_bookings_not_canceled reserved_room_type assigned_room_type
1 0 C C
2 0 C C
3 0 A C
4 0 A A
5 0 A A
6 0 A A
booking_changes deposit_type agent company days_in_waiting_list customer_type
1 3 No Deposit NULL NULL 0 Transient
2 4 No Deposit NULL NULL 0 Transient
3 0 No Deposit NULL NULL 0 Transient
4 0 No Deposit 304 NULL 0 Transient
5 0 No Deposit 240 NULL 0 Transient
6 0 No Deposit 240 NULL 0 Transient
adr required_car_parking_spaces total_of_special_requests reservation_status
1 0 0 0 Check-Out
2 0 0 0 Check-Out
3 75 0 0 Check-Out
4 75 0 0 Check-Out
5 98 0 1 Check-Out
6 98 0 1 Check-Out
reservation_status_date
1 2015-07-01
2 2015-07-01
3 2015-07-02
4 2015-07-02
5 2015-07-03
6 2015-07-03Briefly describe the data
bookings %>% colnames() [1] "hotel" "is_canceled"
[3] "lead_time" "arrival_date_year"
[5] "arrival_date_month" "arrival_date_week_number"
[7] "arrival_date_day_of_month" "stays_in_weekend_nights"
[9] "stays_in_week_nights" "adults"
[11] "children" "babies"
[13] "meal" "country"
[15] "market_segment" "distribution_channel"
[17] "is_repeated_guest" "previous_cancellations"
[19] "previous_bookings_not_canceled" "reserved_room_type"
[21] "assigned_room_type" "booking_changes"
[23] "deposit_type" "agent"
[25] "company" "days_in_waiting_list"
[27] "customer_type" "adr"
[29] "required_car_parking_spaces" "total_of_special_requests"
[31] "reservation_status" "reservation_status_date" This data represents the hotel bookings and their prices in NYC. There are a total of 32 columns
bookings$country %>% unique() %>% length()[1] 178bookings$reservation_status %>% unique() [1] "Check-Out" "Canceled" "No-Show" bookings$hotel %>% unique()[1] "Resort Hotel" "City Hotel" str(bookings)'data.frame': 119390 obs. of 32 variables:
$ hotel : chr "Resort Hotel" "Resort Hotel" "Resort Hotel" "Resort Hotel" ...
$ is_canceled : int 0 0 0 0 0 0 0 0 1 1 ...
$ lead_time : int 342 737 7 13 14 14 0 9 85 75 ...
$ arrival_date_year : int 2015 2015 2015 2015 2015 2015 2015 2015 2015 2015 ...
$ arrival_date_month : chr "July" "July" "July" "July" ...
$ arrival_date_week_number : int 27 27 27 27 27 27 27 27 27 27 ...
$ arrival_date_day_of_month : int 1 1 1 1 1 1 1 1 1 1 ...
$ stays_in_weekend_nights : int 0 0 0 0 0 0 0 0 0 0 ...
$ stays_in_week_nights : int 0 0 1 1 2 2 2 2 3 3 ...
$ adults : int 2 2 1 1 2 2 2 2 2 2 ...
$ children : int 0 0 0 0 0 0 0 0 0 0 ...
$ babies : int 0 0 0 0 0 0 0 0 0 0 ...
$ meal : chr "BB" "BB" "BB" "BB" ...
$ country : chr "PRT" "PRT" "GBR" "GBR" ...
$ market_segment : chr "Direct" "Direct" "Direct" "Corporate" ...
$ distribution_channel : chr "Direct" "Direct" "Direct" "Corporate" ...
$ is_repeated_guest : int 0 0 0 0 0 0 0 0 0 0 ...
$ previous_cancellations : int 0 0 0 0 0 0 0 0 0 0 ...
$ previous_bookings_not_canceled: int 0 0 0 0 0 0 0 0 0 0 ...
$ reserved_room_type : chr "C" "C" "A" "A" ...
$ assigned_room_type : chr "C" "C" "C" "A" ...
$ booking_changes : int 3 4 0 0 0 0 0 0 0 0 ...
$ deposit_type : chr "No Deposit" "No Deposit" "No Deposit" "No Deposit" ...
$ agent : chr "NULL" "NULL" "NULL" "304" ...
$ company : chr "NULL" "NULL" "NULL" "NULL" ...
$ days_in_waiting_list : int 0 0 0 0 0 0 0 0 0 0 ...
$ customer_type : chr "Transient" "Transient" "Transient" "Transient" ...
$ adr : num 0 0 75 75 98 ...
$ required_car_parking_spaces : int 0 0 0 0 0 0 0 0 0 0 ...
$ total_of_special_requests : int 0 0 0 0 1 1 0 1 1 0 ...
$ reservation_status : chr "Check-Out" "Check-Out" "Check-Out" "Check-Out" ...
$ reservation_status_date : chr "2015-07-01" "2015-07-01" "2015-07-02" "2015-07-02" ...The hotel reservations span across 178 countries. The reservation statuses has three possible values i.e. check-out, cancelled, No-Show
The entire data is only about two hotels - Resort Hotel and City Hotel.
Tidy Data (as needed)
Is your data already tidy, or is there work to be done? Be sure to anticipate your end result to provide a sanity check, and document your work here.
Are there any variables that require mutation to be usable in your analysis stream? For example, do you need to calculate new values in order to graph them? Can string values be represented numerically? Do you need to turn any variables into factors and reorder for ease of graphics and visualization?
Yes, I would like to plot the Reservations trend at every month. For this we need to have a new column ‘arrival-year-month’.
bookings <- bookings %>%
  mutate(date_year = paste0(arrival_date_month," ",arrival_date_day_of_month," ",arrival_date_year))
bookings$date_year %>% head()
[1] "July 1 2015" "July 1 2015" "July 1 2015" "July 1 2015" "July 1 2015"
[6] "July 1 2015"Time Dependent Visualization
resort_hotel_resrvations <- bookings %>%
  filter(reservation_status=="Check-Out",hotel=="Resort Hotel") %>% select(date_year)
resort_hotel_resrvations <- resort_hotel_resrvations %>% mutate(reservation_count=1)
resort_hotel_resrvations <- resort_hotel_resrvations %>% group_by(date_year) %>% summarise_all(sum)
resort_hotel_resrvations <- resort_hotel_resrvations %>% mutate(full_date=as.Date(resort_hotel_resrvations$date_year,format="%B %d %Y"))

p<-resort_hotel_resrvations %>% ggplot(aes(x=full_date,y=reservation_count)) + geom_line() + xlab("Date") + ylab("Count of reservations")+labs(title="Number of reservactions trend for Resort Hotel")
p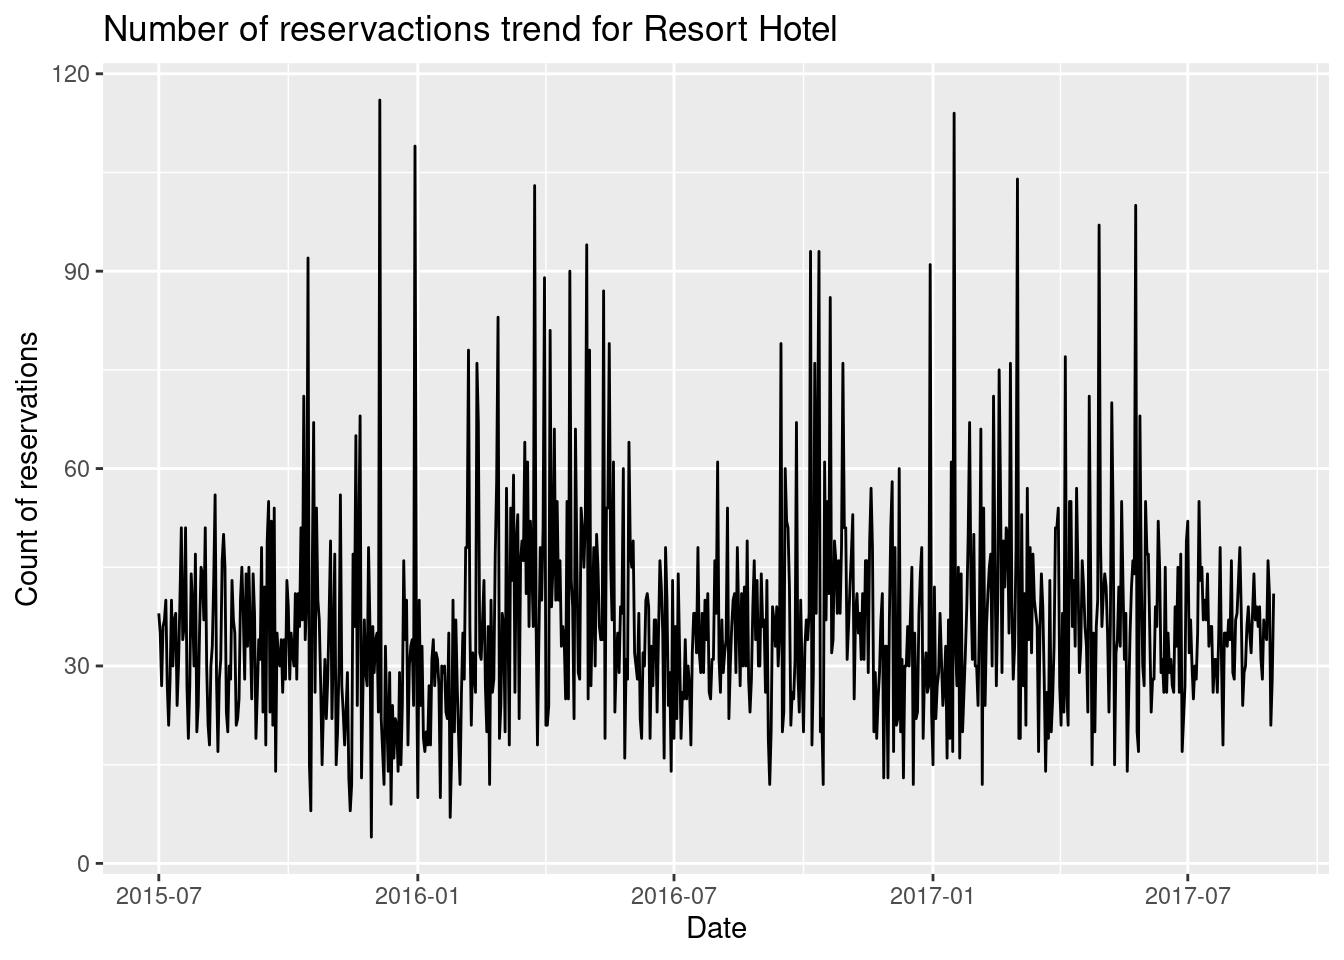
Visualizing Part-Whole Relationships
I would like to analyze the relationships between month of the year and the mean days in waiting list.
grouped <- bookings %>%
  select(arrival_date_month,days_in_waiting_list) %>%
  group_by(arrival_date_month) %>%
  summarise_all(max) %>%
  mutate(month=as.Date(paste(arrival_date_month,"-01-2021",sep=""),"%B-%d-%Y"))
grouped %>% ggplot(aes(month,days_in_waiting_list))+geom_line() +scale_x_date(date_labels = "%B",date_breaks = "1 month")+ labs(title="max days in waiting list per month")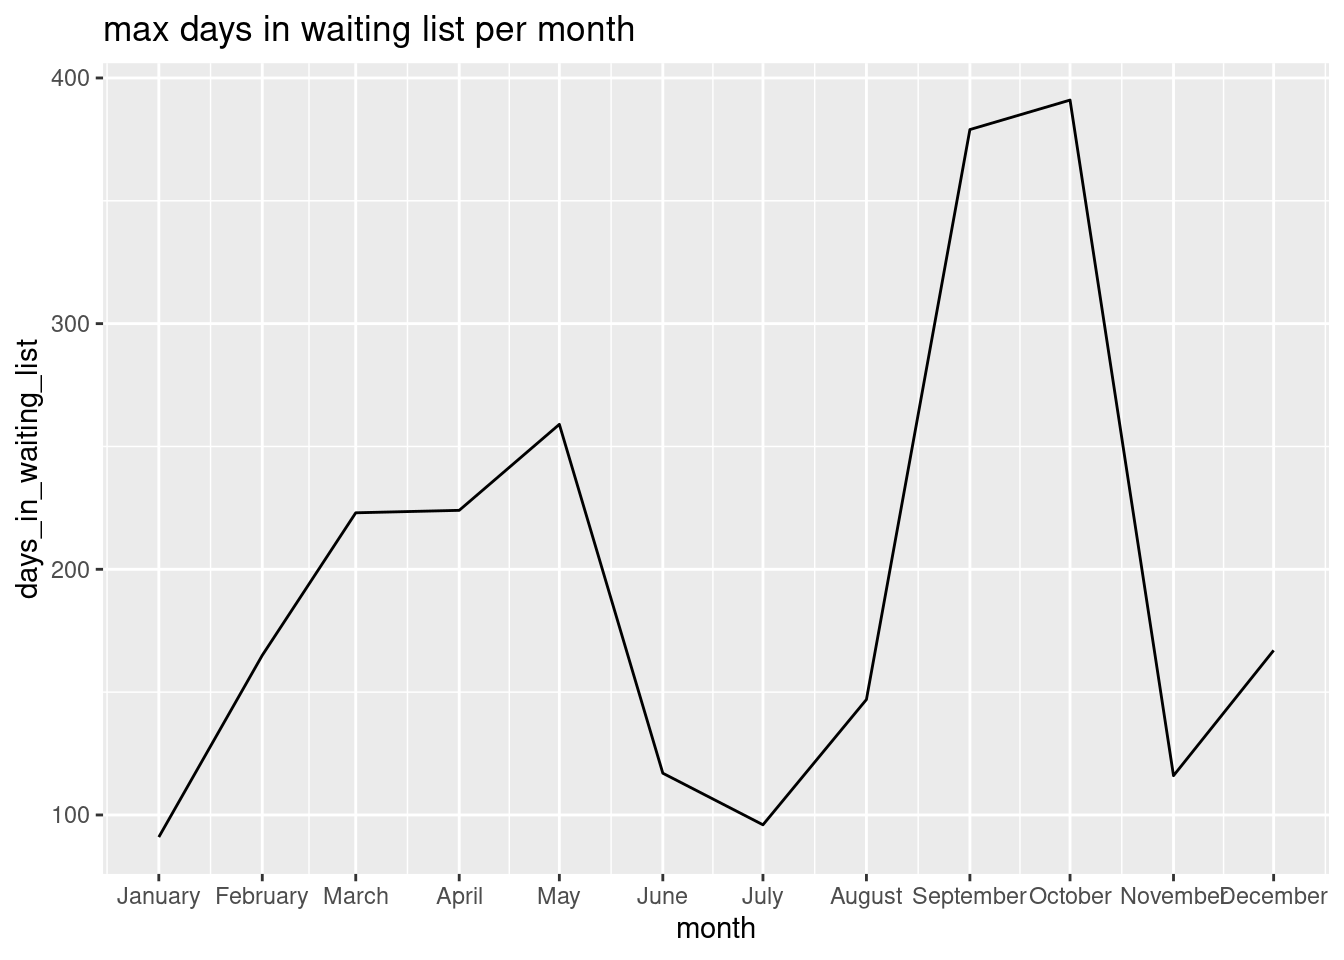
It can be seen that there are two peaks in waiting period one in siummer and one in Fall when many people travel.