library(tidyverse)
library(ggplot2)

knitr::opts_chunk$set(echo = TRUE, warning=FALSE, message=FALSE)Challenge 6
challenge_6
hotel_bookings
Anirudh Lakkaraju
Visualizing Time and Relationships
Read in data
df <- read.csv("_data/hotel_bookings.csv")head(df) hotel is_canceled lead_time arrival_date_year arrival_date_month
1 Resort Hotel 0 342 2015 July
2 Resort Hotel 0 737 2015 July
3 Resort Hotel 0 7 2015 July
4 Resort Hotel 0 13 2015 July
5 Resort Hotel 0 14 2015 July
6 Resort Hotel 0 14 2015 July
arrival_date_week_number arrival_date_day_of_month stays_in_weekend_nights
1 27 1 0
2 27 1 0
3 27 1 0
4 27 1 0
5 27 1 0
6 27 1 0
stays_in_week_nights adults children babies meal country market_segment
1 0 2 0 0 BB PRT Direct
2 0 2 0 0 BB PRT Direct
3 1 1 0 0 BB GBR Direct
4 1 1 0 0 BB GBR Corporate
5 2 2 0 0 BB GBR Online TA
6 2 2 0 0 BB GBR Online TA
distribution_channel is_repeated_guest previous_cancellations
1 Direct 0 0
2 Direct 0 0
3 Direct 0 0
4 Corporate 0 0
5 TA/TO 0 0
6 TA/TO 0 0
previous_bookings_not_canceled reserved_room_type assigned_room_type
1 0 C C
2 0 C C
3 0 A C
4 0 A A
5 0 A A
6 0 A A
booking_changes deposit_type agent company days_in_waiting_list customer_type
1 3 No Deposit NULL NULL 0 Transient
2 4 No Deposit NULL NULL 0 Transient
3 0 No Deposit NULL NULL 0 Transient
4 0 No Deposit 304 NULL 0 Transient
5 0 No Deposit 240 NULL 0 Transient
6 0 No Deposit 240 NULL 0 Transient
adr required_car_parking_spaces total_of_special_requests reservation_status
1 0 0 0 Check-Out
2 0 0 0 Check-Out
3 75 0 0 Check-Out
4 75 0 0 Check-Out
5 98 0 1 Check-Out
6 98 0 1 Check-Out
reservation_status_date
1 2015-07-01
2 2015-07-01
3 2015-07-02
4 2015-07-02
5 2015-07-03
6 2015-07-03Briefly describe the data
dim(df)[1] 119390 32colnames(df) [1] "hotel" "is_canceled"
[3] "lead_time" "arrival_date_year"
[5] "arrival_date_month" "arrival_date_week_number"
[7] "arrival_date_day_of_month" "stays_in_weekend_nights"
[9] "stays_in_week_nights" "adults"
[11] "children" "babies"
[13] "meal" "country"
[15] "market_segment" "distribution_channel"
[17] "is_repeated_guest" "previous_cancellations"
[19] "previous_bookings_not_canceled" "reserved_room_type"
[21] "assigned_room_type" "booking_changes"
[23] "deposit_type" "agent"
[25] "company" "days_in_waiting_list"
[27] "customer_type" "adr"
[29] "required_car_parking_spaces" "total_of_special_requests"
[31] "reservation_status" "reservation_status_date" Tidy Data (as needed)
I would like to create a plot that displays the trend of reservations for each month. To achieve this, we must first create a new column in the dataset called “arrival-year-month”.
df <- df %>%
  mutate(date_year = paste0(arrival_date_month," ",arrival_date_day_of_month," ",arrival_date_year))
df$date_year %>% head()
[1] "July 1 2015" "July 1 2015" "July 1 2015" "July 1 2015" "July 1 2015"
[6] "July 1 2015"Time Dependent Visualization
df %>%
  filter(arrival_date_year == 2015) %>%
  group_by(arrival_date_month, hotel) %>%
  summarise(total_bookings = n()) %>%
  ggplot(aes(x = arrival_date_month, y = total_bookings, fill = hotel)) +
  geom_bar(stat = "identity", position = "dodge") +
  labs(x = "Month", y = "Total Bookings", title = "Monthly bookings by hotel") +
  scale_fill_manual(values = c("#4e79a7", "#f28e2c"),
                    name = "Hotel",
                    labels = c("City Hotel", "Resort Hotel"))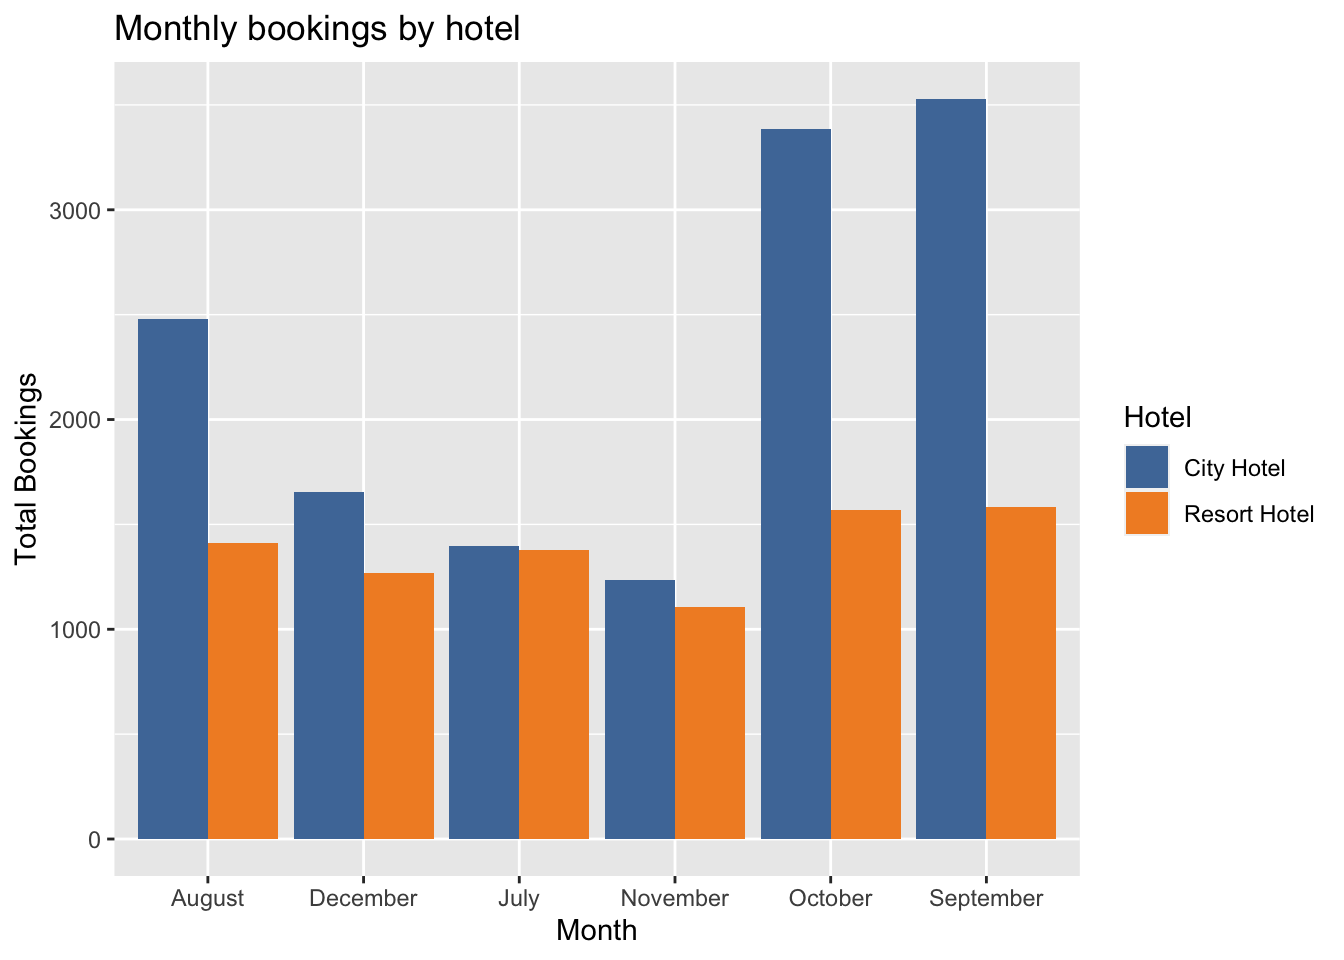
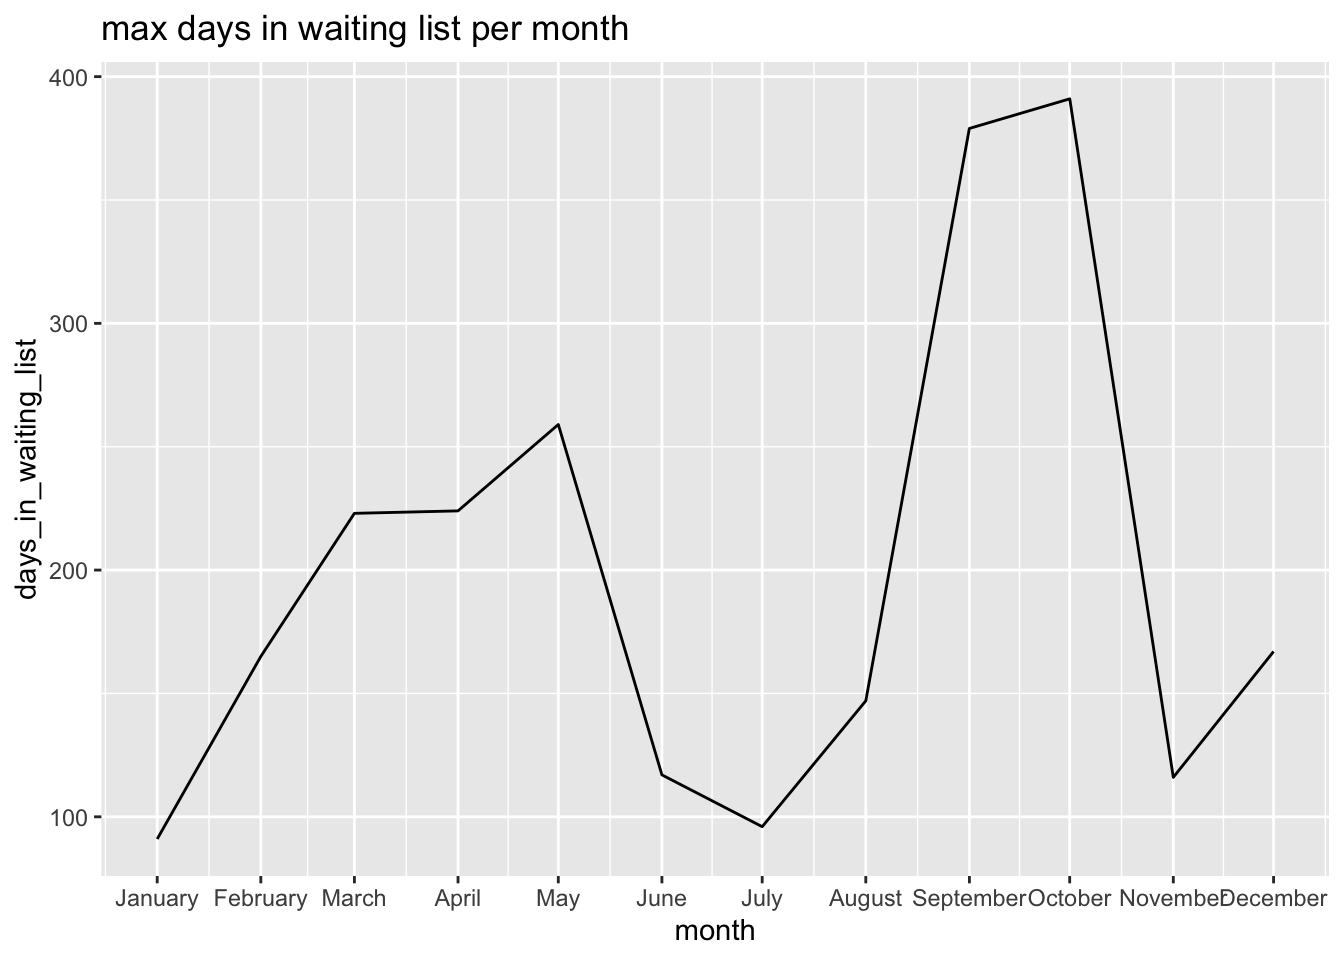
Visualizing Part-Whole Relationships
grouped <- df %>%
  select(arrival_date_month,days_in_waiting_list) %>%
  group_by(arrival_date_month) %>%
  summarise_all(max) %>%
  mutate(month=as.Date(paste(arrival_date_month,"-01-2021",sep=""),"%B-%d-%Y"))
grouped %>% ggplot(aes(month,days_in_waiting_list))+geom_line() +scale_x_date(date_labels = "%B",date_breaks = "1 month")+ labs(title="max days in waiting list per month")