library(tidyverse)
library(ggplot2)
library(readxl)
library(summarytools)
library(lubridate)
library(here)

knitr::opts_chunk$set(echo = TRUE, warning=FALSE, message=FALSE)Challenge 6 Submission
challenge_6
CamNeedels
debt
Visualizing Time and Relationships
FedFunds <- read_csv("B:/Needels/Documents/DACCS 601/DACSS_601_New/posts/_data/FedFundsRate.csv")
FedFunds
# A tibble: 904 × 10
Year Month Day Federal F…¹ Feder…² Feder…³ Effec…⁴ Real …⁵ Unemp…⁶ Infla…⁷
<dbl> <dbl> <dbl> <dbl> <dbl> <dbl> <dbl> <dbl> <dbl> <dbl>
1 1954 7 1 NA NA NA 0.8 4.6 5.8 NA
2 1954 8 1 NA NA NA 1.22 NA 6 NA
3 1954 9 1 NA NA NA 1.06 NA 6.1 NA
4 1954 10 1 NA NA NA 0.85 8 5.7 NA
5 1954 11 1 NA NA NA 0.83 NA 5.3 NA
6 1954 12 1 NA NA NA 1.28 NA 5 NA
7 1955 1 1 NA NA NA 1.39 11.9 4.9 NA
8 1955 2 1 NA NA NA 1.29 NA 4.7 NA
9 1955 3 1 NA NA NA 1.35 NA 4.6 NA
10 1955 4 1 NA NA NA 1.43 6.7 4.7 NA
# … with 894 more rows, and abbreviated variable names
# ¹`Federal Funds Target Rate`, ²`Federal Funds Upper Target`,
# ³`Federal Funds Lower Target`, ⁴`Effective Federal Funds Rate`,
# ⁵`Real GDP (Percent Change)`, ⁶`Unemployment Rate`, ⁷`Inflation Rate`Briefly describe the data
This data spans from 1954 to 2017 and it includes variables that deal with federal funds rate or the amount of interest banks loan money to one another. 8 variables total in this data set.
FedFundsTidy <- FedFunds %>%
  pivot_longer( cols= "Federal Funds Target Rate":"Inflation Rate",
                names_to = 'Economic Status',
                values_to = "Rates")
FedFundsTidy
# A tibble: 6,328 × 5
Year Month Day `Economic Status` Rates
<dbl> <dbl> <dbl> <chr> <dbl>
1 1954 7 1 Federal Funds Target Rate NA
2 1954 7 1 Federal Funds Upper Target NA
3 1954 7 1 Federal Funds Lower Target NA
4 1954 7 1 Effective Federal Funds Rate 0.8
5 1954 7 1 Real GDP (Percent Change) 4.6
6 1954 7 1 Unemployment Rate 5.8
7 1954 7 1 Inflation Rate NA
8 1954 8 1 Federal Funds Target Rate NA
9 1954 8 1 Federal Funds Upper Target NA
10 1954 8 1 Federal Funds Lower Target NA
# … with 6,318 more rowsFedFundsDate <- FedFundsTidy%>%
mutate( date = str_c(Month, Day, Year , sep = "-"),
date = mdy(date))
FedFundsDate# A tibble: 6,328 × 6
Year Month Day `Economic Status` Rates date
<dbl> <dbl> <dbl> <chr> <dbl> <date>
1 1954 7 1 Federal Funds Target Rate NA 1954-07-01
2 1954 7 1 Federal Funds Upper Target NA 1954-07-01
3 1954 7 1 Federal Funds Lower Target NA 1954-07-01
4 1954 7 1 Effective Federal Funds Rate 0.8 1954-07-01
5 1954 7 1 Real GDP (Percent Change) 4.6 1954-07-01
6 1954 7 1 Unemployment Rate 5.8 1954-07-01
7 1954 7 1 Inflation Rate NA 1954-07-01
8 1954 8 1 Federal Funds Target Rate NA 1954-08-01
9 1954 8 1 Federal Funds Upper Target NA 1954-08-01
10 1954 8 1 Federal Funds Lower Target NA 1954-08-01
# … with 6,318 more rowsWe pivoted the data longer because it is cluttered and 3 of the variables have NA data so why not just pivot it longer. We will make a new column called rates and we also made the dates usable in the data.
Time Dependent Visualization
I wanted to make a line graph to show the trends of the economic status, but I would have also liked to add color to show the status at each time period.
FedFundsDate%>%
  ggplot(aes(x=date, y = Rates,)) +
  geom_line(size =.3)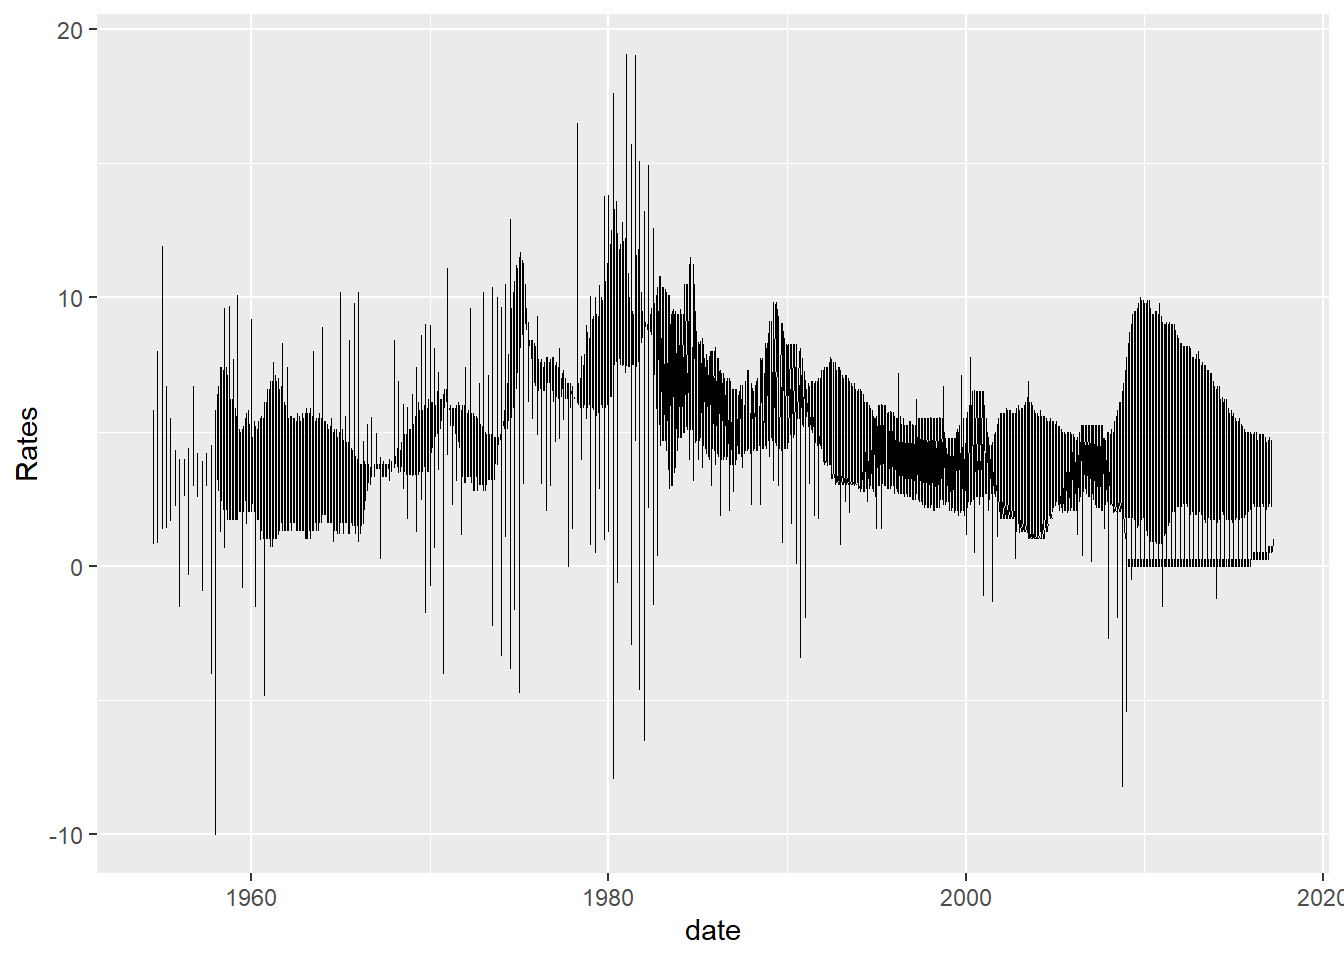
I couldn’t figure out how to make my colors show up for ‘Economic Status’ so this is as far as I ended up going.