This coding demonstration example presents three cases of R function coding: create a function, and use it to perform a data analysis / cleaning / visualization task:
Examples of such functions are: 1) A function that reads in and cleans a dataset.
2) A function that computes summary statistics (e.g., computes the z score for a variable).
3) A function that plots a histogram.
That’s it!
A function that reads in and cleans a dataset
This very simple function reads in the SNL Cast Dataset and converts the first and last episode date columns to date format1.
We also include an optional argument that allows us to only look at those cast members who were an anchor on Weekend Update. This can simplify the process of filtering later on.
read_snl_casts <-function(f,update_only=F){ d <-read_csv(f) d <- d %>%mutate(across(c(first_epid,last_epid),~ymd(as.character(.x))))if(update_only){ d <- d %>%filter(update_anchor) }return(d)}snl_casts <-here("posts","_data","snl_casts.csv") %>%read_snl_casts()snl_casts
Our function will compute the mean, median, and sd for a variable. Specifically, the function will take a vector (or a column from a data frame) and output a tibble of these summary statistics.
sum_stat <-function(x){ stat <-tibble(mean=mean(x,na.rm=T),median=median(x,na.rm=T),sd=sd(x,na.rm=T) )return(stat)}sum_stat(hotels$lead_time)
A function that plots a histogram
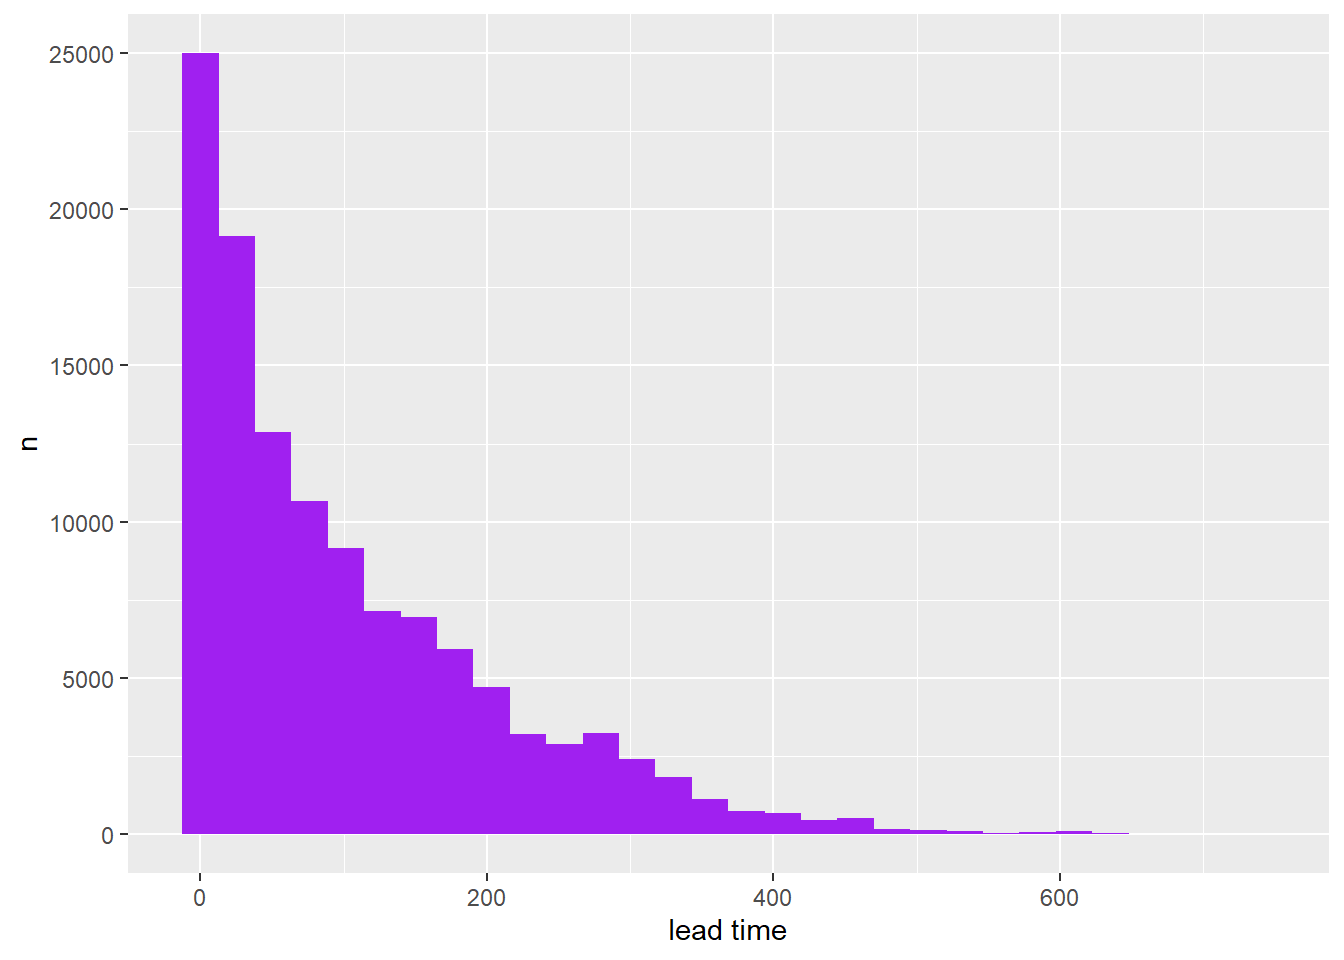
This is also a very simple function - essentially a wrapper function around geom_histogram() that plots a histogram of a variable. We’ll use the hotel bookings dataset again - specifically the lead_time variable.
We can use a double-brace around the name of the column we want a histogram of. For more details around this approach (known as data masking), visit this link.
make_my_hist <-function(dat, colname, fill="purple", xlab="x", ylab="n"){ dat %>%ggplot(aes({{colname}}))+geom_histogram(fill=fill)+labs(x=xlab,y=ylab)}make_my_hist(hotels,lead_time,xlab="lead time")
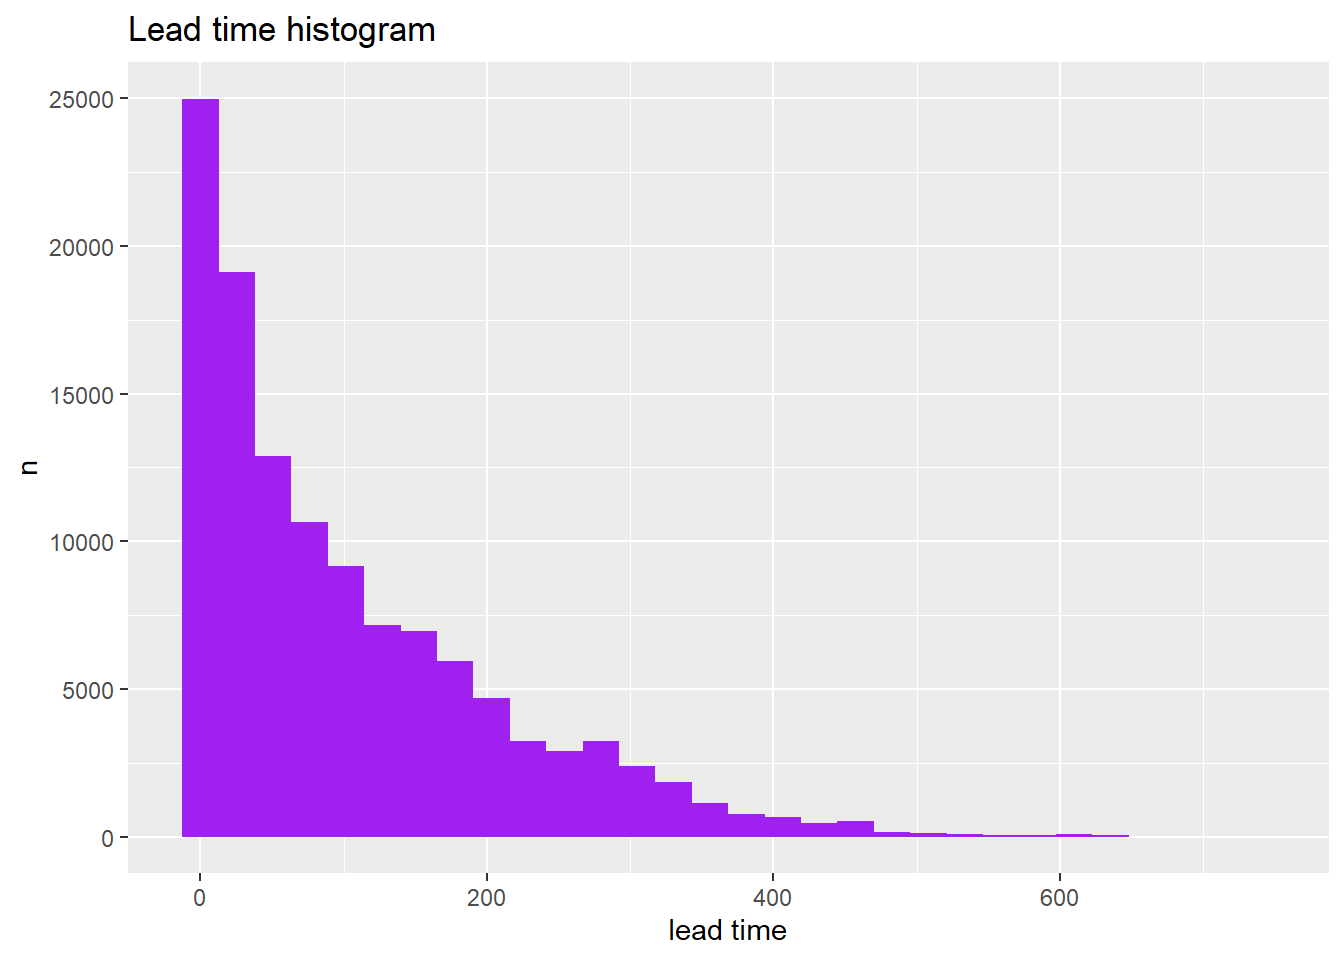
We can save our plot as an object and add to it using the + operator.
my_graph <-make_my_hist(hotels,lead_time,xlab="lead time")my_graph_w_title <- my_graph +labs(title="Lead time histogram")my_graph_w_title
Conclusion
There’s clearly a lot we can do with functions. This solution comprises a small chunk of how to do so. A crucial aspect of programming with functions is knowing the extent to which your function will work. For example, the read_snl_casts() function will fail on any dataset that isn’t snl_casts.csv, while the make_my_hist() function will work on many different datasets.
Functions are great for automating processes and avoiding copy-paste. We will see more of how to do so in the next Function Coding Example - purrr.
---title: "Coding Demonstration Example"author: "Sean Conway"description: "Creating a function"date: "04/22/2023"format: html: df-print: paged toc: false code-fold: false code-copy: true code-tools: true css: styles.css mermaid-format: pngcategories: - Coding_Exampleeditor_options: chunk_output_type: console---```{r}#| label: setup#| warning: false#| message: false#| include: falselibrary(tidyverse)library(lubridate)library(ggplot2)library(here)knitr::opts_chunk$set(echo =TRUE, warning=FALSE, message=FALSE)```##OverviewThis coding demonstration example presents three cases of R function coding: create a function, and use it to perform a data analysis / cleaning / visualization task:Examples of such functions are:1) A function that reads in and cleans a dataset. 2) A function that computes summary statistics (e.g., computes the z score for a variable). 3) A function that plots a histogram. That's it!## A function that reads in and cleans a dataset This very simple function reads in the [SNL Cast Dataset](https://github.com/hhllcks/snldb) and converts the first and last episode date columns to date format^[Note that most values here are `NA`]. We also include an optional argument that allows us to only look at those cast members who were an anchor on [Weekend Update](https://en.wikipedia.org/wiki/Weekend_Update). This can simplify the process of filtering later on. ```{r}read_snl_casts <-function(f,update_only=F){ d <-read_csv(f) d <- d %>%mutate(across(c(first_epid,last_epid),~ymd(as.character(.x))))if(update_only){ d <- d %>%filter(update_anchor) }return(d)}snl_casts <-here("posts","_data","snl_casts.csv") %>%read_snl_casts()snl_castssnl_update_casts <-here("posts","_data","snl_casts.csv") %>%read_snl_casts(update_only = T)snl_update_casts```## A function that computes summary statistics To use such a function, we'll first import the [hotel bookings](https://www.kaggle.com/datasets/jessemostipak/hotel-booking-demand) dataset, which includes plenty of quantitative variables. ```{r}hotels <-here("posts","_data","hotel_bookings.csv") %>%read_csv()hotels```Our function will compute the mean, median, and sd for a variable. Specifically, the function will take a vector (or a column from a data frame) and output a tibble of these summary statistics. ```{r}sum_stat <-function(x){ stat <-tibble(mean=mean(x,na.rm=T),median=median(x,na.rm=T),sd=sd(x,na.rm=T) )return(stat)}sum_stat(hotels$lead_time)```<!-- ```{r} --><!-- map_dfr(list(hotels$lead_time,hotels$babies,hotels$days_in_waiting_list),sum_stat) %>% --><!-- mutate(id=c("lead time","babies","days in waiting list")) %>% --><!-- relocate(id,.before=everything()) --><!-- ``` -->## A function that plots a histogram This is also a very simple function - essentially a [wrapper function](https://en.wikipedia.org/wiki/Wrapper_function) around `geom_histogram()` that plots a histogram of a variable. We'll use the `hotel bookings` dataset again - specifically the `lead_time` variable. We can use a double-brace around the name of the column we want a histogram of. For more details around this approach (known as data masking), visit [this link](https://dplyr.tidyverse.org/articles/programming.html#indirection). ```{r}make_my_hist <-function(dat, colname, fill="purple", xlab="x", ylab="n"){ dat %>%ggplot(aes({{colname}}))+geom_histogram(fill=fill)+labs(x=xlab,y=ylab)}make_my_hist(hotels,lead_time,xlab="lead time")```We can save our plot as an object and add to it using the `+` operator. ```{r}my_graph <-make_my_hist(hotels,lead_time,xlab="lead time")my_graph_w_title <- my_graph +labs(title="Lead time histogram")my_graph_w_title```## Conclusion There's clearly a lot we can do with functions. This solution comprises a small chunk of how to do so. A crucial aspect of programming with functions is knowing the extent to which your function will work. For example, the `read_snl_casts()` function will fail on any dataset that isn't `snl_casts.csv`, while the `make_my_hist()` function will work on many different datasets. Functions are great for automating processes and avoiding copy-paste. We will see more of how to do so in the next Function Coding Example - `purrr`.