Code
library(tidyverse)

knitr::opts_chunk$set(echo = TRUE)library(tidyverse)
knitr::opts_chunk$set(echo = TRUE)bird_data <- read.csv("_data/birds.csv")%>%
select(-contains("code"))
head(bird_data) Domain Area Element Item Year Unit Value Flag
1 Live Animals Afghanistan Stocks Chickens 1961 1000 Head 4700 F
2 Live Animals Afghanistan Stocks Chickens 1962 1000 Head 4900 F
3 Live Animals Afghanistan Stocks Chickens 1963 1000 Head 5000 F
4 Live Animals Afghanistan Stocks Chickens 1964 1000 Head 5300 F
5 Live Animals Afghanistan Stocks Chickens 1965 1000 Head 5500 F
6 Live Animals Afghanistan Stocks Chickens 1966 1000 Head 5800 F
Flag.Description
1 FAO estimate
2 FAO estimate
3 FAO estimate
4 FAO estimate
5 FAO estimate
6 FAO estimateUpon first viewing, after removing redundant rows, we can see that the data set is about different poultry amounts in different regions of the world across different years. Each observation contains an area of the world, a year, and the type of poultry being collected. It also has information such as the value of the resource during that year, and a Flag and descriptor about how the data was gathered, which can be things like FAO Estimate or Unofficial data.
#look at the unique entries for each column
select(bird_data, Area)%>%
  n_distinct(.)
[1] 248select(bird_data, Item)%>%
table()%>%
prop.table()Item
Chickens Ducks Geese and guinea fowls
0.42205507 0.22303645 0.13351842
Pigeons, other birds Turkeys
0.03760855 0.18378152 select(bird_data, Year)%>%
table()Year
1961 1962 1963 1964 1965 1966 1967 1968 1969 1970 1971 1972 1973 1974 1975 1976
493 493 493 493 494 495 495 495 498 498 498 498 498 499 499 499
1977 1978 1979 1980 1981 1982 1983 1984 1985 1986 1987 1988 1989 1990 1991 1992
498 498 497 496 498 498 495 498 499 499 500 502 503 512 514 569
1993 1994 1995 1996 1997 1998 1999 2000 2001 2002 2003 2004 2005 2006 2007 2008
574 574 574 574 574 574 574 575 575 575 575 575 575 576 576 576
2009 2010 2011 2012 2013 2014 2015 2016 2017 2018
576 576 576 577 577 577 577 577 577 577 The data covers 248 unique areas, some countries, some continents, and even the world, contains information about 5 main groups of birds, and spans from the years 1961 to 2018. The number of data points collected for each year increases as the years increase. To check if we are missing any other critical data from the other columns we can look at a full summary of the table.
summarytools::dfSummary(bird_data,
                        varnumbers = FALSE,
                        plain.ascii  = FALSE,
                        style        = "grid",
                        graph.magnif = 0.50,
                        valid.col    = FALSE)
text graphs are displayed; set 'tmp.img.dir' parameter to activate png graphs### Data Frame Summary
#### bird_data
**Dimensions:** 30977 x 9
**Duplicates:** 0
+-------------------+---------------------------------+-----------------------+--------------------------+---------+
| Variable | Stats / Values | Freqs (% of Valid) | Graph | Missing |
+===================+=================================+=======================+==========================+=========+
| Domain\ | 1\. Live Animals | 30977 (100.0%) | IIIIIIIIIIIIIIIIIIII | 0\ |
| [character] | | | | (0.0%) |
+-------------------+---------------------------------+-----------------------+--------------------------+---------+
| Area\ | 1\. Africa\ | 290 ( 0.9%)\ | \ | 0\ |
| [character] | 2\. Asia\ | 290 ( 0.9%)\ | \ | (0.0%) |
| | 3\. Eastern Asia\ | 290 ( 0.9%)\ | \ | |
| | 4\. Egypt\ | 290 ( 0.9%)\ | \ | |
| | 5\. Europe\ | 290 ( 0.9%)\ | \ | |
| | 6\. France\ | 290 ( 0.9%)\ | \ | |
| | 7\. Greece\ | 290 ( 0.9%)\ | \ | |
| | 8\. Myanmar\ | 290 ( 0.9%)\ | \ | |
| | 9\. Northern Africa\ | 290 ( 0.9%)\ | \ | |
| | 10\. South-eastern Asia\ | 290 ( 0.9%)\ | \ | |
| | [ 238 others ] | 28077 (90.6%) | IIIIIIIIIIIIIIIIII | |
+-------------------+---------------------------------+-----------------------+--------------------------+---------+
| Element\ | 1\. Stocks | 30977 (100.0%) | IIIIIIIIIIIIIIIIIIII | 0\ |
| [character] | | | | (0.0%) |
+-------------------+---------------------------------+-----------------------+--------------------------+---------+
| Item\ | 1\. Chickens\ | 13074 (42.2%)\ | IIIIIIII \ | 0\ |
| [character] | 2\. Ducks\ | 6909 (22.3%)\ | IIII \ | (0.0%) |
| | 3\. Geese and guinea fowls\ | 4136 (13.4%)\ | II \ | |
| | 4\. Pigeons, other birds\ | 1165 ( 3.8%)\ | \ | |
| | 5\. Turkeys | 5693 (18.4%) | III | |
+-------------------+---------------------------------+-----------------------+--------------------------+---------+
| Year\ | Mean (sd) : 1990.6 (16.7)\ | 58 distinct values | . . . \ \ . : \ \ : : :\ | 0\ |
| [integer] | min < med < max:\ | | : : : . : : : : : :\ | (0.0%) |
| | 1961 < 1992 < 2018\ | | : : : : : : : : : :\ | |
| | IQR (CV) : 29 (0) | | : : : : : : : : : :\ | |
| | | | : : : : : : : : : : | |
+-------------------+---------------------------------+-----------------------+--------------------------+---------+
| Unit\ | 1\. 1000 Head | 30977 (100.0%) | IIIIIIIIIIIIIIIIIIII | 0\ |
| [character] | | | | (0.0%) |
+-------------------+---------------------------------+-----------------------+--------------------------+---------+
| Value\ | Mean (sd) : 99410.6 (720611.4)\ | 11495 distinct values | :\ | 1036\ |
| [integer] | min < med < max:\ | | :\ | (3.3%) |
| | 0 < 1800 < 23707134\ | | :\ | |
| | IQR (CV) : 15233 (7.2) | | :\ | |
| | | | : | |
+-------------------+---------------------------------+-----------------------+--------------------------+---------+
| Flag\ | 1\. (Empty string)\ | 10773 (34.8%)\ | IIIIII \ | 0\ |
| [character] | 2\. *\ | 1494 ( 4.8%)\ | \ | (0.0%) |
| | 3\. A\ | 6488 (20.9%)\ | IIII \ | |
| | 4\. F\ | 10007 (32.3%)\ | IIIIII \ | |
| | 5\. Im\ | 1213 ( 3.9%)\ | \ | |
| | 6\. M | 1002 ( 3.2%) | | |
+-------------------+---------------------------------+-----------------------+--------------------------+---------+
| Flag.Description\ | 1\. Aggregate, may include of\ | 6488 (20.9%)\ | IIII \ | 0\ |
| [character] | 2\. Data not available\ | 1002 ( 3.2%)\ | \ | (0.0%) |
| | 3\. FAO data based on imputat\ | 1213 ( 3.9%)\ | \ | |
| | 4\. FAO estimate\ | 10007 (32.3%)\ | IIIIII \ | |
| | 5\. Official data\ | 10773 (34.8%)\ | IIIIII \ | |
| | 6\. Unofficial figure | 1494 ( 4.8%) | | |
+-------------------+---------------------------------+-----------------------+--------------------------+---------+Here we can see that all of the observations have the same value for Domain, Element, and Unit. So every observation is of live animals, and they all share the unit of 1000 head.
world_data <- bird_data%>%
  filter(Area== "World")%>%
  group_by(Item)

ggplot(world_data, aes(Year, Value)) +
      geom_point() +
      geom_smooth() +
      labs(title = "World Polutry Populations over Time")+
      facet_wrap(vars(Item), scales = "free")
`geom_smooth()` using method = 'loess' and formula = 'y ~ x'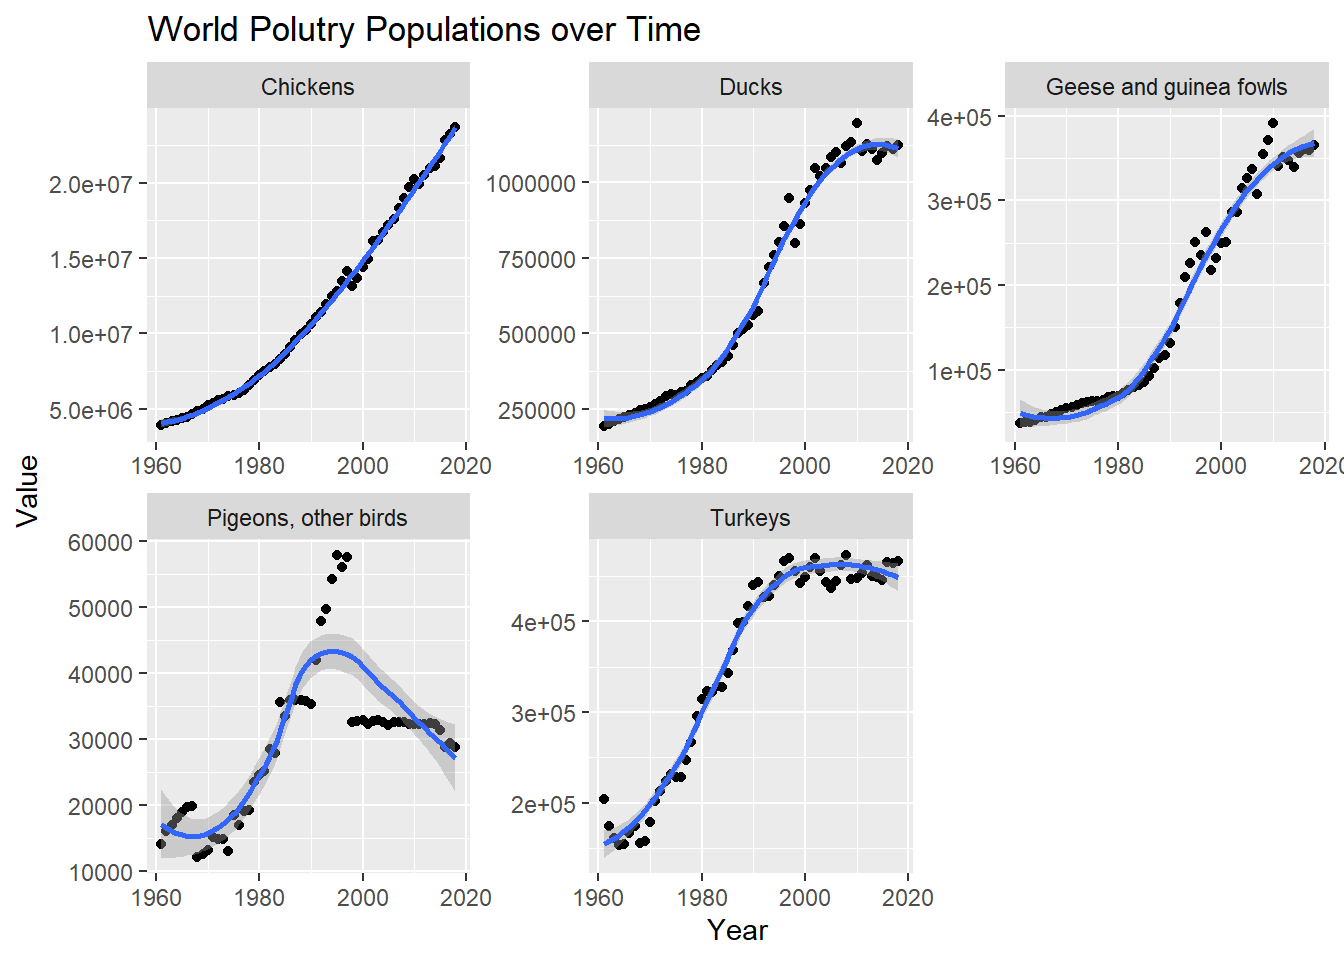
We can see from above the worldwide changes in the recorded bird populations and that as a trend all bird counts have been steadily rising, with Pigeons and other birds taking a sharp decline in the late 1990’s.