Code
library(tidyverse)

knitr::opts_chunk$set(echo = TRUE, warning=FALSE, message=FALSE)library(tidyverse)
knitr::opts_chunk$set(echo = TRUE, warning=FALSE, message=FALSE)Today’s challenge is to
read in a dataset, and
describe the dataset using both words and any supporting information (e.g., tables, etc)
Read in one (or more) of the following data sets, using the correct R package and command.
Find the _data folder, located inside the posts folder. Then you can read in the data, using either one of the readr standard tidy read commands, or a specialized package such as readxl.
df <- read_csv('_data/FAOstat_livestock.csv')
head(df)
# A tibble: 6 × 14
`Domain Code` Domain `Area Code` Area `Element Code` Element `Item Code`
<chr> <chr> <dbl> <chr> <dbl> <chr> <dbl>
1 QA Live Anima… 2 Afgh… 5111 Stocks 1107
2 QA Live Anima… 2 Afgh… 5111 Stocks 1107
3 QA Live Anima… 2 Afgh… 5111 Stocks 1107
4 QA Live Anima… 2 Afgh… 5111 Stocks 1107
5 QA Live Anima… 2 Afgh… 5111 Stocks 1107
6 QA Live Anima… 2 Afgh… 5111 Stocks 1107
# ℹ 7 more variables: Item <chr>, `Year Code` <dbl>, Year <dbl>, Unit <chr>,
# Value <dbl>, Flag <chr>, `Flag Description` <chr>Using a combination of words and results of R commands, can you provide a high level description of the data? Describe as efficiently as possible where/how the data was (likely) gathered, indicate the cases and variables (both the interpretation and any details you deem useful to the reader to fully understand your chosen data).
Description : The “livestock” dataset with the columns “Domain Code, Domain, Area Code, Area, Element Code, Element, Item Code, Item, Year Code, Year, Unit, Value, Flag, Flag Description” is to describe livestock production and trade across various geographic areas and years.
Following is the summary and dimension of data:
summary(df) Domain Code Domain Area Code Area
Length:82116 Length:82116 Min. : 1.0 Length:82116
Class :character Class :character 1st Qu.: 73.0 Class :character
Mode :character Mode :character Median : 146.0 Mode :character
Mean : 912.7
3rd Qu.: 221.0
Max. :5504.0
Element Code Element Item Code Item
Min. :5111 Length:82116 Min. : 866 Length:82116
1st Qu.:5111 Class :character 1st Qu.: 976 Class :character
Median :5111 Mode :character Median :1034 Mode :character
Mean :5111 Mean :1018
3rd Qu.:5111 3rd Qu.:1096
Max. :5111 Max. :1126
Year Code Year Unit Value
Min. :1961 Min. :1961 Length:82116 Min. :0.000e+00
1st Qu.:1976 1st Qu.:1976 Class :character 1st Qu.:1.250e+04
Median :1991 Median :1991 Mode :character Median :2.247e+05
Mean :1990 Mean :1990 Mean :1.163e+07
3rd Qu.:2005 3rd Qu.:2005 3rd Qu.:2.377e+06
Max. :2018 Max. :2018 Max. :1.490e+09
NA's :1301
Flag Flag Description
Length:82116 Length:82116
Class :character Class :character
Mode :character Mode :character
dim(df)[1] 82116 14All varitey of live stocks in the data:
unique_items <- unique(df$Item)
num_unique_items <- length(unique_items)
cat(paste("There are", num_unique_items, "unique Varitey of animals present in the dataset"))
There are 9 unique Varitey of animals present in the datasetcat(paste(unique_items, collapse = ", "))Asses, Camels, Cattle, Goats, Horses, Mules, Sheep, Buffaloes, PigsThe data is collected from various areas like:
unique_items <- unique(df$Area)
num_unique_items <- length(unique_items)
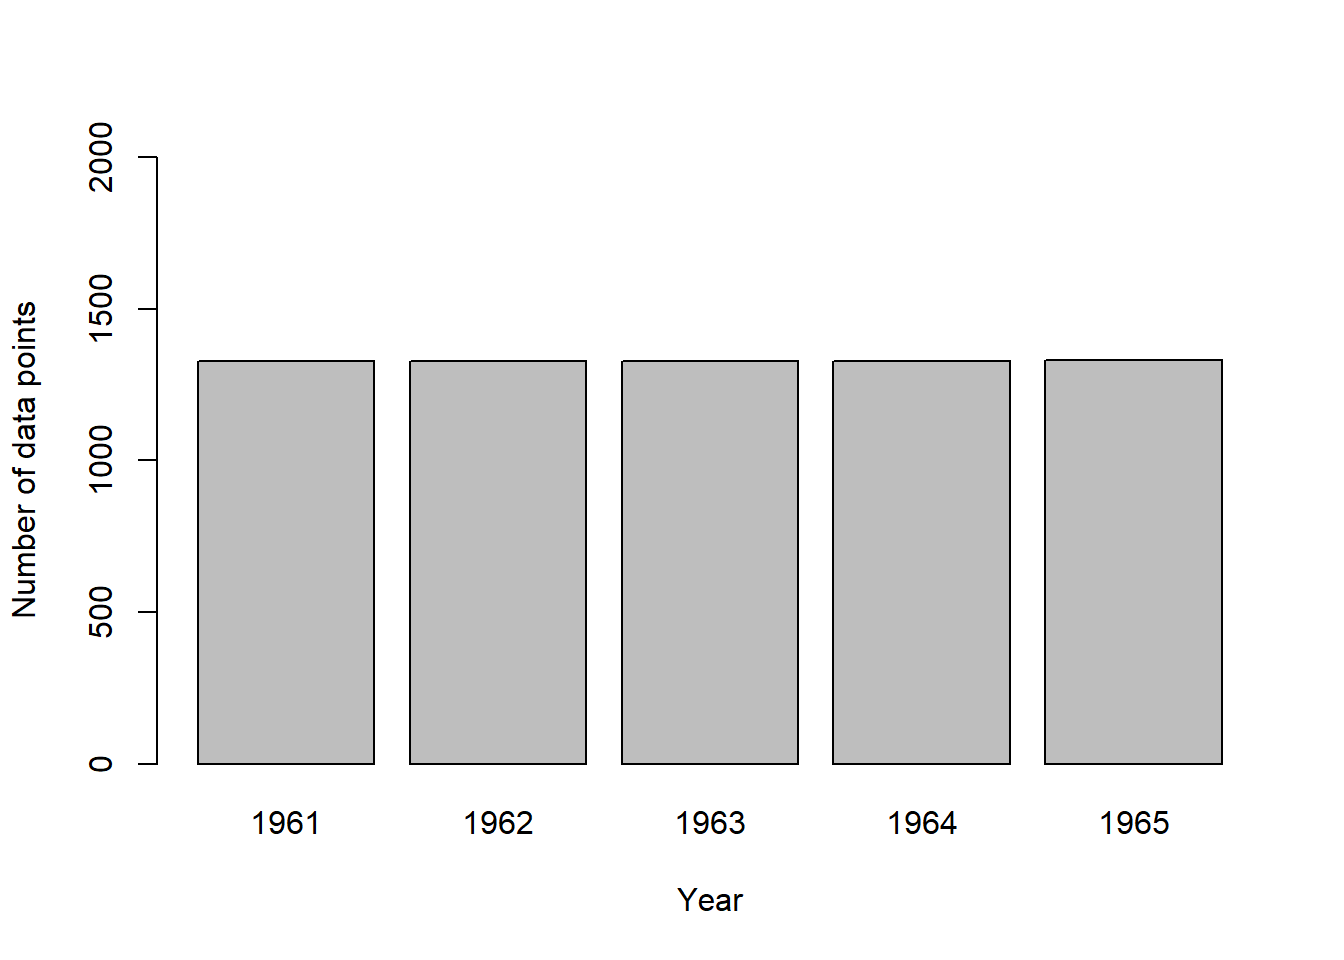
cat(paste("Total no of areas: ", num_unique_items))Total no of areas: 253cat(paste(unique_items, collapse = ", "))Afghanistan, Albania, Algeria, American Samoa, Angola, Antigua and Barbuda, Argentina, Armenia, Aruba, Australia, Austria, Azerbaijan, Bahamas, Bahrain, Bangladesh, Barbados, Belarus, Belgium, Belgium-Luxembourg, Belize, Benin, Bermuda, Bhutan, Bolivia (Plurinational State of), Bosnia and Herzegovina, Botswana, Brazil, British Virgin Islands, Brunei Darussalam, Bulgaria, Burkina Faso, Burundi, Cabo Verde, Cambodia, Cameroon, Canada, Cayman Islands, Central African Republic, Chad, Chile, China, Hong Kong SAR, China, mainland, China, Taiwan Province of, Colombia, Comoros, Congo, Cook Islands, Costa Rica, Côte d'Ivoire, Croatia, Cuba, Cyprus, Czechia, Czechoslovakia, Democratic People's Republic of Korea, Democratic Republic of the Congo, Denmark, Djibouti, Dominica, Dominican Republic, Ecuador, Egypt, El Salvador, Equatorial Guinea, Eritrea, Estonia, Eswatini, Ethiopia, Ethiopia PDR, Falkland Islands (Malvinas), Faroe Islands, Fiji, Finland, France, French Guyana, French Polynesia, Gabon, Gambia, Georgia, Germany, Ghana, Greece, Greenland, Grenada, Guadeloupe, Guam, Guatemala, Guinea, Guinea-Bissau, Guyana, Haiti, Honduras, Hungary, Iceland, India, Indonesia, Iran (Islamic Republic of), Iraq, Ireland, Israel, Italy, Jamaica, Japan, Jordan, Kazakhstan, Kenya, Kiribati, Kuwait, Kyrgyzstan, Lao People's Democratic Republic, Latvia, Lebanon, Lesotho, Liberia, Libya, Liechtenstein, Lithuania, Luxembourg, Madagascar, Malawi, Malaysia, Mali, Malta, Martinique, Mauritania, Mauritius, Mexico, Micronesia (Federated States of), Mongolia, Montenegro, Montserrat, Morocco, Mozambique, Myanmar, Namibia, Nauru, Nepal, Netherlands, Netherlands Antilles (former), New Caledonia, New Zealand, Nicaragua, Niger, Nigeria, Niue, Norfolk Island, North Macedonia, Norway, Oman, Pacific Islands Trust Territory, Pakistan, Palestine, Panama, Papua New Guinea, Paraguay, Peru, Philippines, Poland, Portugal, Puerto Rico, Qatar, Republic of Korea, Republic of Moldova, Réunion, Romania, Russian Federation, Rwanda, Saint Helena, Ascension and Tristan da Cunha, Saint Kitts and Nevis, Saint Lucia, Saint Pierre and Miquelon, Saint Vincent and the Grenadines, Samoa, Sao Tome and Principe, Saudi Arabia, Senegal, Serbia, Serbia and Montenegro, Seychelles, Sierra Leone, Singapore, Slovakia, Slovenia, Solomon Islands, Somalia, South Africa, South Sudan, Spain, Sri Lanka, Sudan, Sudan (former), Suriname, Sweden, Switzerland, Syrian Arab Republic, Tajikistan, Thailand, Timor-Leste, Togo, Tokelau, Tonga, Trinidad and Tobago, Tunisia, Turkey, Turkmenistan, Tuvalu, Uganda, Ukraine, United Arab Emirates, United Kingdom of Great Britain and Northern Ireland, United Republic of Tanzania, United States of America, United States Virgin Islands, Uruguay, USSR, Uzbekistan, Vanuatu, Venezuela (Bolivarian Republic of), Viet Nam, Wallis and Futuna Islands, Western Sahara, Yemen, Yugoslav SFR, Zambia, Zimbabwe, World, Africa, Eastern Africa, Middle Africa, Northern Africa, Southern Africa, Western Africa, Americas, Northern America, Central America, Caribbean, South America, Asia, Central Asia, Eastern Asia, Southern Asia, South-eastern Asia, Western Asia, Europe, Eastern Europe, Northern Europe, Southern Europe, Western Europe, Oceania, Australia and New Zealand, Melanesia, Micronesia, PolynesiaHere are the no of datapoints present from year 1961-1965:
year_filter <- df$Year %in% c("1961", "1962", "1963", "1964", "1965")
filtered_data <- df[year_filter,]
year_counts <- table(filtered_data$Year)
barplot(year_counts, xlab = "Year", ylab = "Number of data points",
        ylim = c(0, 2000))