library(tidyverse)
library(ggplot2)

knitr::opts_chunk$set(echo = TRUE, warning=FALSE, message=FALSE)
Challenge 5-AB_NYC_2019
challenge_5
Jinxia Niu
AB_NYC_2019
Introduction to Visualization
Challenge Overview
Today’s challenge is to:
- read in a data set, and describe the data set using both words and any supporting information (e.g., tables, etc)
- tidy data (as needed, including sanity checks)
- mutate variables as needed (including sanity checks)
- create at least two univariate visualizations
- try to make them “publication” ready
- Explain why you choose the specific graph type
- Create at least one bivariate visualization
- try to make them “publication” ready
- Explain why you choose the specific graph type
R Graph Gallery is a good starting point for thinking about what information is conveyed in standard graph types, and includes example R code.
(be sure to only include the category tags for the data you use!)
Read in data
Read in one (or more) of the following datasets, using the correct R package and command.
- cereal.csv ⭐
- Total_cost_for_top_15_pathogens_2018.xlsx ⭐
- Australian Marriage ⭐⭐
- AB_NYC_2019.csv ⭐⭐⭐
- StateCounty2012.xls ⭐⭐⭐
- Public School Characteristics ⭐⭐⭐⭐
- USA Households ⭐⭐⭐⭐⭐
library(tidyverse)
 AB_NYC_2019 <- read.csv("_data/AB_NYC_2019.csv")
 dim(AB_NYC_2019)
[1] 48895 16 colnames(AB_NYC_2019) [1] "id" "name"
[3] "host_id" "host_name"
[5] "neighbourhood_group" "neighbourhood"
[7] "latitude" "longitude"
[9] "room_type" "price"
[11] "minimum_nights" "number_of_reviews"
[13] "last_review" "reviews_per_month"
[15] "calculated_host_listings_count" "availability_365" head(AB_NYC_2019,10) id name host_id host_name
1 2539 Clean & quiet apt home by the park 2787 John
2 2595 Skylit Midtown Castle 2845 Jennifer
3 3647 THE VILLAGE OF HARLEM....NEW YORK ! 4632 Elisabeth
4 3831 Cozy Entire Floor of Brownstone 4869 LisaRoxanne
5 5022 Entire Apt: Spacious Studio/Loft by central park 7192 Laura
6 5099 Large Cozy 1 BR Apartment In Midtown East 7322 Chris
7 5121 BlissArtsSpace! 7356 Garon
8 5178 Large Furnished Room Near B'way 8967 Shunichi
9 5203 Cozy Clean Guest Room - Family Apt 7490 MaryEllen
10 5238 Cute & Cozy Lower East Side 1 bdrm 7549 Ben
neighbourhood_group neighbourhood latitude longitude room_type
1 Brooklyn Kensington 40.64749 -73.97237 Private room
2 Manhattan Midtown 40.75362 -73.98377 Entire home/apt
3 Manhattan Harlem 40.80902 -73.94190 Private room
4 Brooklyn Clinton Hill 40.68514 -73.95976 Entire home/apt
5 Manhattan East Harlem 40.79851 -73.94399 Entire home/apt
6 Manhattan Murray Hill 40.74767 -73.97500 Entire home/apt
7 Brooklyn Bedford-Stuyvesant 40.68688 -73.95596 Private room
8 Manhattan Hell's Kitchen 40.76489 -73.98493 Private room
9 Manhattan Upper West Side 40.80178 -73.96723 Private room
10 Manhattan Chinatown 40.71344 -73.99037 Entire home/apt
price minimum_nights number_of_reviews last_review reviews_per_month
1 149 1 9 2018-10-19 0.21
2 225 1 45 2019-05-21 0.38
3 150 3 0 NA
4 89 1 270 2019-07-05 4.64
5 80 10 9 2018-11-19 0.10
6 200 3 74 2019-06-22 0.59
7 60 45 49 2017-10-05 0.40
8 79 2 430 2019-06-24 3.47
9 79 2 118 2017-07-21 0.99
10 150 1 160 2019-06-09 1.33
calculated_host_listings_count availability_365
1 6 365
2 2 355
3 1 365
4 1 194
5 1 0
6 1 129
7 1 0
8 1 220
9 1 0
10 4 188AB_NYC_2019 %>%
select( "room_type", "neighbourhood", "price", everything())%>%
group_by(room_type) %>%
summarise(avg_price = mean(price, na.rm = TRUE))# A tibble: 3 × 2
room_type avg_price
<chr> <dbl>
1 Entire home/apt 212.
2 Private room 89.8
3 Shared room 70.1Briefly describe the data
It’s a data set of the Airbnb data in New York City in 2019, it includes 16 variables.48895 observations. The key variables includes the neighborhoods the Airbnb rooms located in, the location, the prices and the reviews they got. There are total three kind of rooms:Emtir home/apt, Private room and Shared room, and the avarage price for each different kind of room is $211, $89 and $70.
The key questions I am interested are: what’s the most expensive neighborhoods? What’s the relationship between the price and the location of each different kind of rooms?
Tidy Data (as needed)
AB_NYC_2019 %>%
  select(-c("id","host_id","host_name","last_review","calculated_host_listings_count" )) %>%
  print(AB_NYC_2019)
Error in print.default(m, ..., quote = quote, right = right, max = max): invalid printing digits -2147483648 # what's the codes to combine two variables into one in R? like combine "latitude" and "longitude"? Univariate Visualizations
  ggplot(AB_NYC_2019,aes(price))+
  geom_histogram()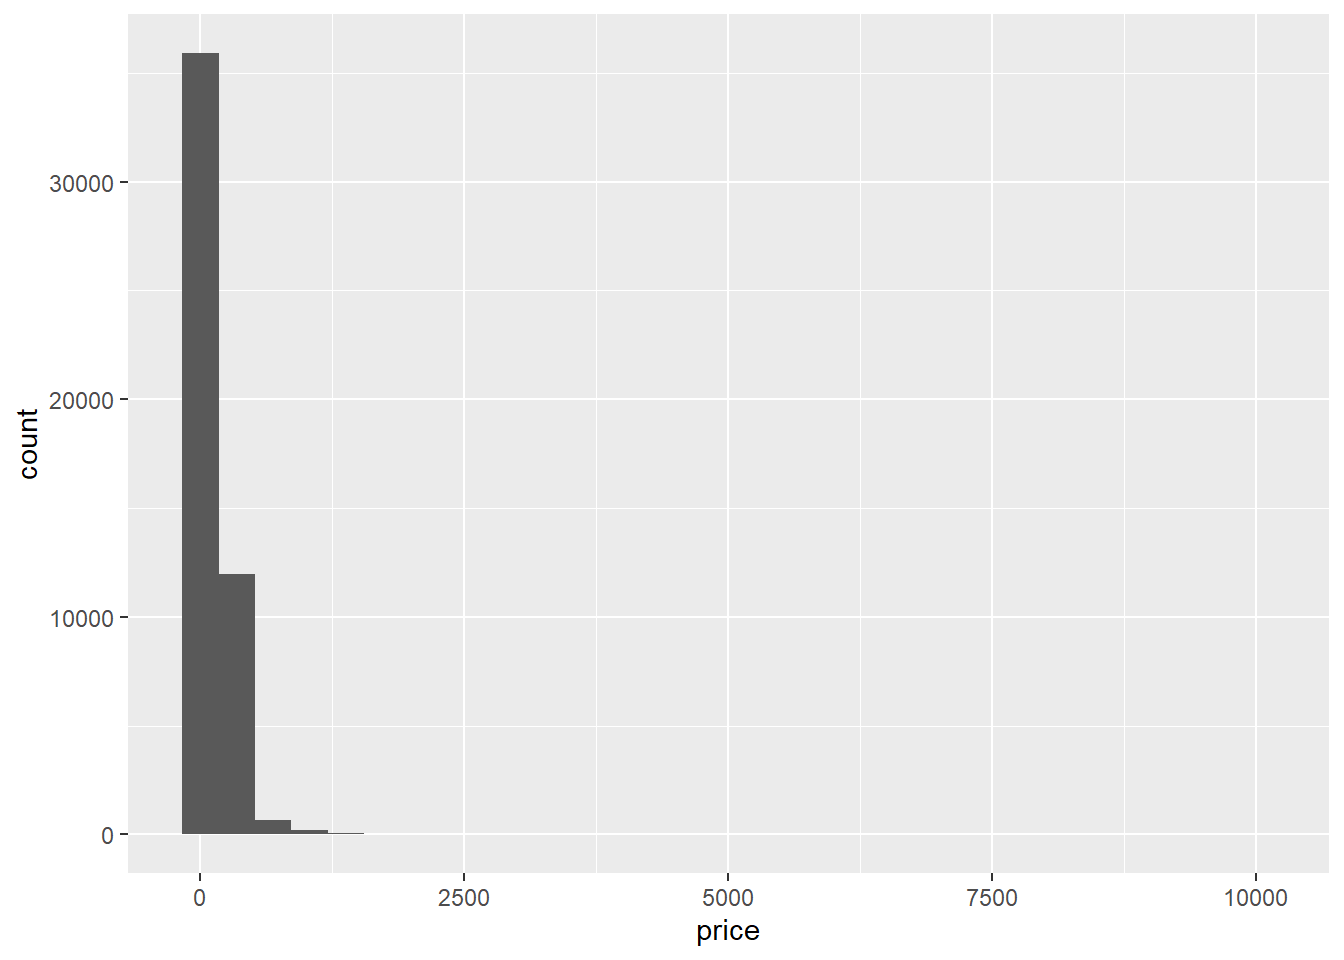
AB_NYC_2019 %>%
  ggplot(aes(neighbourhood_group,price))+
  geom_boxplot()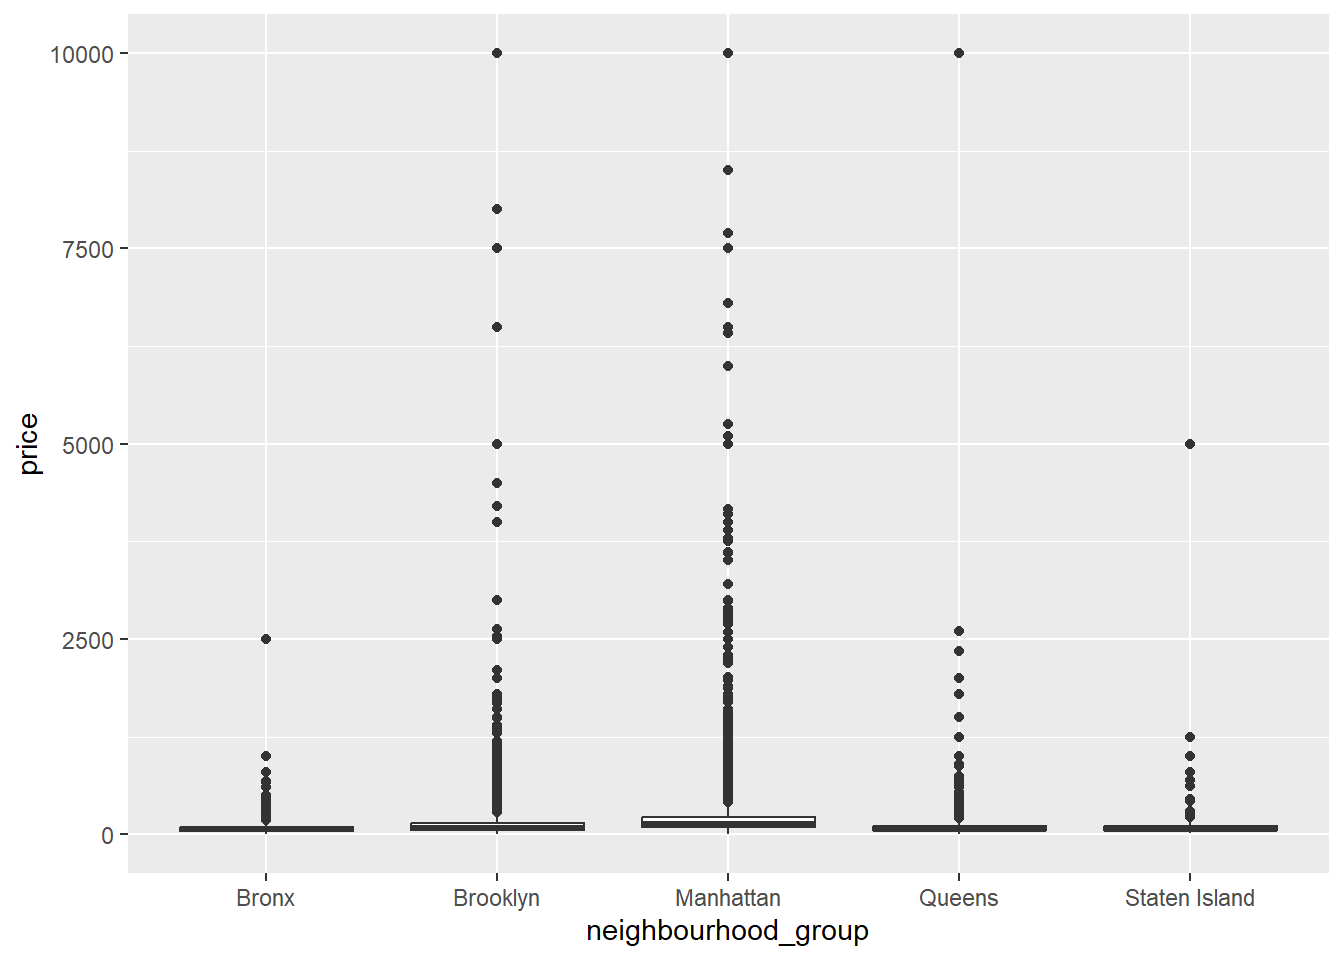
AB_NYC_2019 %>%
  ggplot(aes(number_of_reviews,neighbourhood_group,))+
  geom_point()+
  facet_wrap(vars(neighbourhood_group))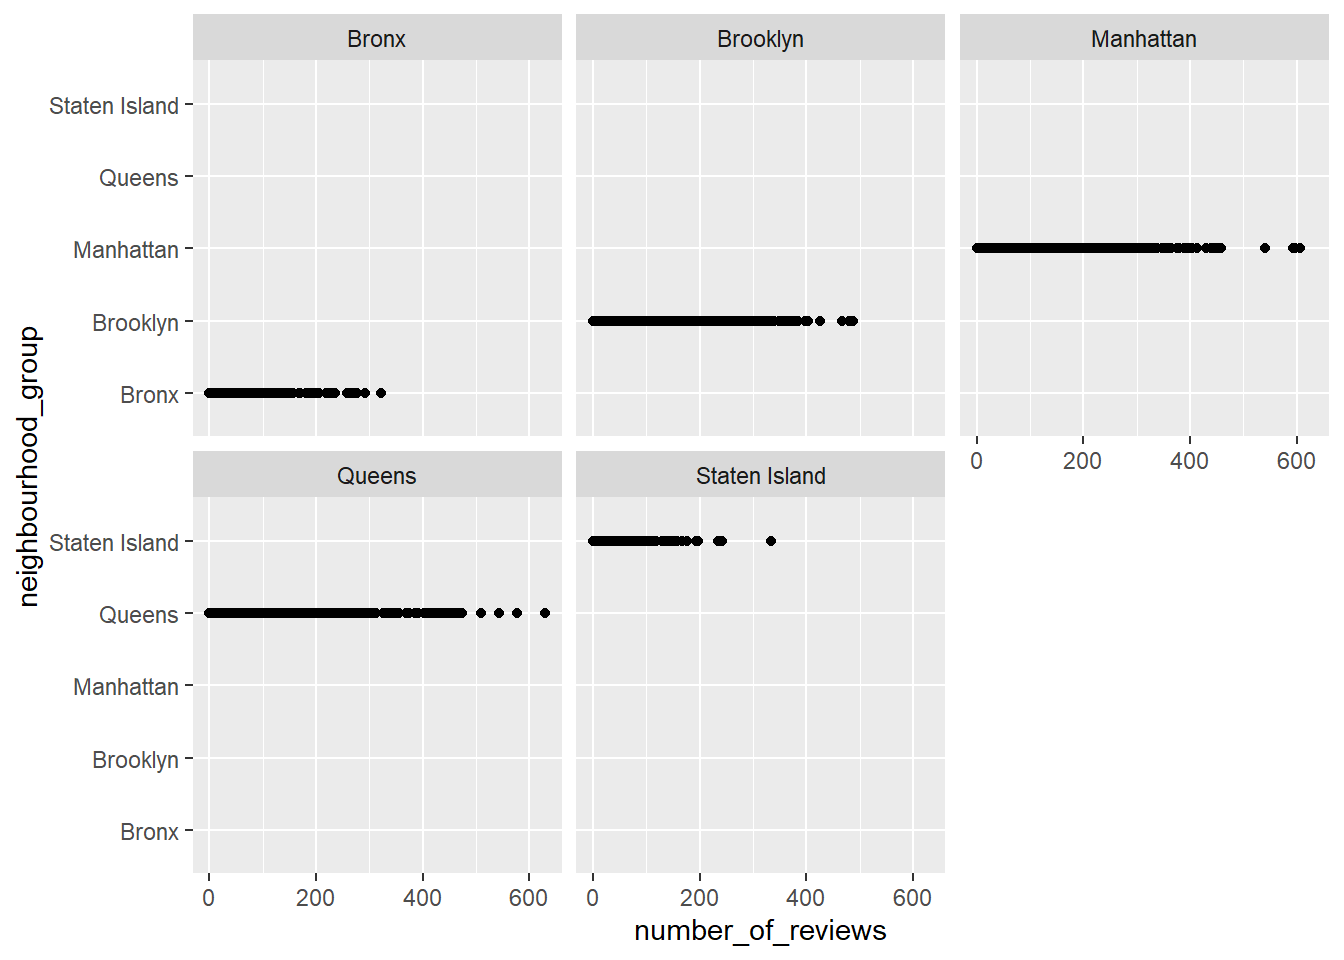
  AB_NYC_2019 %>%
  ggplot(aes(price, number_of_reviews))+
  geom_line()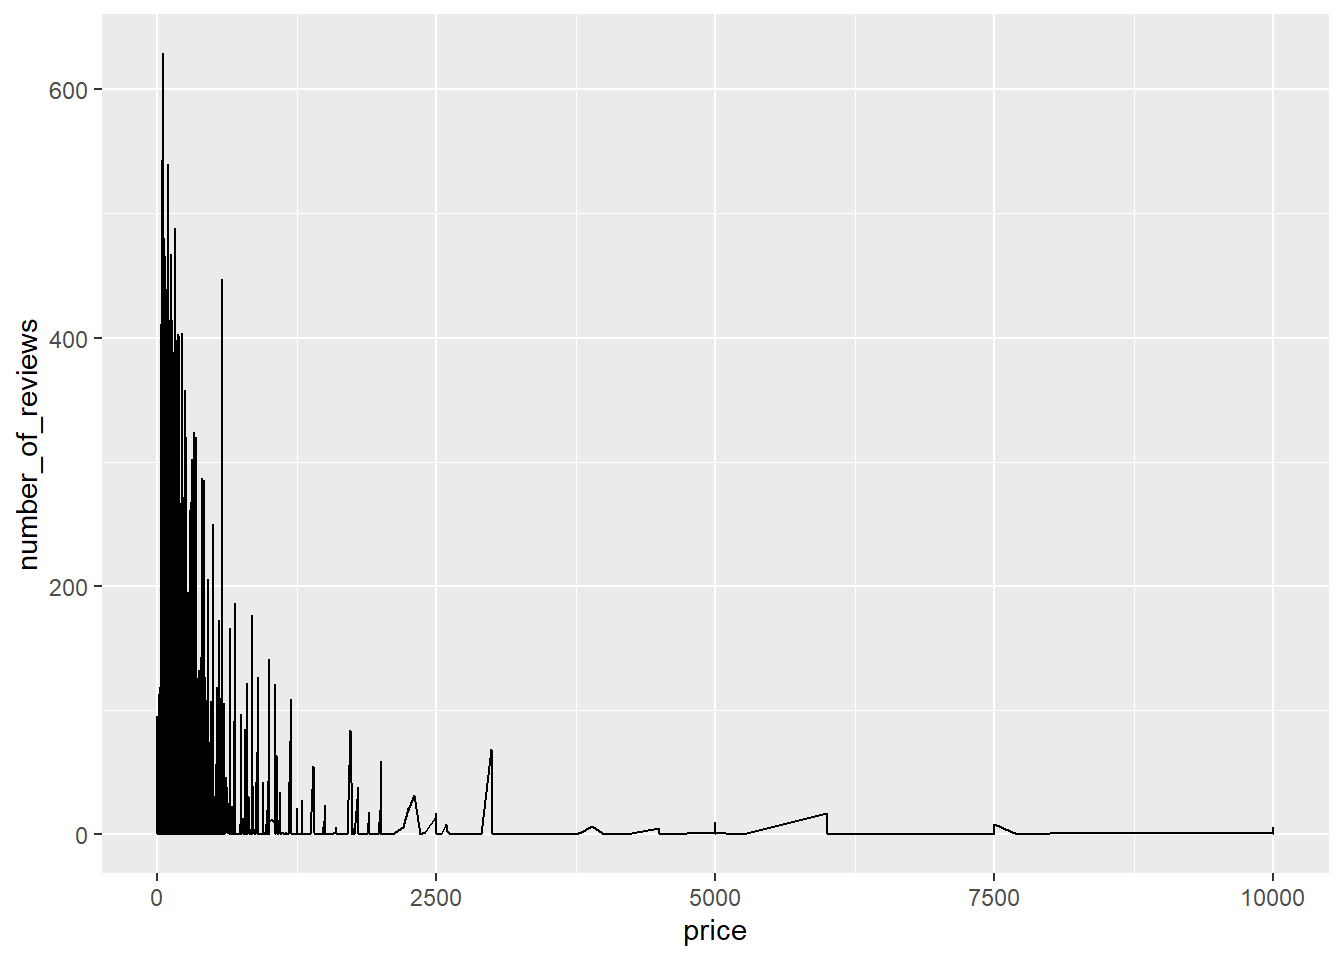
Is your data already tidy, or is there work to be done? Be sure to anticipate your end result to provide a sanity check, and document your work here.
Are there any variables that require mutation to be usable in your analysis stream? For example, do you need to calculate new values in order to graph them? Can string values be represented numerically? Do you need to turn any variables into factors and reorder for ease of graphics and visualization?
Document your work here.
Univariate Visualizations
Bivariate Visualization(s)
Any additional comments?