Code
library(tidyverse)
library(summarytools)

knitr::opts_chunk$set(echo = TRUE, warning=FALSE, message=FALSE)library(tidyverse)
library(summarytools)
knitr::opts_chunk$set(echo = TRUE, warning=FALSE, message=FALSE)# reading in FAO stat, dairy cattle and assigning to FAO_Dairy
FAO_Dairy <- read.csv("_data/FAOSTAT_cattle_dairy.csv")
# removing unchanging and duplicate variables
# assigning to FAO_Dairy_Clean
FAO_Dairy_Clean <- FAO_Dairy %>%
select('Area', 'Element', 'Year', 'Unit', 'Value', 'Flag', 'Flag.Description')
head(FAO_Dairy_Clean) Area Element Year Unit Value Flag Flag.Description
1 Afghanistan Milk Animals 1961 Head 700000 F FAO estimate
2 Afghanistan Yield 1961 hg/An 5000 Fc Calculated data
3 Afghanistan Production 1961 tonnes 350000 F FAO estimate
4 Afghanistan Milk Animals 1962 Head 700000 F FAO estimate
5 Afghanistan Yield 1962 hg/An 5000 Fc Calculated data
6 Afghanistan Production 1962 tonnes 350000 F FAO estimate# summarizing the original data set, viewing year and area in tables
dfSummary(FAO_Dairy_Clean)Data Frame Summary
FAO_Dairy_Clean
Dimensions: 36449 x 7
Duplicates: 0
---------------------------------------------------------------------------------------------------------------------------
No Variable Stats / Values Freqs (% of Valid) Graph Valid Missing
---- ------------------ -------------------------------- ----------------------- --------------------- ---------- ---------
1 Area 1. Afghanistan 174 ( 0.5%) 36449 0
[character] 2. Africa 174 ( 0.5%) (100.0%) (0.0%)
3. Albania 174 ( 0.5%)
4. Algeria 174 ( 0.5%)
5. American Samoa 174 ( 0.5%)
6. Americas 174 ( 0.5%)
7. Angola 174 ( 0.5%)
8. Antigua and Barbuda 174 ( 0.5%)
9. Argentina 174 ( 0.5%)
10. Asia 174 ( 0.5%)
[ 222 others ] 34709 (95.2%) IIIIIIIIIIIIIIIIIII
2 Element 1. Milk Animals 12158 (33.4%) IIIIII 36449 0
[character] 2. Production 12170 (33.4%) IIIIII (100.0%) (0.0%)
3. Yield 12121 (33.3%) IIIIII
3 Year Mean (sd) : 1990.4 (16.8) 58 distinct values . . . . : : : : 36449 0
[integer] min < med < max: : : : . : : : : : : (100.0%) (0.0%)
1961 < 1991 < 2018 : : : : : : : : : :
IQR (CV) : 29 (0) : : : : : : : : : :
: : : : : : : : : :
4 Unit 1. Head 12158 (33.4%) IIIIII 36449 0
[character] 2. hg/An 12121 (33.3%) IIIIII (100.0%) (0.0%)
3. tonnes 12170 (33.4%) IIIIII
5 Value Mean (sd) : 4410235 (25744621) 24088 distinct values : 36375 74
[integer] min < med < max: : (99.8%) (0.2%)
7 < 43266 < 683217055 :
IQR (CV) : 692151 (5.8) :
:
6 Flag 1. (Empty string) 10044 (27.6%) IIIII 36449 0
[character] 2. * 810 ( 2.2%) (100.0%) (0.0%)
3. A 3070 ( 8.4%) I
4. F 7045 (19.3%) III
5. Fc 13136 (36.0%) IIIIIII
6. Im 2270 ( 6.2%) I
7. M 74 ( 0.2%)
7 Flag.Description 1. Aggregate, may include of 3070 ( 8.4%) I 36449 0
[character] 2. Calculated data 13136 (36.0%) IIIIIII (100.0%) (0.0%)
3. Data not available 74 ( 0.2%)
4. FAO data based on imputat 2270 ( 6.2%) I
5. FAO estimate 7045 (19.3%) III
6. Official data 10044 (27.6%) IIIII
7. Unofficial figure 810 ( 2.2%)
---------------------------------------------------------------------------------------------------------------------------# finding count of distinct Areas and Area Years
count(distinct(FAO_Dairy_Clean, Area)) n
1 232count(distinct(FAO_Dairy_Clean, Area, Year)) n
1 12170# finding distinct Flags and showing that Aggregate counts are for continents/regions other than countries
distinct(FAO_Dairy_Clean, Flag) Flag
1 F
2 Fc
3
4 *
5 Im
6 M
7 Ahead(filter(FAO_Dairy_Clean, Flag == "A")) Area Element Year Unit Value Flag
1 World Milk Animals 1961 Head 177334557 A
2 World Production 1961 tonnes 313626619 A
3 World Milk Animals 1962 Head 176572244 A
4 World Production 1962 tonnes 316043684 A
5 World Milk Animals 1963 Head 177117785 A
6 World Production 1963 tonnes 312824366 A
Flag.Description
1 Aggregate, may include official, semi-official, estimated or calculated data
2 Aggregate, may include official, semi-official, estimated or calculated data
3 Aggregate, may include official, semi-official, estimated or calculated data
4 Aggregate, may include official, semi-official, estimated or calculated data
5 Aggregate, may include official, semi-official, estimated or calculated data
6 Aggregate, may include official, semi-official, estimated or calculated dataThis data set describes dairy production from 1961 to 2018 - specifically, whole milk production - by region.
Dairy production is quantified in three different ways: total milk production in tons, number of cows, and yield per cow.
There are 232 unique regions. These are mostly countries, but also include some broader regions like continents. These are flagged as aggregates in the data.
Altogether, there are 12170 unique Area-Years.
FAO_Dairy_Clean %>%
  filter(Area %in% c("Africa", "Europe", "Americas", "Asia")) %>%
  group_by(Area, Element) %>%
  summarize(Mean = mean(Value, na.rm = TRUE),
            Median = median(Value, na.rm = TRUE)) %>%
  pivot_wider(names_from = Element, values_from = c(Mean, Median))
# A tibble: 4 × 7
# Groups: Area [4]
Area `Mean_Milk Animals` Mean_Production Mean_Yi…¹ Media…² Media…³ Media…⁴
<chr> <dbl> <dbl> <dbl> <dbl> <dbl> <dbl>
1 Africa 37629052. 18949137. 4869. 3.32e7 1.51e7 4600
2 Americas 44335479. 123817831. 27492. 4.51e7 1.16e8 25327
3 Asia 64033326. 80628670. 11052. 5.66e7 5.55e7 9794
4 Europe 68487680. 228904979. 36916. 8.26e7 2.20e8 33152.
# … with abbreviated variable names ¹Mean_Yield, ²`Median_Milk Animals`,
# ³Median_Production, ⁴Median_YieldI have focused above on just the aggregated continents in the data set in order to do a comparison at the same region level. The data was grouped by continents and element, and the mean and median values of Animals, Production, and Yield were calculated for each continent over the entire time period.
As you can see, the number of dairy cows in Asia and Europe has been much greater on average.
However, it is notable that average production was more than 2x higher in Europe compared to Asia, suggesting that each cow is yielding much less milk in Asia.
Furthermore, the Americas have produced on average about 40 million more tons of milk than Asia despite have having fewer cows.
# How did production increase over time in Asia vs Europe

# creating a table with unique observations for each area-year
FAO_Dairy_Plot <- FAO_Dairy %>%
  select('Area', 'Element', 'Year', 'Value') %>%
  pivot_wider(names_from = 'Element', values_from = 'Value')

# creating table of asian production
Asiaproduction <- FAO_Dairy_Plot %>%
  select('Area', 'Year', 'Production') %>%
  filter(Area == "Asia")

# graphing asian milk production from 1961-2018
ggplot(data = Asiaproduction) +
  geom_line(mapping = aes(x = Year, y = Production))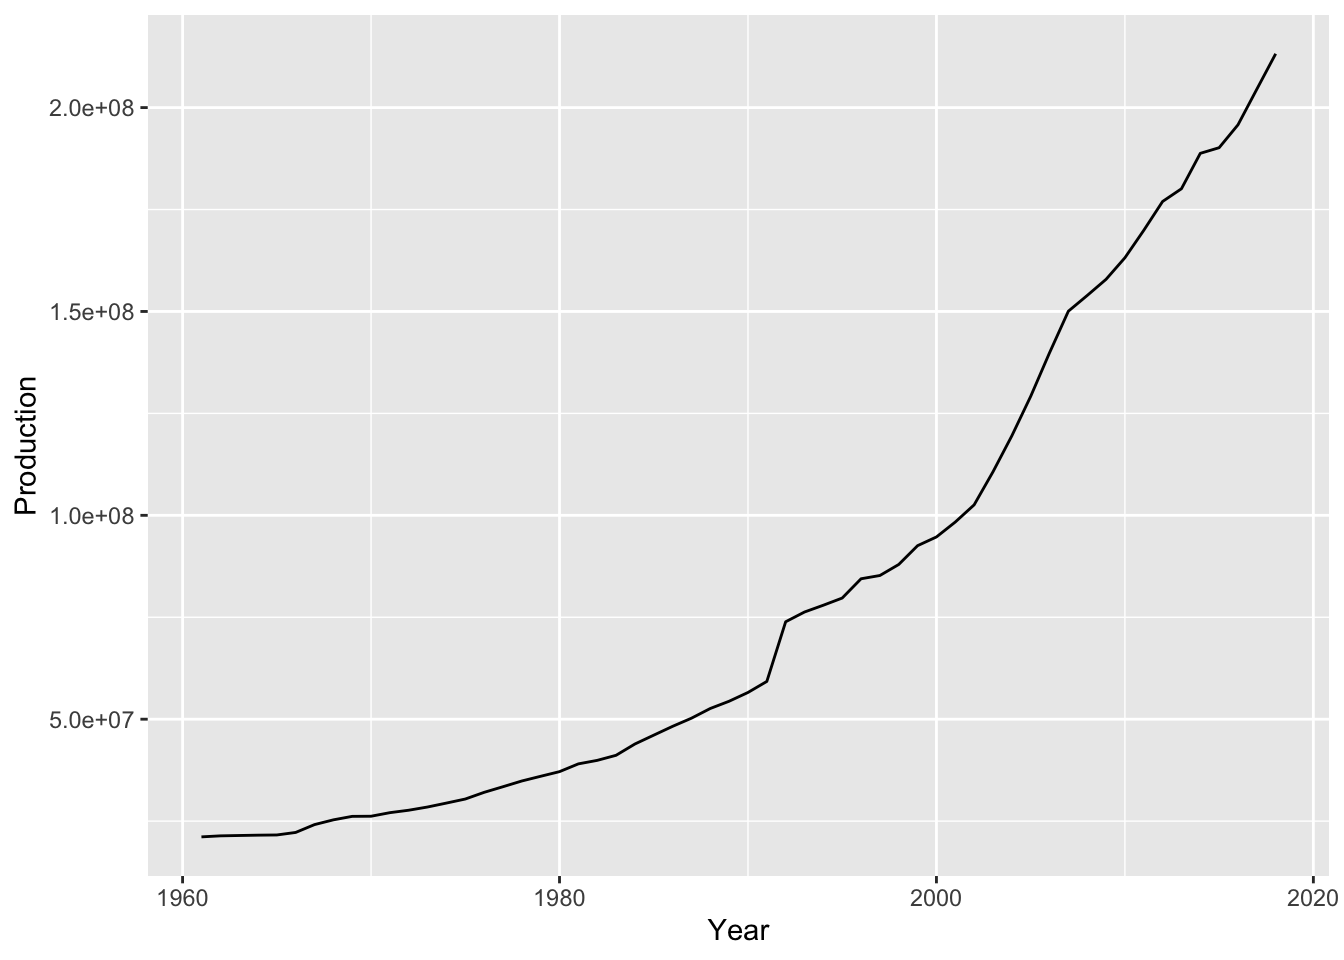
# creating table of European production
Europeproduction <- FAO_Dairy_Plot %>%
  select('Area', 'Year', 'Production') %>%
  filter(Area == "Europe")

# graphing European milk production from 1961-2018
ggplot(data = Europeproduction) +
  geom_line(mapping = aes(x = Year, y = Production))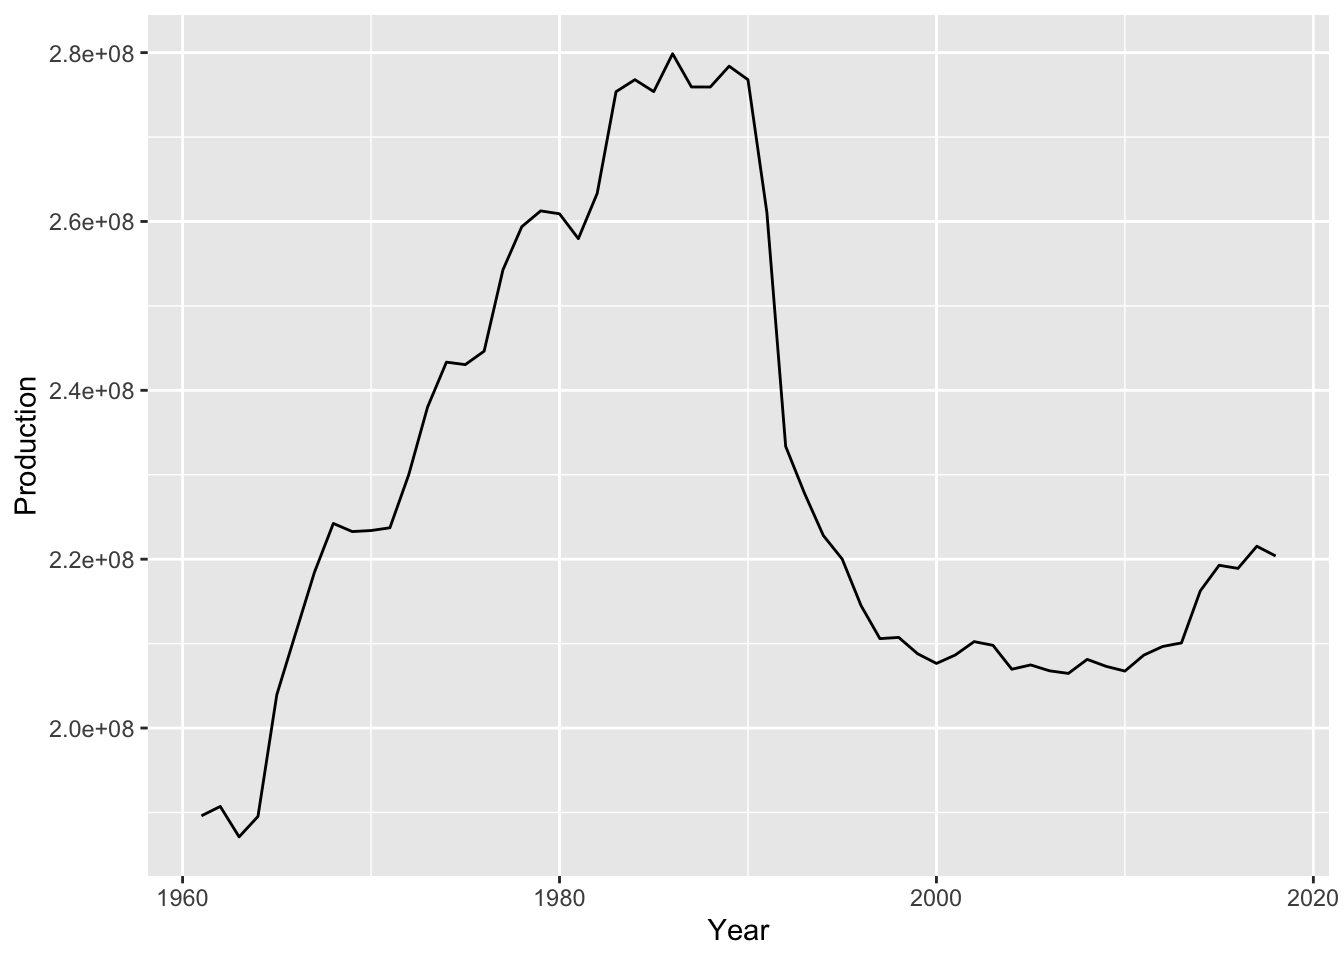
Next, I wanted to graph milk production of Asia and Europe to see how their milk production has trended over time. When we graph the results, it’s clear that the average values did not tell the whole story. Asia has had an steady exponential growth in milk production over time. Europe had steady growth in milk production from the early sixties until about 1990, when milk production plunged. This has only recovered slightly in recent years.