Challenge 6 Instructions

challenge_6
hotel_bookings
air_bnb
fed_rate
debt
usa_households
abc_poll
Visualizing Time and Relationships
Author

khadijat Adeleye

Published

April 16, 2023

library(tidyverse)
library(ggplot2)
library(lubridate)
library(dplyr)
library(lubridate)
install.packages("readxl")
Error in contrib.url(repos, "source"): trying to use CRAN without setting a mirror
knitr::opts_chunk$set(echo = TRUE, warning=FALSE, message=FALSE)
library(readxl)
Loan<- read_excel("_data/debt_in_trillions.xlsx")
head(Loan, 10)
# A tibble: 10 × 8
   `Year and Quarter` Mortgage HE Revolvin…¹ Auto …² Credi…³ Stude…⁴ Other Total
   <chr>                 <dbl>         <dbl>   <dbl>   <dbl>   <dbl> <dbl> <dbl>
 1 03:Q1                  4.94         0.242   0.641   0.688   0.241 0.478  7.23
 2 03:Q2                  5.08         0.26    0.622   0.693   0.243 0.486  7.38
 3 03:Q3                  5.18         0.269   0.684   0.693   0.249 0.477  7.56
 4 03:Q4                  5.66         0.302   0.704   0.698   0.253 0.449  8.07
 5 04:Q1                  5.84         0.328   0.72    0.695   0.260 0.446  8.29
 6 04:Q2                  5.97         0.367   0.743   0.697   0.263 0.423  8.46
 7 04:Q3                  6.21         0.426   0.751   0.706   0.33  0.41   8.83
 8 04:Q4                  6.36         0.468   0.728   0.717   0.346 0.423  9.04
 9 05:Q1                  6.51         0.502   0.725   0.71    0.364 0.394  9.21
10 05:Q2                  6.70         0.528   0.774   0.717   0.374 0.402  9.49
# … with abbreviated variable names ¹​`HE Revolving`, ²​`Auto Loan`,
#   ³​`Credit Card`, ⁴​`Student Loan`
summary(Loan)
 Year and Quarter      Mortgage       HE Revolving      Auto Loan     
 Length:74          Min.   : 4.942   Min.   :0.2420   Min.   :0.6220  
 Class :character   1st Qu.: 8.036   1st Qu.:0.4275   1st Qu.:0.7430  
 Mode  :character   Median : 8.412   Median :0.5165   Median :0.8145  
                    Mean   : 8.274   Mean   :0.5161   Mean   :0.9309  
                    3rd Qu.: 9.047   3rd Qu.:0.6172   3rd Qu.:1.1515  
                    Max.   :10.442   Max.   :0.7140   Max.   :1.4150  
  Credit Card      Student Loan        Other            Total       
 Min.   :0.6590   Min.   :0.2407   Min.   :0.2960   Min.   : 7.231  
 1st Qu.:0.6966   1st Qu.:0.5333   1st Qu.:0.3414   1st Qu.:11.311  
 Median :0.7375   Median :0.9088   Median :0.3921   Median :11.852  
 Mean   :0.7565   Mean   :0.9189   Mean   :0.3831   Mean   :11.779  
 3rd Qu.:0.8165   3rd Qu.:1.3022   3rd Qu.:0.4154   3rd Qu.:12.674  
 Max.   :0.9270   Max.   :1.5840   Max.   :0.4860   Max.   :14.957  
glimpse(Loan)
Rows: 74
Columns: 8
$ `Year and Quarter` <chr> "03:Q1", "03:Q2", "03:Q3", "03:Q4", "04:Q1", "04:Q2…
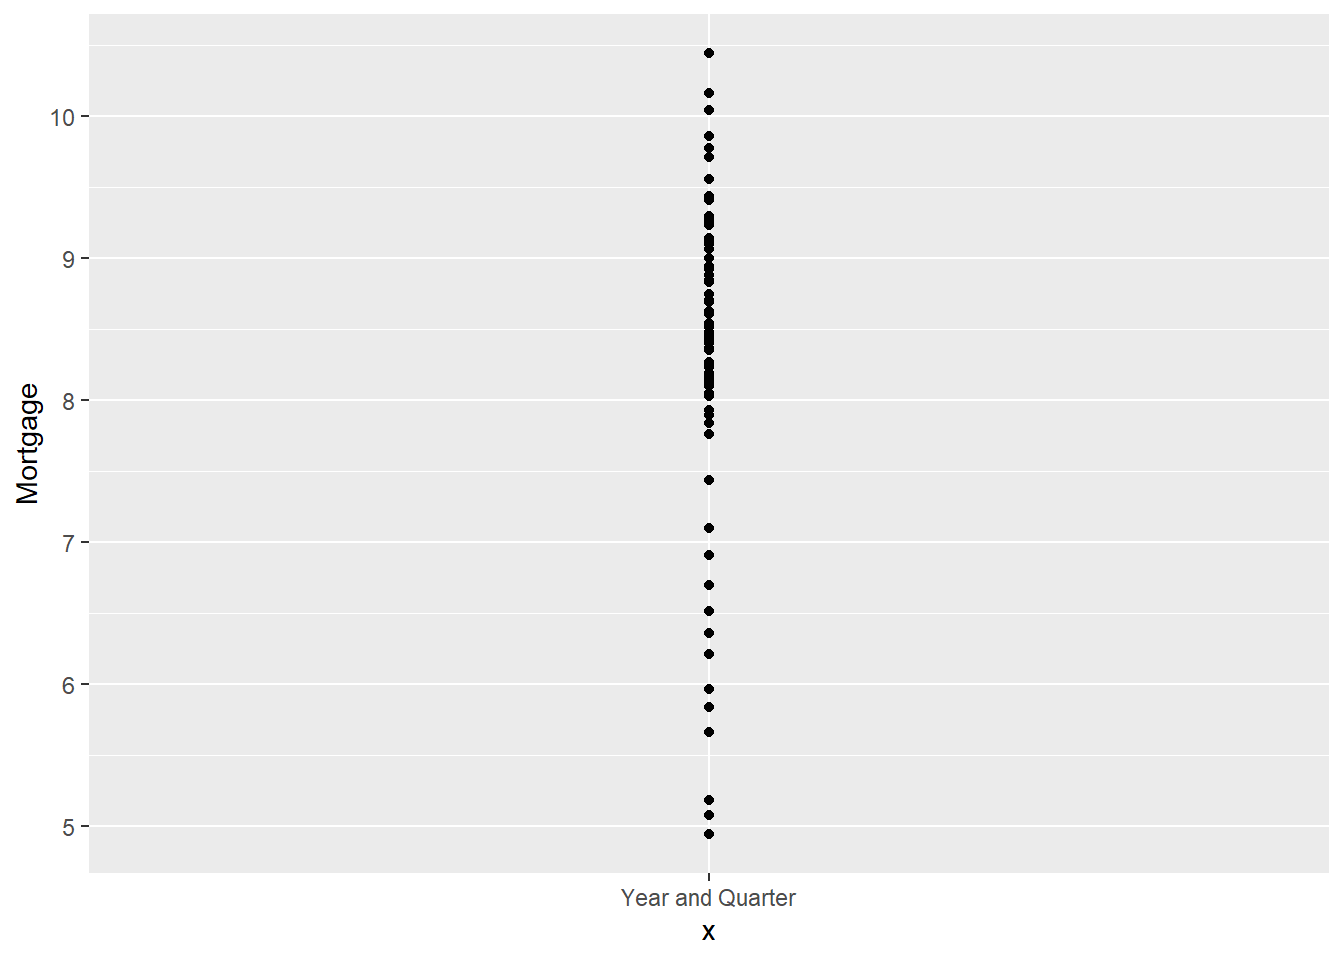
$ Mortgage           <dbl> 4.942, 5.080, 5.183, 5.660, 5.840, 5.967, 6.210, 6.…
$ `HE Revolving`     <dbl> 0.242, 0.260, 0.269, 0.302, 0.328, 0.367, 0.426, 0.…
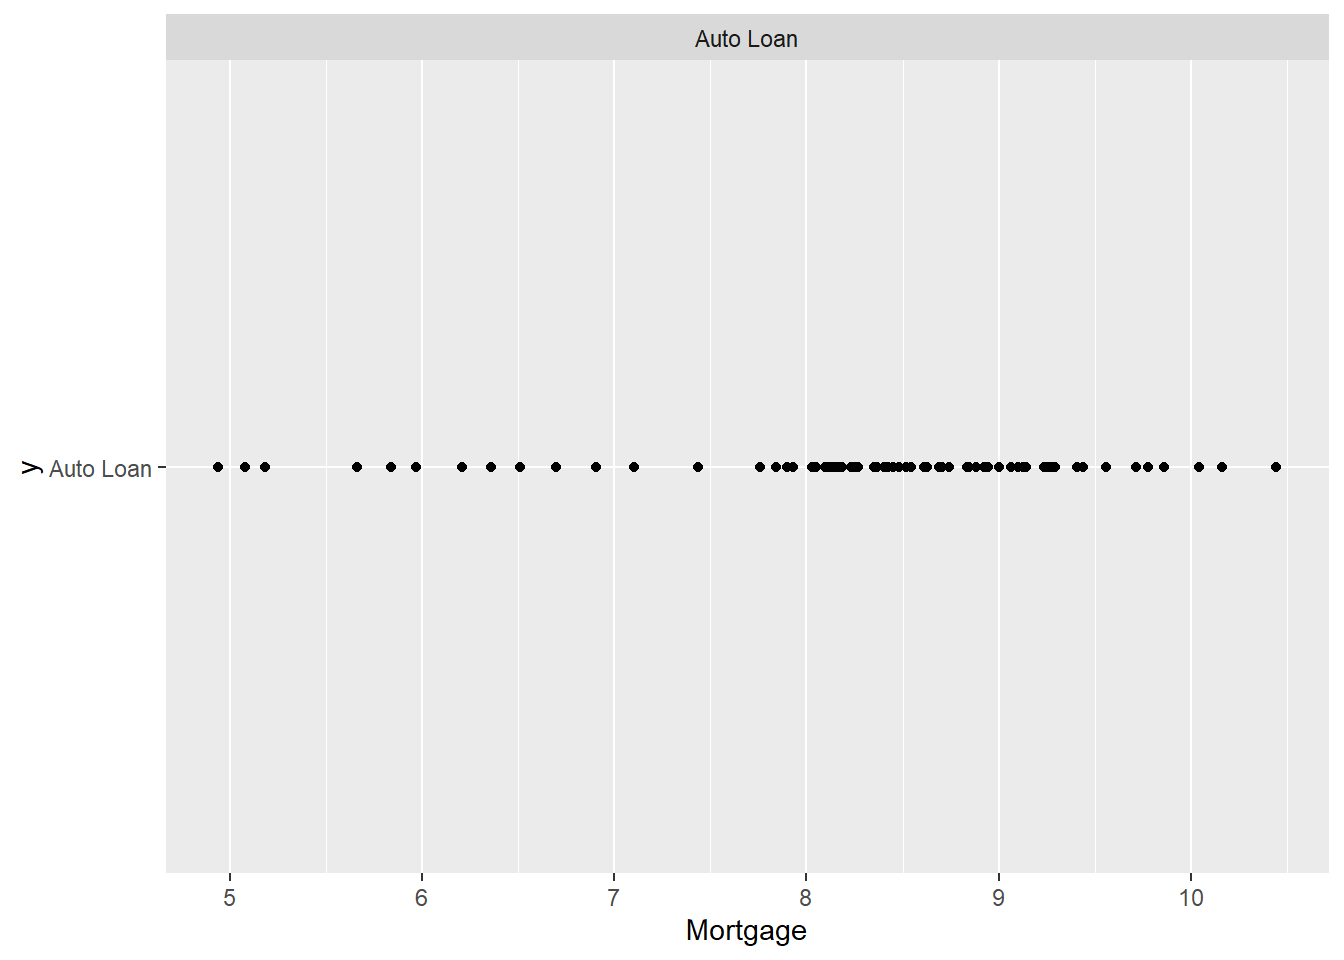
$ `Auto Loan`        <dbl> 0.641, 0.622, 0.684, 0.704, 0.720, 0.743, 0.751, 0.…
$ `Credit Card`      <dbl> 0.688, 0.693, 0.693, 0.698, 0.695, 0.697, 0.706, 0.…
$ `Student Loan`     <dbl> 0.2407000, 0.2429000, 0.2488000, 0.2529000, 0.25980…
$ Other              <dbl> 0.4776, 0.4860, 0.4773, 0.4486, 0.4465, 0.4231, 0.4…
$ Total              <dbl> 7.2313, 7.3839, 7.5551, 8.0655, 8.2893, 8.4600, 8.8…

tidy dataset

Loan <- df %>%
  mutate(date = parse_date_time(`Year and Quarter`, 
                           orders="yq")) %>%
  select(date,everything())
Error in UseMethod("mutate"): no applicable method for 'mutate' applied to an object of class "function"
  print(Loan)
# A tibble: 74 × 8
   `Year and Quarter` Mortgage HE Revolvin…¹ Auto …² Credi…³ Stude…⁴ Other Total
   <chr>                 <dbl>         <dbl>   <dbl>   <dbl>   <dbl> <dbl> <dbl>
 1 03:Q1                  4.94         0.242   0.641   0.688   0.241 0.478  7.23
 2 03:Q2                  5.08         0.26    0.622   0.693   0.243 0.486  7.38
 3 03:Q3                  5.18         0.269   0.684   0.693   0.249 0.477  7.56
 4 03:Q4                  5.66         0.302   0.704   0.698   0.253 0.449  8.07
 5 04:Q1                  5.84         0.328   0.72    0.695   0.260 0.446  8.29
 6 04:Q2                  5.97         0.367   0.743   0.697   0.263 0.423  8.46
 7 04:Q3                  6.21         0.426   0.751   0.706   0.33  0.41   8.83
 8 04:Q4                  6.36         0.468   0.728   0.717   0.346 0.423  9.04
 9 05:Q1                  6.51         0.502   0.725   0.71    0.364 0.394  9.21
10 05:Q2                  6.70         0.528   0.774   0.717   0.374 0.402  9.49
# … with 64 more rows, and abbreviated variable names ¹​`HE Revolving`,
#   ²​`Auto Loan`, ³​`Credit Card`, ⁴​`Student Loan`
Loan %>%
  ggplot(aes(Mortgage,"Auto Loan",))+
  geom_point()+
  facet_wrap(vars("Auto Loan"))

###creating line and point plots for Student loan
Loan %>% ggplot(aes(x = "Year and Quarter",y = "Student Loan",)) + geom_line()+
          geom_point()+
          labs(title= "Total Debt by Quarter", y= "Total Debt (in trillions)", x= "Fiscal Quarter")+
          theme_bw()

Time Dependent Visualization

I want to visualize the mortgage trend.

Loan %>%
  ggplot(aes("Year and Quarter", Mortgage))+
  geom_point()

##Visualizing Part-Whole Relationships

Visualize the rate of Mortgage per year

bar_Loan <- df %>%
  ggplot(mapping = aes(x = `Year and Quarter`, fill =Mortgage),position = "fill") + 
  geom_bar()+
   labs(x="Year and Quarter",y="Mortgage", title = "Mortgage per year") 
Error in `ggplot()`:
! `data` cannot be a function.
ℹ Have you misspelled the `data` argument in `ggplot()`
bar_Loan
Error in eval(expr, envir, enclos): object 'bar_Loan' not found