Code
library(tidyverse)

knitr::opts_chunk$set(echo = TRUE)
install.packages(summarytools)
Error in install.packages(summarytools): object 'summarytools' not foundCode
library(summarytools)library(tidyverse)
knitr::opts_chunk$set(echo = TRUE)
install.packages(summarytools)Error in install.packages(summarytools): object 'summarytools' not foundlibrary(summarytools)library(readr)
birds <- read_csv ("C:/Users/CarlinML/DACSS-601/601_Spring_2023/posts/_data/birds.csv")Rows: 30977 Columns: 14
── Column specification ────────────────────────────────────────────────────────
Delimiter: ","
chr (8): Domain Code, Domain, Area, Element, Item, Unit, Flag, Flag Description
dbl (6): Area Code, Element Code, Item Code, Year Code, Year, Value
ℹ Use `spec()` to retrieve the full column specification for this data.
ℹ Specify the column types or set `show_col_types = FALSE` to quiet this message.View(birds)str(birds)spc_tbl_ [30,977 × 14] (S3: spec_tbl_df/tbl_df/tbl/data.frame)
$ Domain Code : chr [1:30977] "QA" "QA" "QA" "QA" ...
$ Domain : chr [1:30977] "Live Animals" "Live Animals" "Live Animals" "Live Animals" ...
$ Area Code : num [1:30977] 2 2 2 2 2 2 2 2 2 2 ...
$ Area : chr [1:30977] "Afghanistan" "Afghanistan" "Afghanistan" "Afghanistan" ...
$ Element Code : num [1:30977] 5112 5112 5112 5112 5112 ...
$ Element : chr [1:30977] "Stocks" "Stocks" "Stocks" "Stocks" ...
$ Item Code : num [1:30977] 1057 1057 1057 1057 1057 ...
$ Item : chr [1:30977] "Chickens" "Chickens" "Chickens" "Chickens" ...
$ Year Code : num [1:30977] 1961 1962 1963 1964 1965 ...
$ Year : num [1:30977] 1961 1962 1963 1964 1965 ...
$ Unit : chr [1:30977] "1000 Head" "1000 Head" "1000 Head" "1000 Head" ...
$ Value : num [1:30977] 4700 4900 5000 5300 5500 5800 6600 6290 6300 6000 ...
$ Flag : chr [1:30977] "F" "F" "F" "F" ...
$ Flag Description: chr [1:30977] "FAO estimate" "FAO estimate" "FAO estimate" "FAO estimate" ...
- attr(*, "spec")=
.. cols(
.. `Domain Code` = col_character(),
.. Domain = col_character(),
.. `Area Code` = col_double(),
.. Area = col_character(),
.. `Element Code` = col_double(),
.. Element = col_character(),
.. `Item Code` = col_double(),
.. Item = col_character(),
.. `Year Code` = col_double(),
.. Year = col_double(),
.. Unit = col_character(),
.. Value = col_double(),
.. Flag = col_character(),
.. `Flag Description` = col_character()
.. )
- attr(*, "problems")=<externalptr> view(dfSummary(birds))Switching method to 'browser'Output file written: C:\Users\CarlinML\AppData\Local\Temp\Rtmpw9NrTb\file36a06bdb2410.htmlbirds%>%
select(Item)%>%
n_distinct(.)[1] 5table(select(birds, Item))Item
Chickens Ducks Geese and guinea fowls
13074 6909 4136
Pigeons, other birds Turkeys
1165 5693 birds<-birds%>%
mutate(Decade = case_when(
Year >= 1960 & Year < 1970 ~ "1960s",
Year >= 1970 & Year < 1980 ~ "1970s",
Year >= 1980 & Year < 1990 ~ "1980s",
Year >= 1990 & Year < 2000 ~ "1990s",
Year >= 2000 & Year < 2010 ~ "2000s",
Year >= 2010 ~ "2010s")
)
table(select(birds, Decade))Decade
1960s 1970s 1980s 1990s 2000s 2010s
4449 4982 4988 5613 5754 5191 xtabs(~ Decade + Item, birds) Item
Decade Chickens Ducks Geese and guinea fowls Pigeons, other birds Turkeys
1960s 1921 1000 586 171 771
1970s 2140 1120 657 190 875
1980s 2145 1102 652 195 894
1990s 2326 1255 759 210 1063
2000s 2384 1280 780 210 1100
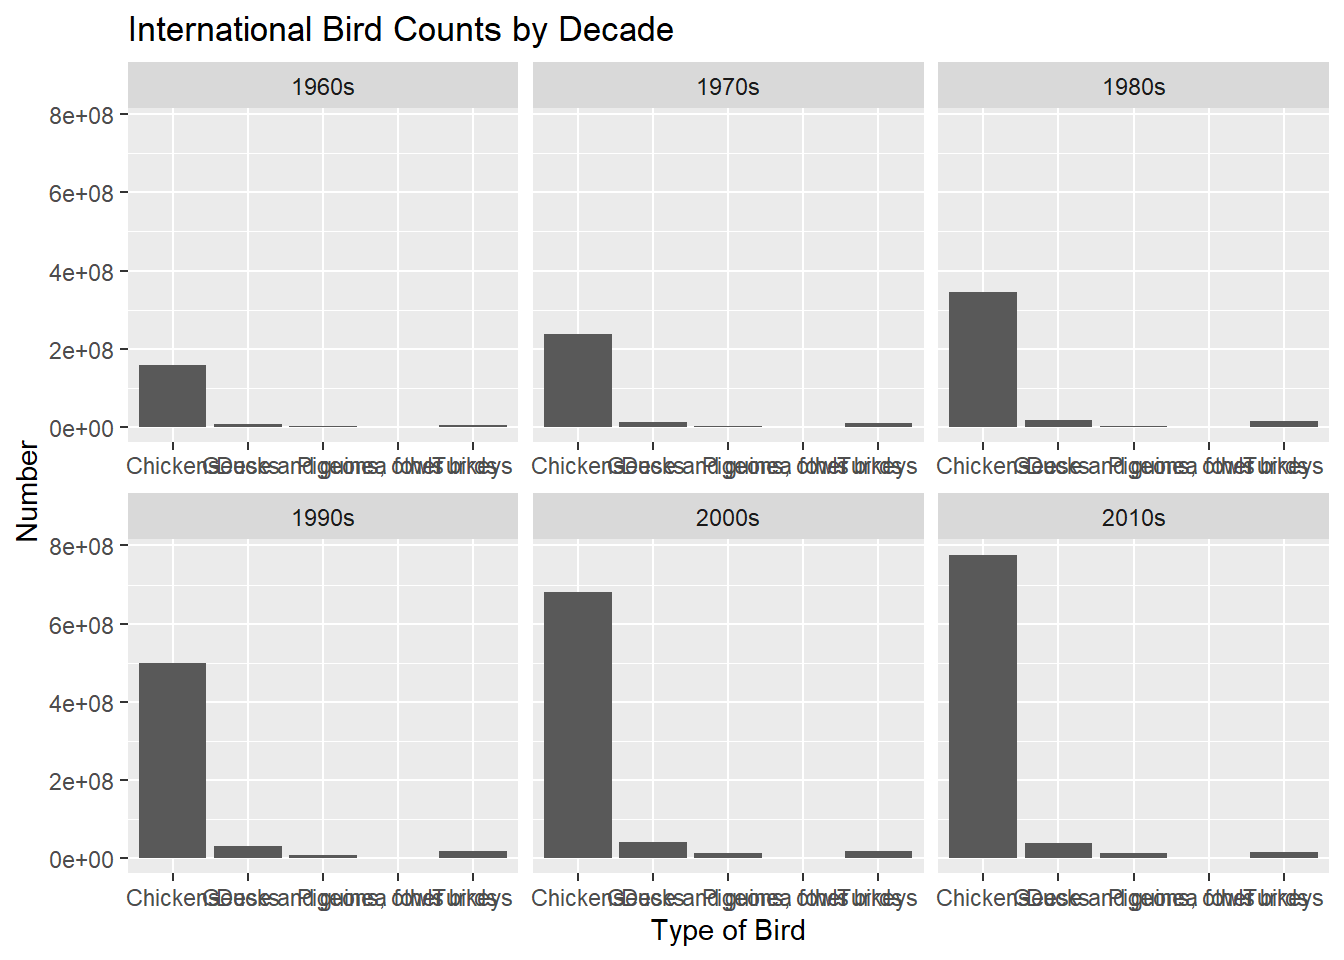
2010s 2158 1152 702 189 990 ggplot(birds, aes(x=Item, y=Value)) +
geom_col()+
facet_wrap(vars(Decade), scales = "free_x") +
labs(title = "International Bird Counts by Decade", y = "Number", x = "Type of Bird")Warning: Removed 1036 rows containing missing values (`position_stack()`).