Code
library(tidyverse)
library(summarytools)
library(dbplyr)
library(readr)
library(forcats)

knitr::opts_chunk$set(echo = TRUE)library(tidyverse)
library(summarytools)
library(dbplyr)
library(readr)
library(forcats)
knitr::opts_chunk$set(echo = TRUE)Read in and view summary of ‘AB_NYC_2019’ dataset
AB_NYC <- read_csv ("_data/AB_NYC_2019.csv")Rows: 48895 Columns: 16
── Column specification ────────────────────────────────────────────────────────
Delimiter: ","
chr (5): name, host_name, neighbourhood_group, neighbourhood, room_type
dbl (10): id, host_id, latitude, longitude, price, minimum_nights, number_o...
date (1): last_review
ℹ Use `spec()` to retrieve the full column specification for this data.
ℹ Specify the column types or set `show_col_types = FALSE` to quiet this message.View(AB_NYC)
view(dfSummary(AB_NYC))Switching method to 'browser'
Output file written: C:\Users\CarlinML\AppData\Local\Temp\RtmpsRk2DP\file54a44f12598d.htmlThis dataset contains 48895 rows and 16 columns. Each row/observation contains information on Airbnb rentals in NYC during 2019, including the type of rental (e.g., entire home, private room, shared room), the NYC borough, the price, minimum number of nights, and number of reviews.
Per the data frame summary, the price variable contains some $0’s; sort dataframe to review before recoding.
AB_NYC <- AB_NYC[order(AB_NYC$price),]Recode price=$0 to NA.
AB_NYC <- AB_NYC %>%
  mutate_at(c("price"), ~ na_if(., 0))

AB_NYC <- AB_NYC[order(AB_NYC$price, na.last=FALSE),]
Recode ‘price’ variable into new ‘price_range’ variable.
AB_NYC <- AB_NYC %>%
  mutate(price_range = case_when(
         price < 100 ~ "less than $100",
         price >= 100 & price < 250 ~ "$100 - $249",
         price >= 250 & price < 500 ~ "$250 - $499",
         price >= 500 & price < 750 ~ "$500 - $749",
         price >= 750 & price < 1000 ~ "$750 - $999",
         price >= 1000 ~ "$1000 or more")
  )
AB_NYC %>% count(price_range)
# A tibble: 7 × 2
price_range n
<chr> <int>
1 $100 - $249 20792
2 $1000 or more 298
3 $250 - $499 4991
4 $500 - $749 682
5 $750 - $999 255
6 less than $100 21866
7 <NA> 11Determine the values associated with each price range category.
unique(AB_NYC$price_range) [1] NA "less than $100" "$100 - $249" "$250 - $499"
[5] "$500 - $749" "$750 - $999" "$1000 or more" Specify the factor order. Can’t get factor levels to work…(why are they showing in correct order above all of a sudden, but weren’t before when I ran this over and over?).
AB_NYC<-AB_NYC%>%
  mutate(price_range_ordered = factor(price,
                       levels = price_range[c(2,3,4,5,6)]))

AB_NYC %>%
  filter (!is.na(price_range)) %>%
 ggplot(aes(x=price_range)) +
   geom_bar(position = "dodge",
           stat = "count", fill="purple", colour="black")+
   labs(title = "Frequency of Various Price Ranges", y = "Frequency", x = "Price Range")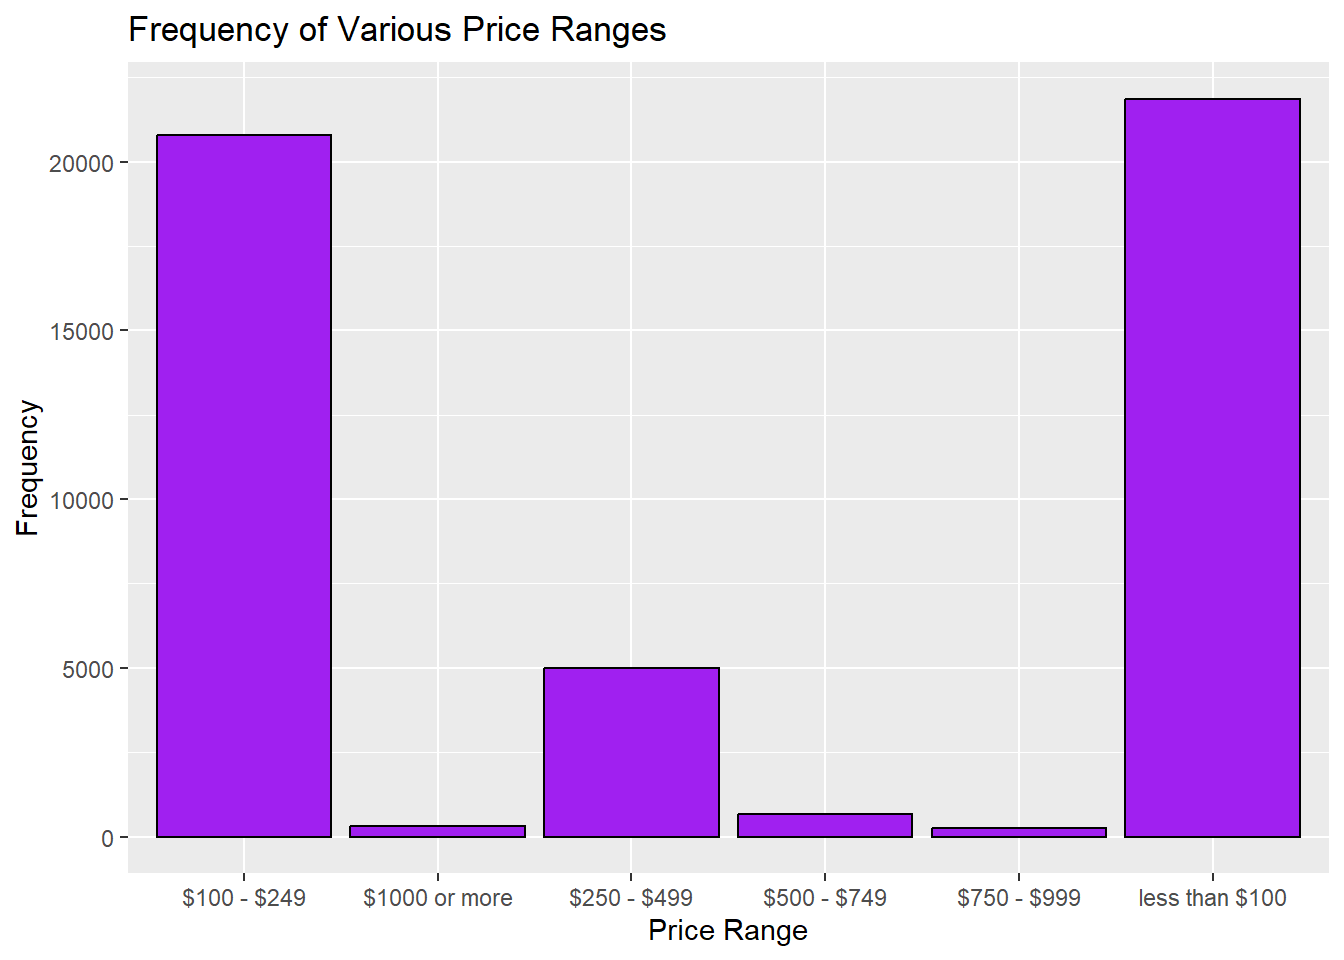
Create ggplot of rentals by NYC Borough, order bars from highest to lowest value.
AB_NYC %>%
 ggplot(aes(x=fct_infreq(neighbourhood_group))) +
   geom_bar(stat = "count", fill="blue", colour="black")+
   labs(title = "AirBnB Rentals by NYC Borough", y = "Frequency", x = "NYC Borough")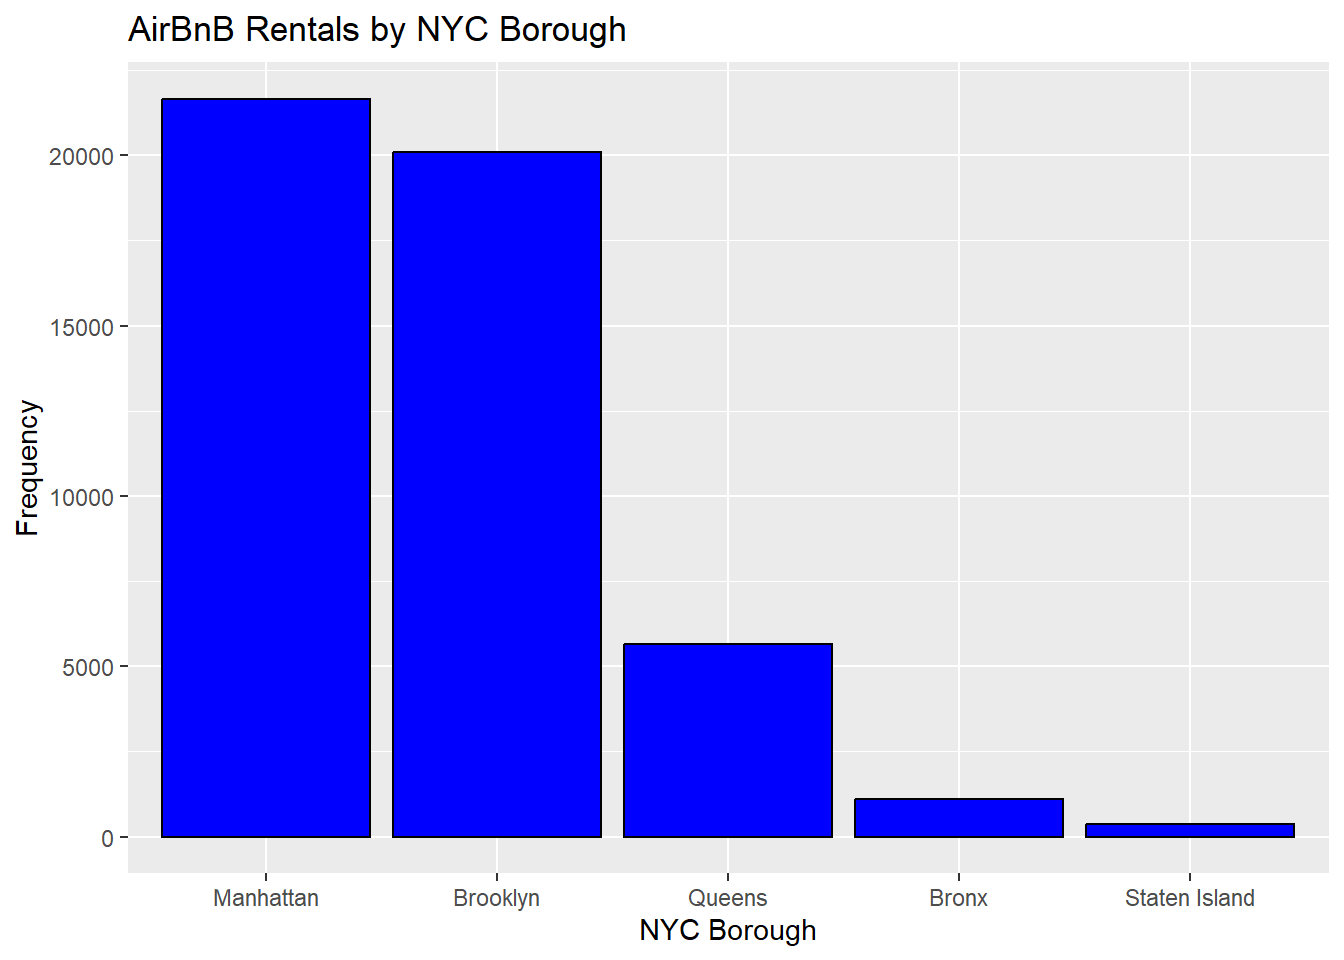
Create crosstab of neighbourhood by price_range.
xtabs(~ neighbourhood_group + price_range, AB_NYC) price_range
neighbourhood_group $100 - $249 $1000 or more $250 - $499 $500 - $749
Bronx 229 2 30 6
Brooklyn 7677 67 1244 158
Manhattan 11234 213 3486 498
Queens 1548 13 217 18
Staten Island 104 3 14 2
price_range
neighbourhood_group $750 - $999 less than $100
Bronx 1 822
Brooklyn 54 10895
Manhattan 194 6035
Queens 5 3865
Staten Island 1 249Calculate min/max/mean price (price) and group data by neighbourhood_group and room_type.
GrpByNeighborhoodRoom <- AB_NYC %>%
    group_by(neighbourhood_group) %>%
    summarise(minADR = min(price, na.rm = TRUE), maxADR = max(price, na.rm = TRUE), meanADR = mean(price, na.rm = TRUE))
head(GrpByNeighborhoodRoom)
# A tibble: 5 × 4
neighbourhood_group minADR maxADR meanADR
<chr> <dbl> <dbl> <dbl>
1 Bronx 10 2500 87.6
2 Brooklyn 10 10000 124.
3 Manhattan 10 10000 197.
4 Queens 10 10000 99.5
5 Staten Island 13 5000 115. AB_NYC %>%
ggplot(aes(x=neighbourhood_group, y=price)) +
geom_bar(position = "dodge",fill="pink", colour="black",
stat = "summary",
fun = "mean")+
labs(title = "Average AirBnB Nightly Cost by NYC Borough", y = "Average Nighyly Cost", x = "NYC Borough")Warning: Removed 11 rows containing non-finite values (`stat_summary()`).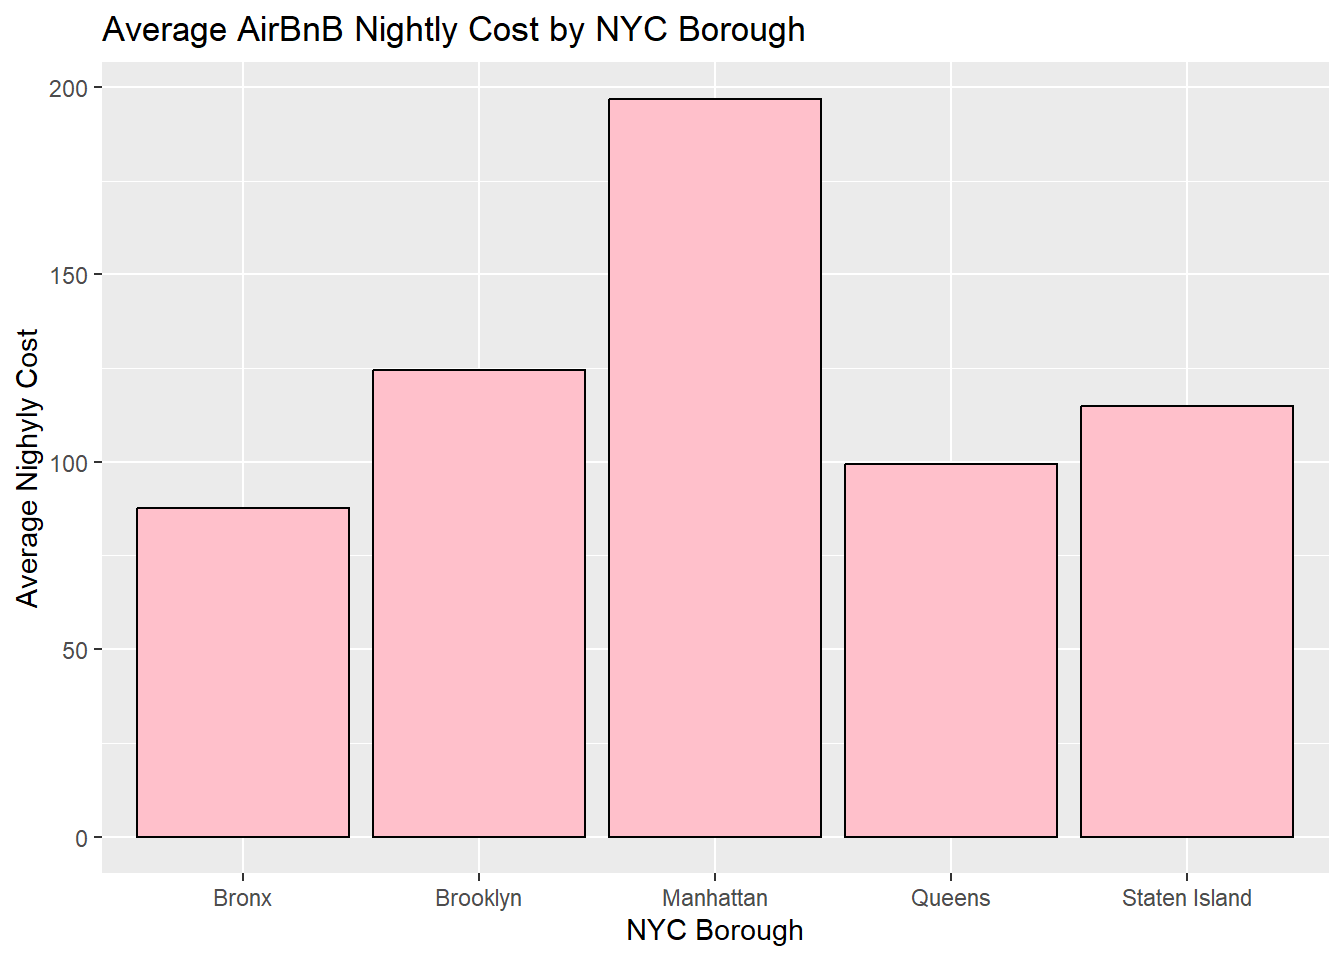
GrpByNeighborhoodRoom <- AB_NYC %>%
    group_by(neighbourhood_group, room_type) %>%
    summarise(minADR = min(price, na.rm = TRUE), maxADR = max(price, na.rm = TRUE), meanADR = mean(price, na.rm = TRUE))
`summarise()` has grouped output by 'neighbourhood_group'. You can override
using the `.groups` argument.head(GrpByNeighborhoodRoom)# A tibble: 6 × 5
# Groups: neighbourhood_group [2]
neighbourhood_group room_type minADR maxADR meanADR
<chr> <chr> <dbl> <dbl> <dbl>
1 Bronx Entire home/apt 28 1000 128.
2 Bronx Private room 10 2500 66.9
3 Bronx Shared room 20 800 59.8
4 Brooklyn Entire home/apt 10 10000 178.
5 Brooklyn Private room 10 7500 76.5
6 Brooklyn Shared room 15 725 50.8tail(GrpByNeighborhoodRoom)# A tibble: 6 × 5
# Groups: neighbourhood_group [2]
neighbourhood_group room_type minADR maxADR meanADR
<chr> <chr> <dbl> <dbl> <dbl>
1 Queens Entire home/apt 10 2600 147.
2 Queens Private room 10 10000 71.8
3 Queens Shared room 11 1800 69.0
4 Staten Island Entire home/apt 48 5000 174.
5 Staten Island Private room 20 300 62.3
6 Staten Island Shared room 13 150 57.4AB_NYC %>%
ggplot(aes(x=neighbourhood_group, y=price, fill=room_type)) +
geom_bar(position = "dodge",
stat = "summary",
fun = "mean")+
facet_wrap(vars(room_type), scales = "free_x") +
scale_fill_manual(values=c("green","orange","blue"))+
theme(legend.position="none")+
scale_x_discrete(guide = guide_axis(n.dodge=2))+
labs(title = "Average AirBnB Nightly Cost by NYC Borough and Room Type", y = "Average Nightly Cost", x = "NYC Borough")Warning: Removed 11 rows containing non-finite values (`stat_summary()`).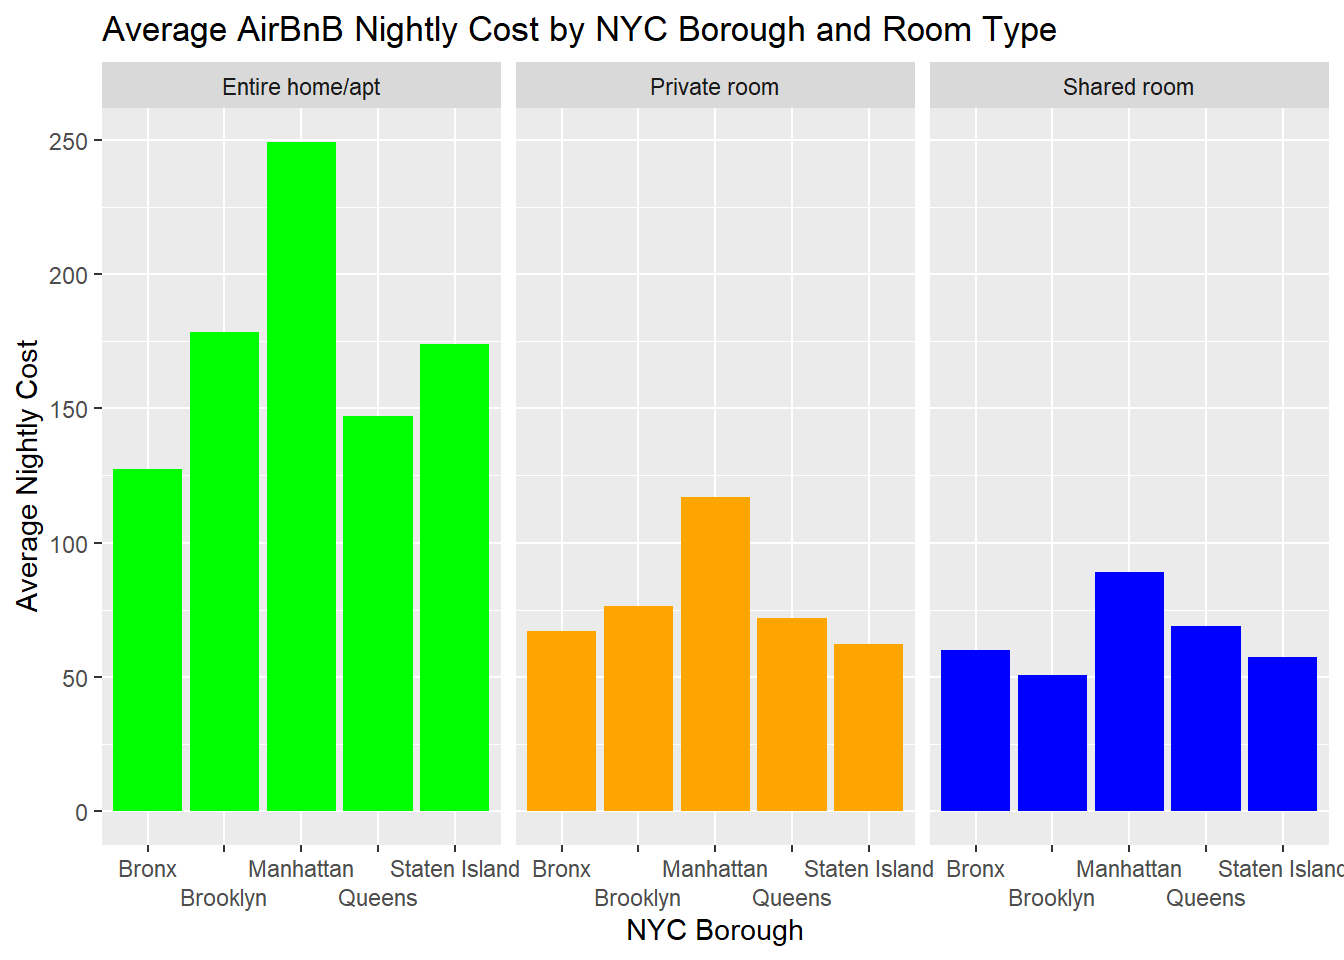
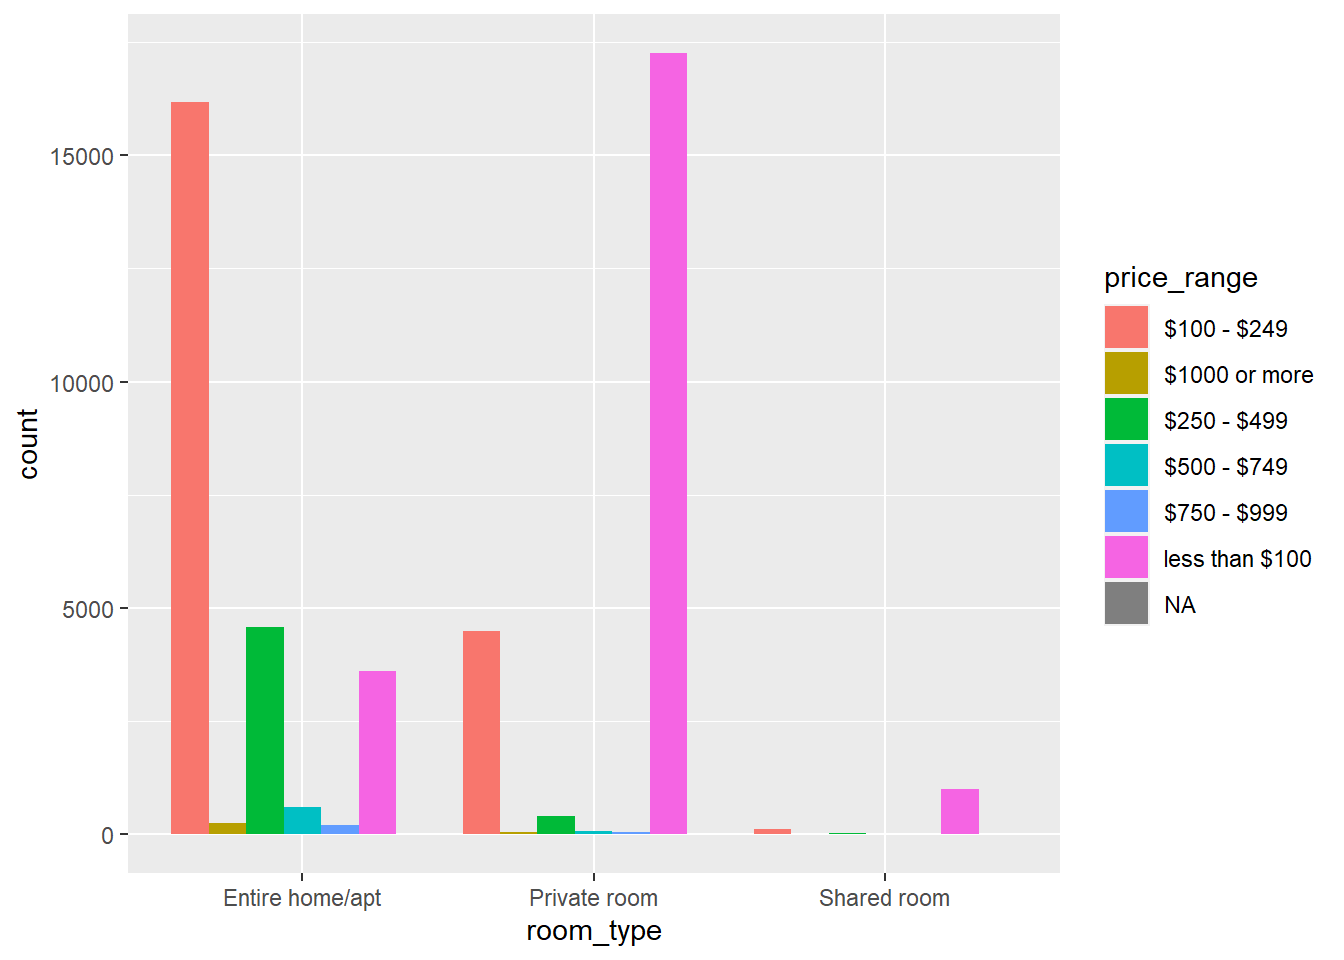
AB_NYC %>%
  ggplot(aes(fill=price_range, x=room_type)) +
    geom_bar(position="dodge", stat="count")