library(tidyverse)
library(readr)
library(ggplot2)

knitr::opts_chunk$set(echo = TRUE, warning=FALSE, message=FALSE)Final Project Assignment: Nanci Kopecky
final_Project_assignment
Boston 311 Service Requests for 2023
Introduction
The topic is Boston city services. This project will examine Boston’s non-emergency service requests in the data set, 311 Service Requests. Exploring this data has the potential to offer insight to city planners to be more efficient and better meet citizens’ expectations. Boston collects 311 Service Requests data using technology, a system called Boston 311. The data is posted on the website Analyze Boston, data.boston.gov. What is being looked at in this project is how Boston 311 can benefit the greater good through effective city planning.
Background
In response to cities facing increasing demands and changing expectations,Boston 311 was launched in 2015 by Mayor Walsh. It is a system where city employees and residents can submit requests through an app, phone call, or online. Boston 311 is continuely updated and highly utilized. Mayor Wu recently announced that requests can now be made in 11 languages. This technology is proven to engage citizens with over 100,000 requests so far for 2023!
Data Set Introduction
To date, 311 Service Requests has 104,934 requests, where as, in April there were 79,930. This data is read in with a URL so requests are updated every time the code is run. Each row represents a request; there today there are 104,934 rows. There are 29 columns. Each column contains detailed information about the request that includes the description, time, date, location, the department/domain responsible, and submisstion source. Requests are generally about maintenance, repair, cleaning, and policy.
Data Set Description
The numerical variables are case_enquiry_id, fire_district and police_district, and services_district, but have no numerical meaning because they are identifying/naming information. The character or categorical variables provide information on: case status with open, target, and close dates; descriptions including the title, reason, and type; the department subject; location information with the address, fire, city council and police districts, and latitude and longitude coordinates; and source which detial who and how the submission was made.
Boston311 <- read.csv(url("https://data.boston.gov/dataset/8048697b-ad64-4bfc-b090-ee00169f2323/resource/e6013a93-1321-4f2a-bf91-8d8a02f1e62f/download/tmpo8qm0oqd.csv"))
Bos311 <- as.data.frame.matrix(Boston311)
head(Bos311)dim(Bos311)[1] 104934 29#Structure of the Data.
str(Bos311)'data.frame': 104934 obs. of 29 variables:
$ case_enquiry_id : num 1.01e+11 1.01e+11 1.01e+11 1.01e+11 1.01e+11 ...
$ open_dt : chr "2023-03-04 11:21:00" "2023-02-14 10:35:00" "2023-01-17 16:46:00" "2023-02-16 07:22:00" ...
$ target_dt : chr "2023-03-05 11:21:36" "" "2023-02-16 16:46:53" "2023-02-24 08:30:00" ...
$ closed_dt : chr "" "" "" "" ...
$ ontime : chr "OVERDUE" "ONTIME" "OVERDUE" "OVERDUE" ...
$ case_status : chr "Open" "Open" "Open" "Open" ...
$ closure_reason : chr " " " " " " " " ...
$ case_title : chr "Traffic Signal Inspection" "Park Improvement: Boston Common - BPRD" "DSP1/18Heat - Excessive Insufficient" "Ground Maintenance" ...
$ subject : chr "Transportation - Traffic Division" "Parks & Recreation Department" "Inspectional Services" "Parks & Recreation Department" ...
$ reason : chr "Signs & Signals" "Park Maintenance & Safety" "Housing" "Park Maintenance & Safety" ...
$ type : chr "Traffic Signal Inspection" "Park Improvement Requests" "Heat - Excessive Insufficient" "Ground Maintenance" ...
$ queue : chr "BTDT_Sign Repair" "PARK_Park Improvement Requests" "ISD_Housing (INTERNAL)" "ONS_General" ...
$ department : chr "BTDT" "PARK" "ISD" "ONS_" ...
$ submittedphoto : chr "" "" "" "" ...
$ closedphoto : chr "" "" "" "" ...
$ location : chr "190 Pier 4 Blvd Boston MA 02210" " " "28 Elmdale St Dorchester MA 02122" "444 Harrison Ave Roxbury MA 02118" ...
$ fire_district : int 6 NA 8 4 NA NA 7 9 3 7 ...
$ pwd_district : chr "05" " " "07" "1C" ...
$ city_council_district : int 2 NA 3 2 NA NA 7 7 1 3 ...
$ police_district : chr "C6" " " "C11" "D4" ...
$ neighborhood : chr "Boston" " " "Dorchester" "Roxbury" ...
$ neighborhood_services_district: int 5 NA 7 4 NA NA 13 13 3 7 ...
$ ward : chr "06" " " "Ward 16" "03" ...
$ precinct : chr "0601" " " "1605" "0307" ...
$ location_street_name : chr "190 Pier 4 Blvd" "" "28 Elmdale St" "444 Harrison Ave" ...
$ location_zipcode : int 2210 NA 2122 2118 NA NA 2125 2119 2108 2125 ...
$ latitude : num 42.4 42.4 42.3 42.3 42.4 ...
$ longitude : num -71.1 -71.1 -71.1 -71.1 -71.1 ...
$ source : chr "Constituent Call" "Constituent Call" "Constituent Call" "Citizens Connect App" ...#How many *reasons*?
unique(Bos311$reason) [1] "Signs & Signals" "Park Maintenance & Safety"
[3] "Housing" "Employee & General Comments"
[5] "Building" "Notification"
[7] "Needle Program" "Highway Maintenance"
[9] "Graffiti" "Enforcement & Abandoned Vehicles"
[11] "Trees" "Sanitation"
[13] "Recycling" "Street Lights"
[15] "Code Enforcement" "Street Cleaning"
[17] "Health" "Sidewalk Cover / Manhole"
[19] "Animal Issues" "Traffic Management & Engineering"
[21] "Environmental Services" "Generic Noise Disturbance"
[23] "Administrative & General Requests" "Noise Disturbance"
[25] "Abandoned Bicycle" "Weights and Measures"
[27] "Boston Bikes" "Catchbasin"
[29] "Pothole" "Operations"
[31] "Fire Hydrant" "Air Pollution Control"
[33] "Office of The Parking Clerk" "Programs"
[35] "Cemetery" "Neighborhood Services Issues"
[37] "Alert Boston" "Bridge Maintenance"
[39] "Massport" "MBTA"
[41] "Parking Complaints" "Valet"
[43] "Billing" Analysis Plan
Questions that can potentially inform city planners on efficiency are: Which departments receive the most requests? Which departments and neighborhoods have the most overdue requests? What is the most common source/what format most requests are made, i.e., phone, app, or other? Diving into this data set can help planners allocate appropriate resources and develop individualized plans for neighborhoods and departments.
Frequency and proportion tables and bar charts will be used to begin to answer these questions. The variables that will be used are subject (department), ontime, neighborhood, and source.
Descriptive Statistics
Frequencies and percentages will summarize the categorical data, subject (department), ontime, neighborhood, and source.
#Requests by Department
By_Department <- table(Bos311$subject)
cbind(By_Department, prop.table(By_Department)*100)
By_Department
Animal Control 1353 1.28938190
Boston Police Department 301 0.28684697
Boston Water & Sewer Commission 442 0.42121715
Inspectional Services 6343 6.04475194
Mayor's 24 Hour Hotline 3682 3.50887224
Neighborhood Services 13 0.01238874
Parks & Recreation Department 5020 4.78395944
Property Management 797 0.75952503
Public Works Department 59499 56.70135514
Transportation - Traffic Division 27484 26.19170145#On-Time and Overdue Requests
By_Completion_Status <- table(Bos311$ontime)
cbind(By_Completion_Status, prop.table(By_Completion_Status)*100) By_Completion_Status
ONTIME 87384 83.2752
OVERDUE 17550 16.7248# Tidy Data
## Removing the rows with missing values and outliers for neighborhood and source. Chestnut Hill and Maximo Integration are outliers with only 1 submitted request each.
Bos311_Neighbor <- Bos311[!(is.na(Bos311$neighborhood) | Bos311$neighborhood==" "| Bos311$neighborhood=="" | Bos311$neighborhood=="Chestnut Hill" | Bos311$source=="Maximo Integration"), ]
unique(Bos311_Neighbor$neighborhood) [1] "Boston"
[2] "Dorchester"
[3] "Roxbury"
[4] "Downtown / Financial District"
[5] "Hyde Park"
[6] "East Boston"
[7] "Back Bay"
[8] "Jamaica Plain"
[9] "Charlestown"
[10] "Roslindale"
[11] "Beacon Hill"
[12] "Fenway / Kenmore / Audubon Circle / Longwood"
[13] "West Roxbury"
[14] "Mission Hill"
[15] "South Boston / South Boston Waterfront"
[16] "Allston / Brighton"
[17] "South End"
[18] "Greater Mattapan"
[19] "Brighton"
[20] "South Boston"
[21] "Allston"
[22] "Mattapan" unique(Bos311_Neighbor$source)[1] "Constituent Call" "Citizens Connect App" "City Worker App"
[4] "Self Service" "Employee Generated" #Request by Neighborhood
By_Neighborhood <- table(Bos311_Neighbor$neighborhood)
cbind(By_Neighborhood, prop.table(By_Neighborhood)*100) By_Neighborhood
Allston 377 0.3633210
Allston / Brighton 7139 6.8799692
Back Bay 4717 4.5458488
Beacon Hill 3193 3.0771455
Boston 3653 3.5204549
Brighton 667 0.6427986
Charlestown 3435 3.3103648
Dorchester 16056 15.4734255
Downtown / Financial District 5046 4.8629114
East Boston 8106 7.8118826
Fenway / Kenmore / Audubon Circle / Longwood 1860 1.7925119
Greater Mattapan 5328 5.1346793
Hyde Park 4406 4.2461331
Jamaica Plain 5983 5.7659134
Mattapan 267 0.2573122
Mission Hill 1856 1.7886571
Roslindale 3780 3.6428468
Roxbury 9192 8.8584783
South Boston 940 0.9058931
South Boston / South Boston Waterfront 7658 7.3801378
South End 6577 6.3383607
West Roxbury 3529 3.4009541#Requests by Source
By_Source <- table(Bos311_Neighbor$source)
cbind(By_Source, prop.table(By_Source)*100) By_Source
Citizens Connect App 48120 46.374018
City Worker App 10854 10.460174
Constituent Call 40551 39.079651
Employee Generated 1910 1.840698
Self Service 2330 2.245458Results and Analysis
# Which department recieves the most requests?
ggplot(Bos311, aes(subject)) +
  geom_bar(fill ="#33CCFF")+
  labs(title = "Requests by Department", x = "Department", y = "Frequency") +
  coord_flip()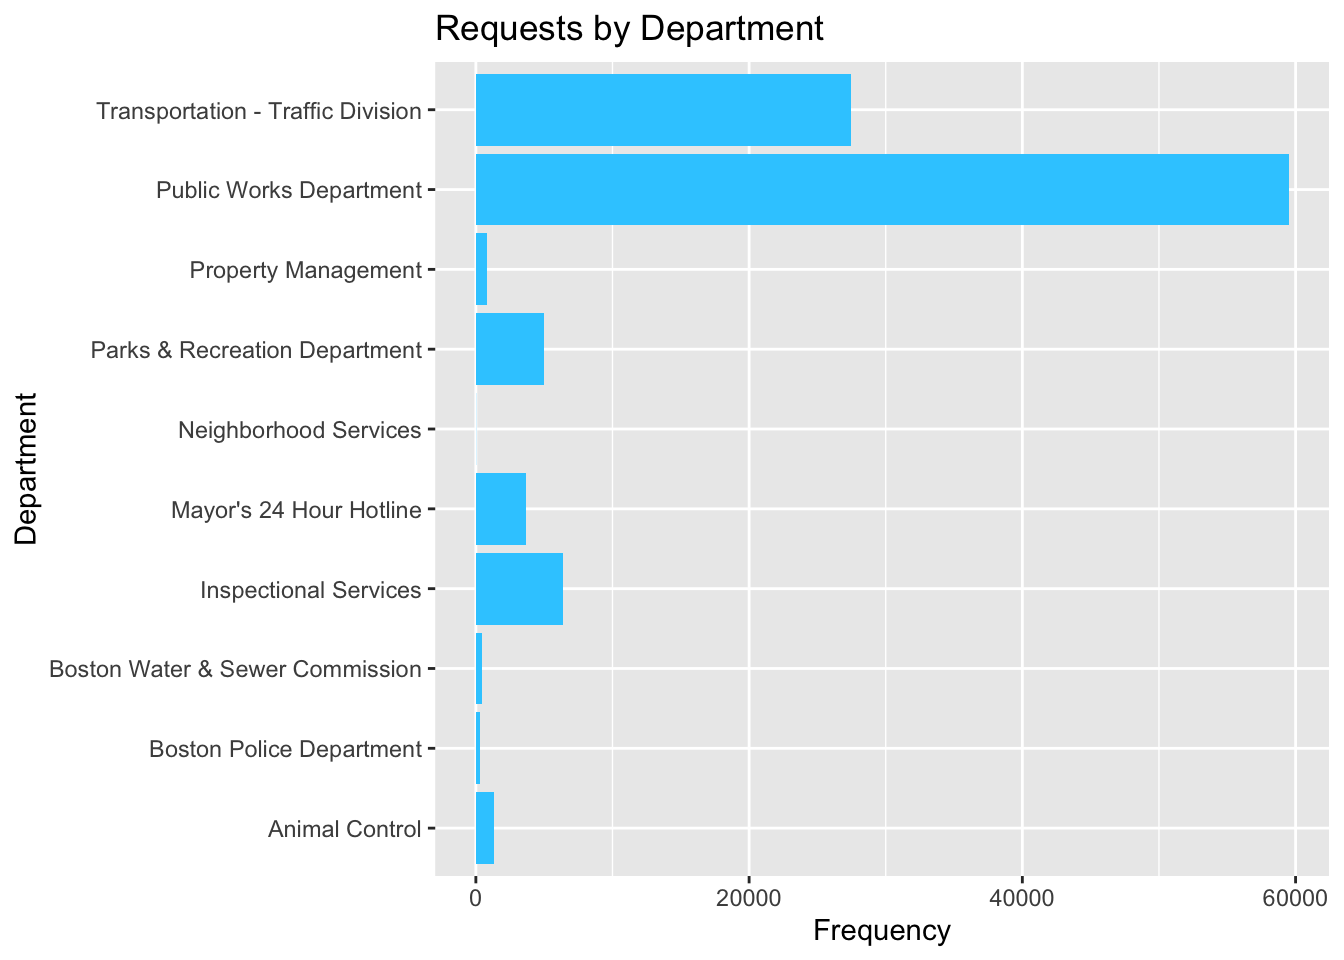
#Which departments have more overdue requests?
ggplot(Bos311, aes(subject)) +
  geom_bar(aes(fill=ontime), position = "fill") +
  labs(title = "On Time and Overdue Requests by Department", x = "Department", y = "Percent") +
  coord_flip()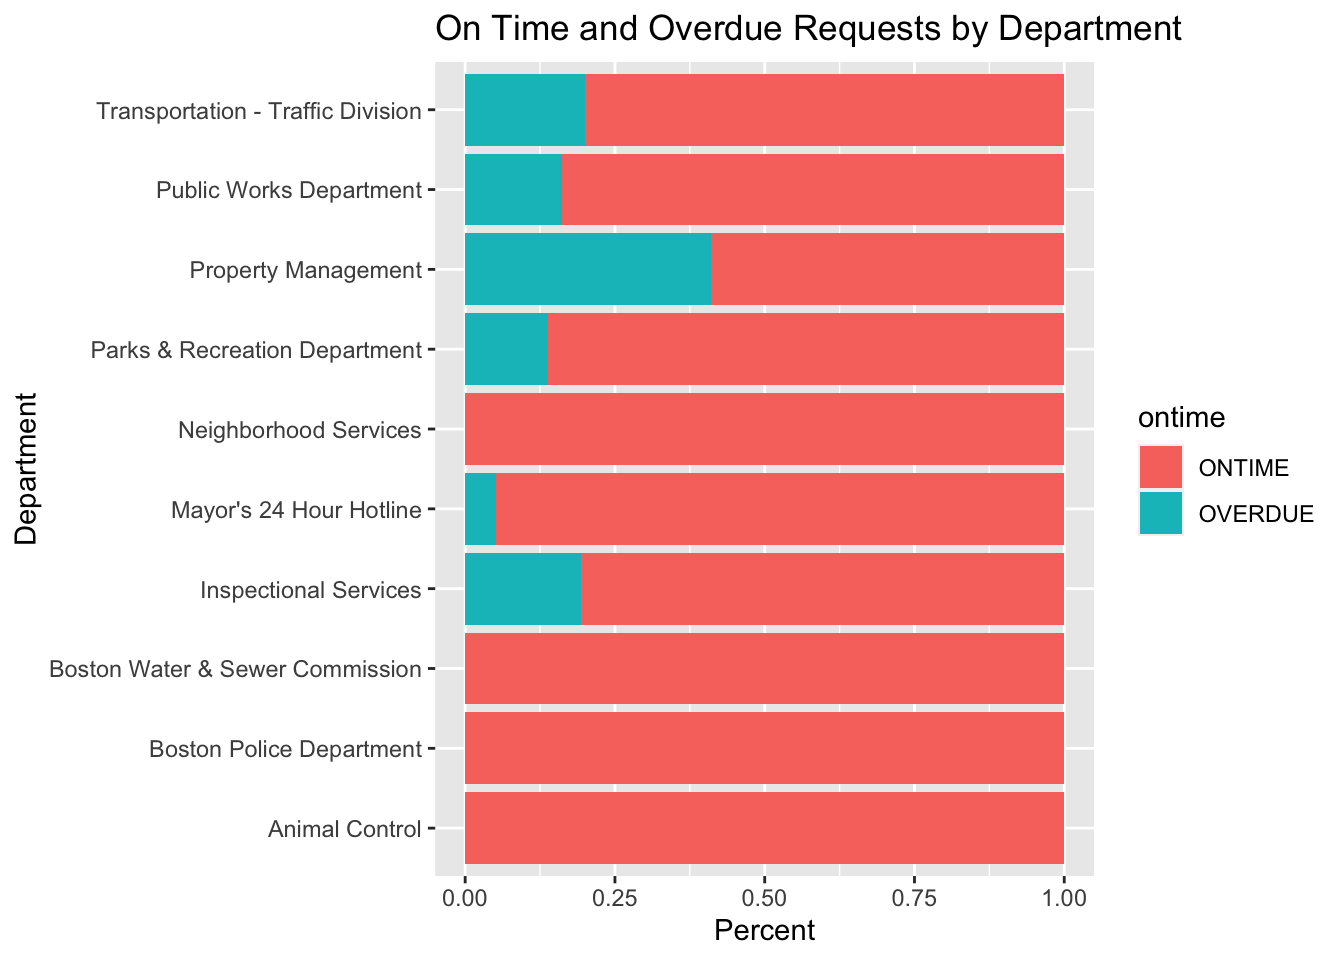
table(Bos311$subject,Bos311$ontime)
                                    ONTIME OVERDUE
  Animal Control                      1353       0
  Boston Police Department             301       0
  Boston Water & Sewer Commission      442       0
  Inspectional Services               5116    1227
  Mayor's 24 Hour Hotline             3495     187
  Neighborhood Services                 13       0
  Parks & Recreation Department       4326     694
  Property Management                  470     327
  Public Works Department            49880    9619
  Transportation - Traffic Division  21988    5496
#Which neighborhoods have more overdue requests?
ggplot(Bos311_Neighbor, aes(neighborhood)) +
geom_bar(aes(fill=ontime), position = "fill") +
labs(title = "On Time and Overdue Requests by Neighborhood", x = "Neighborhood", y = "Percent") +
coord_flip()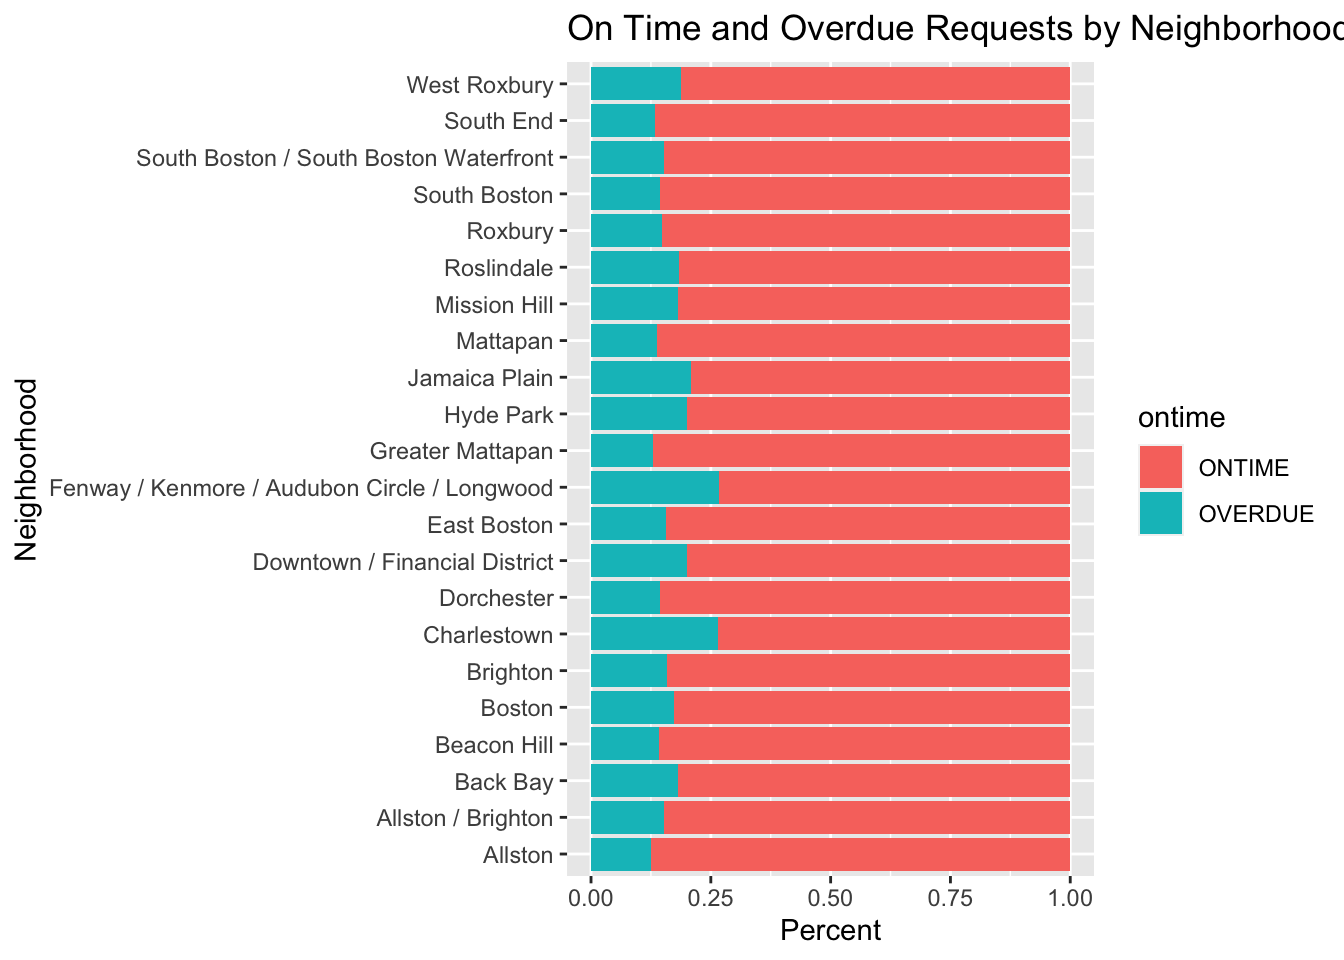
table(Bos311_Neighbor$neighborhood,Bos311_Neighbor$ontime)
                                               ONTIME OVERDUE
  Allston                                         330      47
  Allston / Brighton                             6053    1086
  Back Bay                                       3860     857
  Beacon Hill                                    2737     456
  Boston                                         3018     635
  Brighton                                        561     106
  Charlestown                                    2525     910
  Dorchester                                    13735    2321
  Downtown / Financial District                  4040    1006
  East Boston                                    6836    1270
  Fenway / Kenmore / Audubon Circle / Longwood   1364     496
  Greater Mattapan                               4638     690
  Hyde Park                                      3520     886
  Jamaica Plain                                  4730    1253
  Mattapan                                        230      37
  Mission Hill                                   1520     336
  Roslindale                                     3085     695
  Roxbury                                        7822    1370
  South Boston                                    804     136
  South Boston / South Boston Waterfront         6497    1161
  South End                                      5702     875
West Roxbury 2865 664prop.table(table(Bos311_Neighbor$neighborhood,Bos311_Neighbor$ontime))
                                                     ONTIME      OVERDUE
  Allston                                      0.0031802631 0.0004529466
  Allston / Brighton                           0.0583337349 0.0104659567
  Back Bay                                     0.0371994410 0.0082590469
  Beacon Hill                                  0.0263769094 0.0043945454
  Boston                                       0.0290849516 0.0061195972
  Brighton                                     0.0054064473 0.0010215391
  Charlestown                                  0.0243338313 0.0087698164
  Dorchester                                   0.1323664049 0.0223678504
  Downtown / Financial District                0.0389341300 0.0096949839
  East Boston                                  0.0658796319 0.0122391943
  Fenway / Kenmore / Audubon Circle / Longwood 0.0131450875 0.0047800318
  Greater Mattapan                             0.0446971522 0.0066496410
  Hyde Park                                    0.0339228063 0.0085385246
  Jamaica Plain                                0.0455837710 0.0120753626
  Mattapan                                     0.0022165470 0.0003565750
  Mission Hill                                 0.0146484846 0.0032380861
  Roslindale                                   0.0297306414 0.0066978268
  Roxbury                                      0.0753818725 0.0132029104
  South Boston                                 0.0077482774 0.0013106539
  South Boston / South Boston Waterfront       0.0626126343 0.0111887438
  South End                                    0.0549510914 0.0084325158
  West Roxbury                                 0.0276104660 0.0063990748
#Are *neighborhood* and *ontime* independent?
table(Bos311_Neighbor$neighborhood, Bos311_Neighbor$ontime)
                                               ONTIME OVERDUE
  Allston                                         330      47
  Allston / Brighton                             6053    1086
  Back Bay                                       3860     857
  Beacon Hill                                    2737     456
  Boston                                         3018     635
  Brighton                                        561     106
  Charlestown                                    2525     910
  Dorchester                                    13735    2321
  Downtown / Financial District                  4040    1006
  East Boston                                    6836    1270
  Fenway / Kenmore / Audubon Circle / Longwood   1364     496
  Greater Mattapan                               4638     690
  Hyde Park                                      3520     886
  Jamaica Plain                                  4730    1253
  Mattapan                                        230      37
  Mission Hill                                   1520     336
  Roslindale                                     3085     695
  Roxbury                                        7822    1370
  South Boston                                    804     136
  South Boston / South Boston Waterfront         6497    1161
  South End                                      5702     875
West Roxbury 2865 664chisq.test(table(Bos311_Neighbor$neighborhood, Bos311_Neighbor$ontime))
    Pearson's Chi-squared test

data:  table(Bos311_Neighbor$neighborhood, Bos311_Neighbor$ontime)
X-squared = 795.22, df = 21, p-value < 2.2e-16
# What is the most common source?
ggplot(Bos311_Neighbor, aes(source)) +
geom_bar(fill ="#33CCFF")+
labs(title = "Source of Requests", x = "Source", y = "Frequency") +
coord_flip()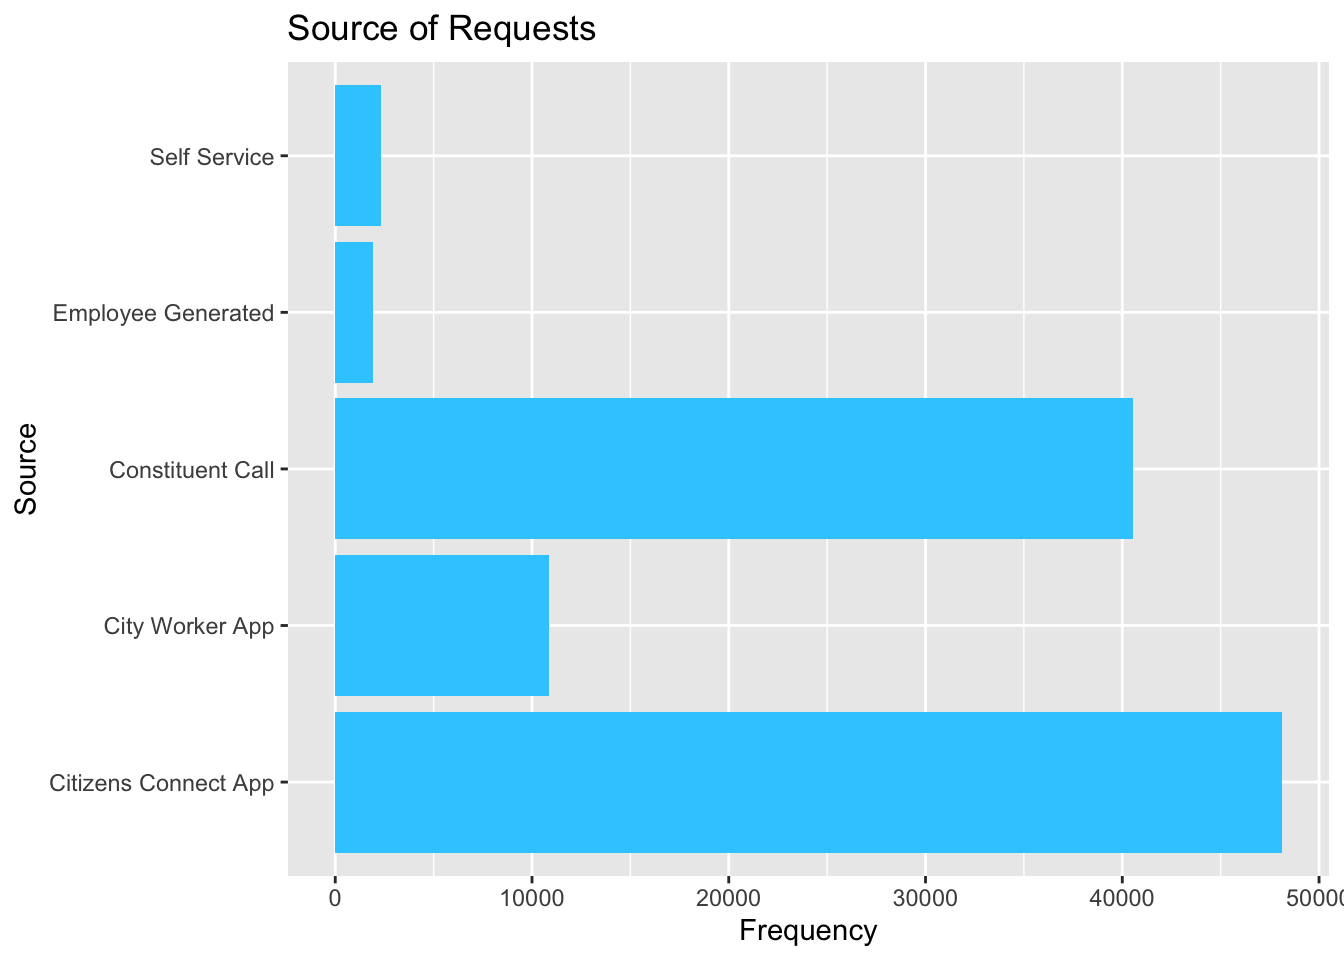
#Are *ontime* and *source* independent? A few visualizations are presented here to discuss which could best answer this question.
ggplot(Bos311_Neighbor, aes(source)) +
  geom_bar(aes(fill=ontime), position = "fill") +
  labs(title = "On Time by Source", x = "Source", y = "Percent") +
  coord_flip()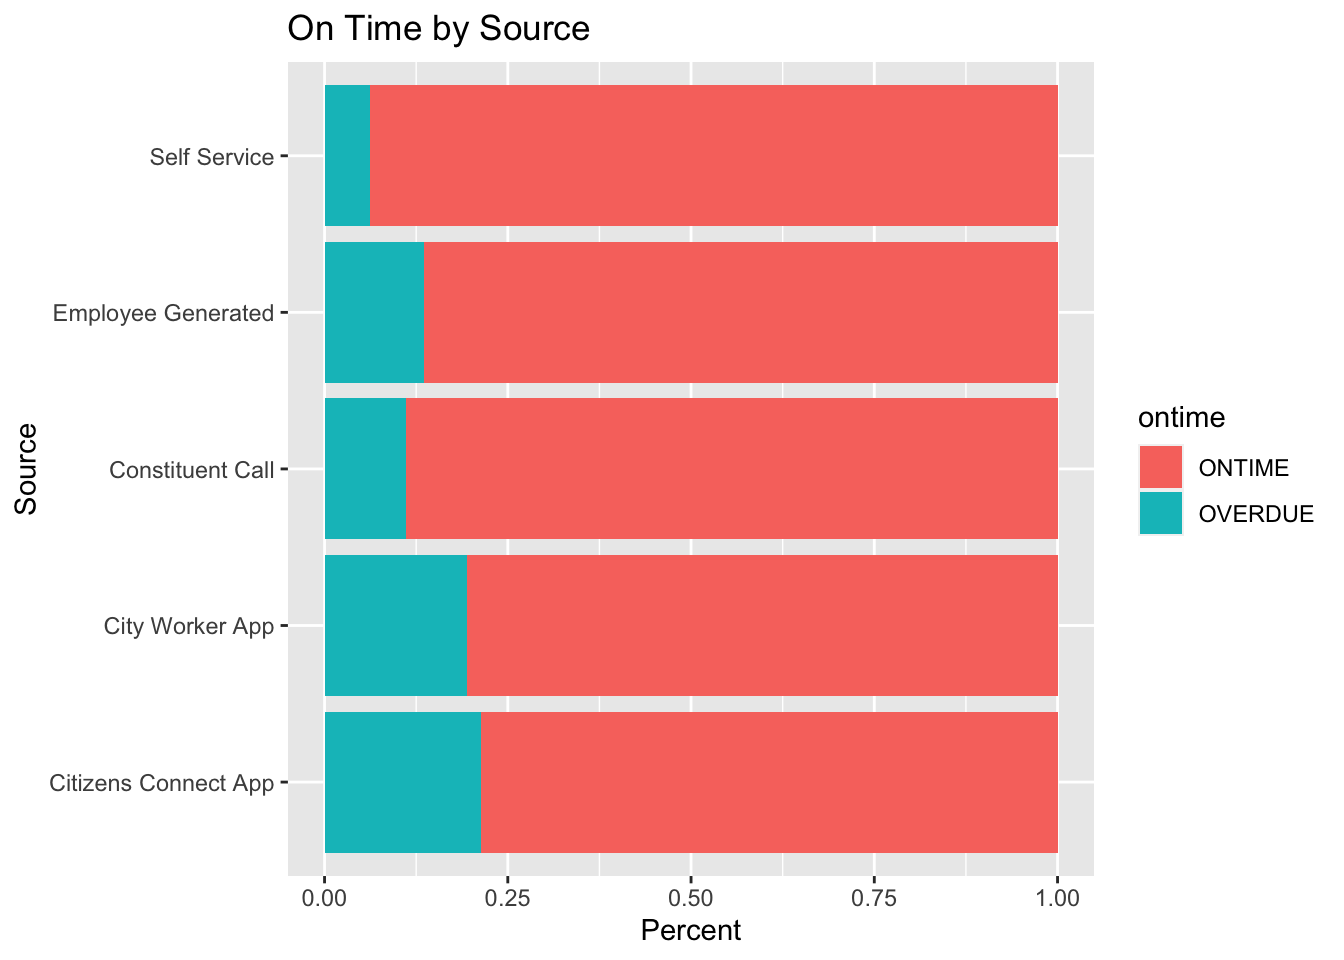
ggplot(Bos311_Neighbor, aes(ontime)) +
  geom_bar(aes(fill=source), position = "fill") +
  labs(title = "Source Distribution for On Time and Overdue", x = "Completion Status", y = "Percent") +
  coord_flip()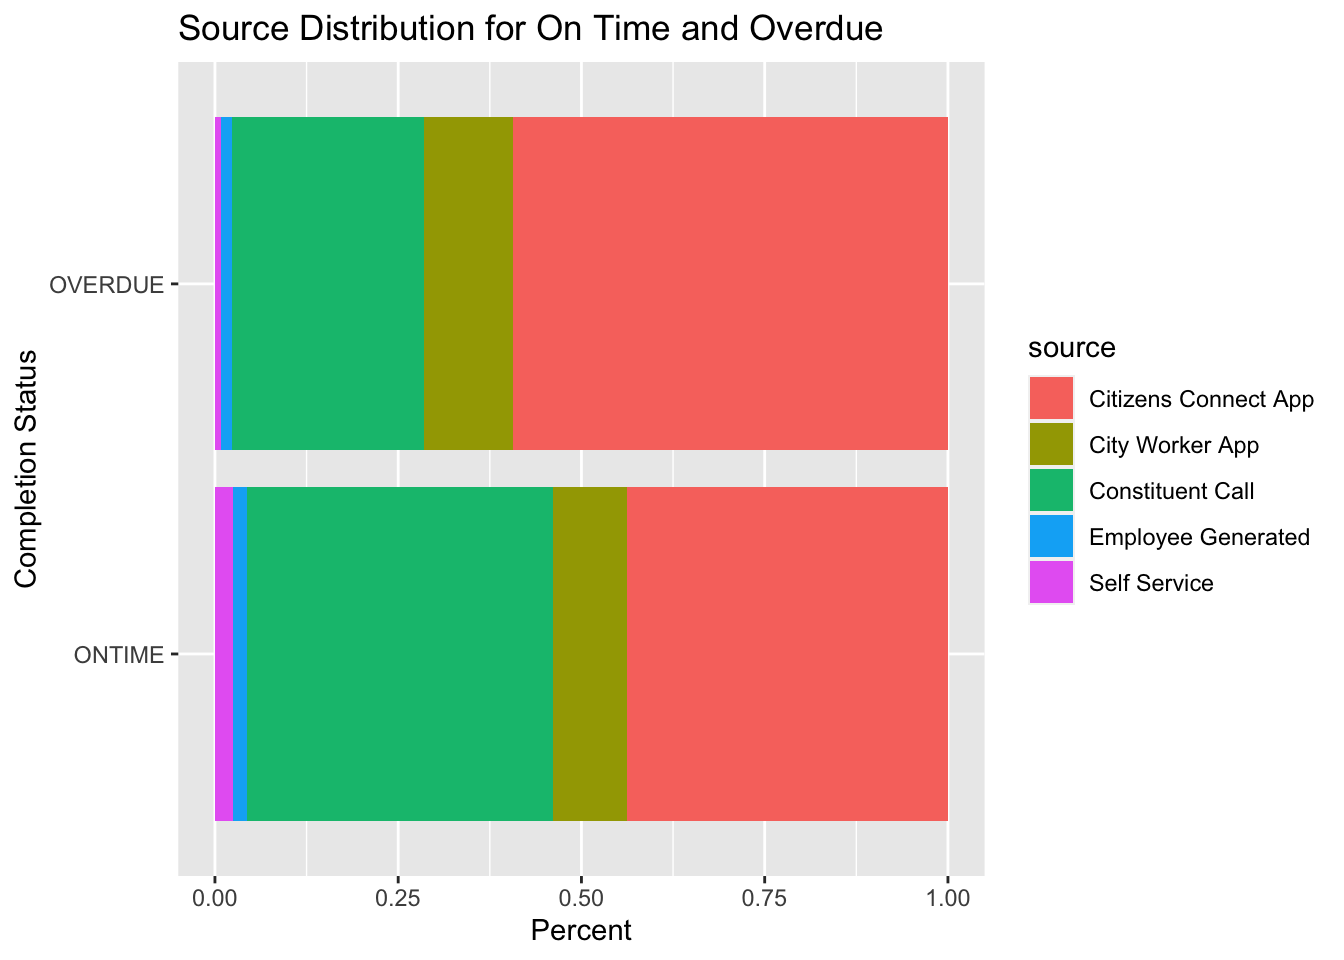
ggplot(Bos311_Neighbor, aes(ontime)) +
  geom_bar(aes(fill=source), position = position_dodge()) +
  labs(title = "Source Distribution for On Time and Overdue", x = "Neighborhood", y = "Percent") +
  coord_flip()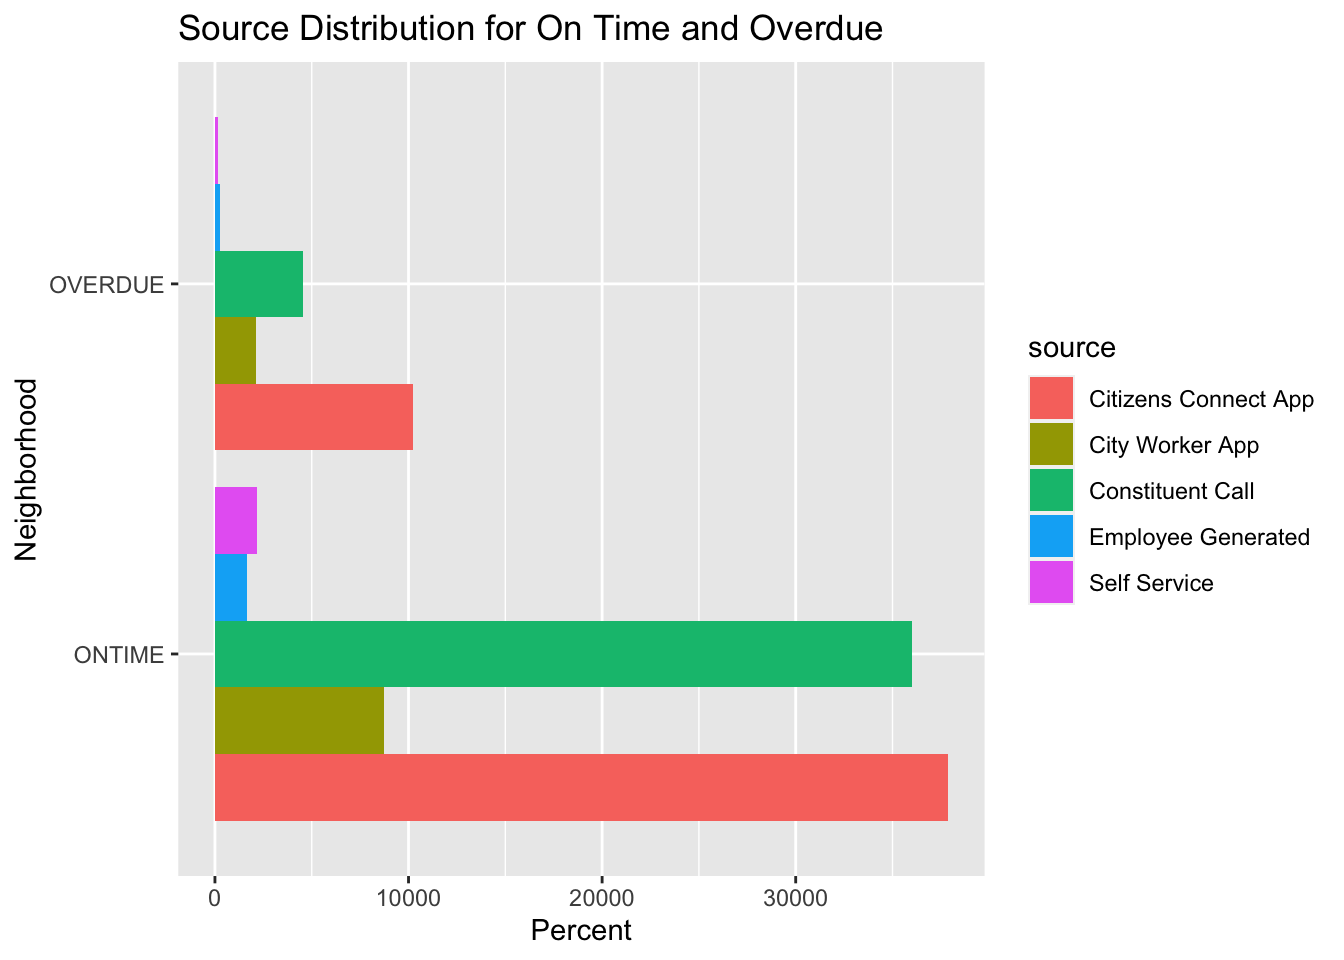
prop.table(table(Bos311_Neighbor$source,Bos311_Neighbor$ontime))
                            ONTIME     OVERDUE
  Citizens Connect App 0.364901460 0.098838722
  City Worker App      0.084315521 0.020286224
  Constituent Call     0.347140173 0.043656339
  Employee Generated   0.015920590 0.002486388
  Self Service         0.021066834 0.001387751
#Are *ontime* requests and *source* independent? A chi-square test concludes no, that these variables are associated.
table(Bos311_Neighbor$ontime, Bos311_Neighbor$source)
          Citizens Connect App City Worker App Constituent Call
  ONTIME                 37864            8749            36021
  OVERDUE                10256            2105             4530

          Employee Generated Self Service
  ONTIME                1652         2186
OVERDUE 258 144chisq.test(table(Bos311_Neighbor$ontime, Bos311_Neighbor$source))
    Pearson's Chi-squared test

data:  table(Bos311_Neighbor$ontime, Bos311_Neighbor$source)
X-squared = 1886.3, df = 4, p-value < 2.2e-16
# How are requests submitted in each neighborhood?
ggplot(Bos311_Neighbor, aes(neighborhood)) +
geom_bar(aes(fill = source), position = "fill") +
labs(title = "311 Service Requests for 2023", x = "Neighborhood", y = "Percent") +
coord_flip()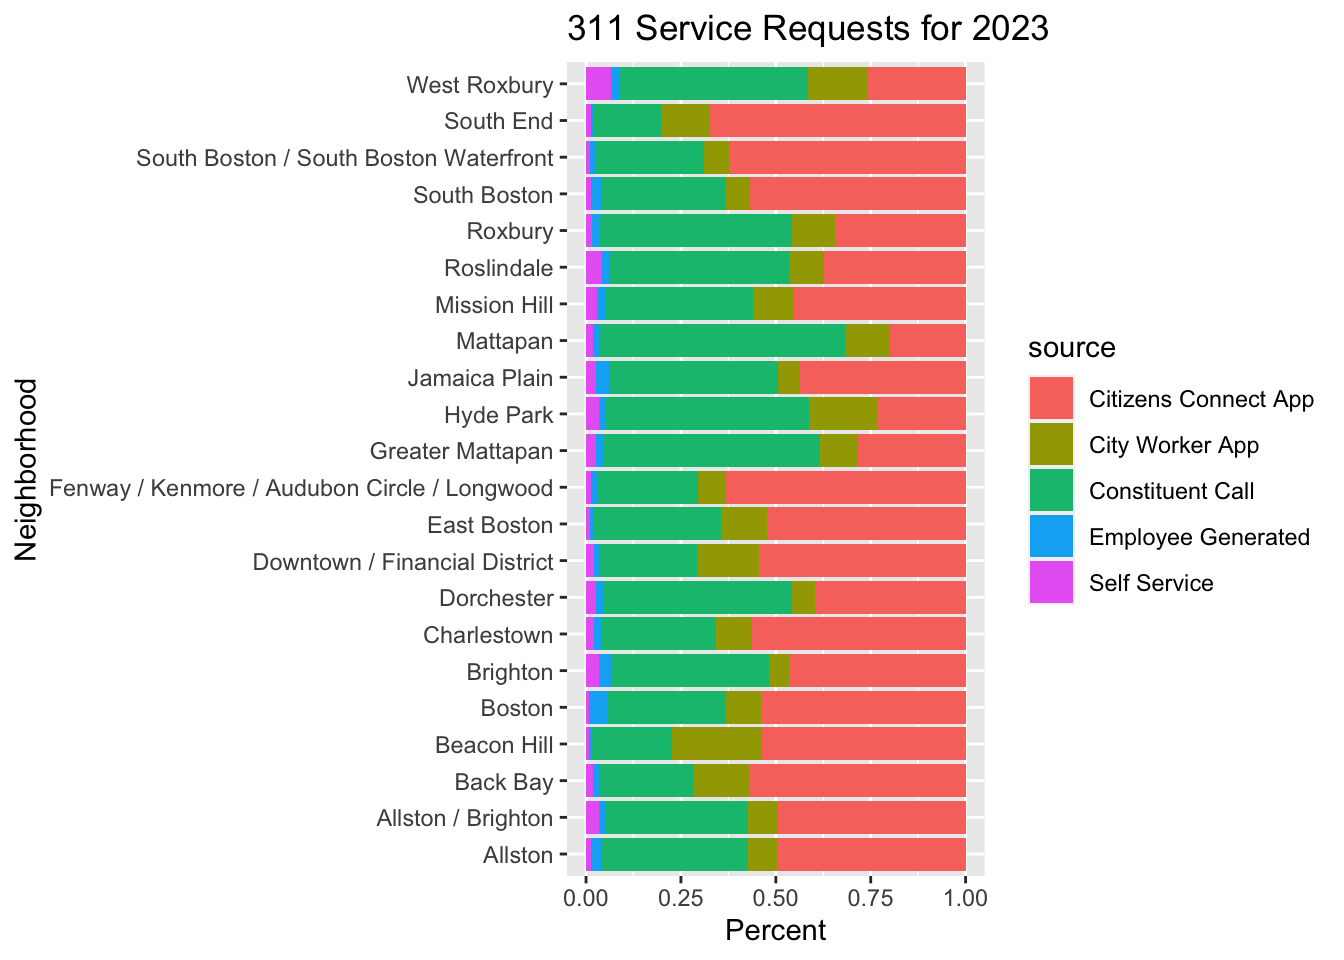
table(Bos311_Neighbor$neighborhood, Bos311_Neighbor$source)
                                               Citizens Connect App
  Allston                                                       187
  Allston / Brighton                                           3534
  Back Bay                                                     2692
  Beacon Hill                                                  1710
  Boston                                                       1973
  Brighton                                                      311
  Charlestown                                                  1936
  Dorchester                                                   6356
  Downtown / Financial District                                2747
  East Boston                                                  4244
  Fenway / Kenmore / Audubon Circle / Longwood                 1172
  Greater Mattapan                                             1508
  Hyde Park                                                    1034
  Jamaica Plain                                                2603
  Mattapan                                                       53
  Mission Hill                                                  841
  Roslindale                                                   1408
  Roxbury                                                      3175
  South Boston                                                  534
  South Boston / South Boston Waterfront                       4775
  South End                                                    4422
  West Roxbury                                                  905

                                               City Worker App Constituent Call
  Allston                                                   29              146
  Allston / Brighton                                       556             2689
  Back Bay                                                 683             1182
  Beacon Hill                                              758              675
  Boston                                                   329             1148
  Brighton                                                  35              278
  Charlestown                                              319             1040
  Dorchester                                               999             7988
  Downtown / Financial District                            818             1312
  East Boston                                              985             2733
  Fenway / Kenmore / Audubon Circle / Longwood             140              489
  Greater Mattapan                                         530             3033
  Hyde Park                                                784             2358
  Jamaica Plain                                            349             2674
  Mattapan                                                  32              172
  Mission Hill                                             201              716
  Roslindale                                               339             1807
  Roxbury                                                 1027             4656
  South Boston                                              59              309
  South Boston / South Boston Waterfront                   493             2201
  South End                                                833             1193
  West Roxbury                                             556             1752

                                               Employee Generated Self Service
  Allston                                                      10            5
  Allston / Brighton                                          122          238
  Back Bay                                                     73           87
  Beacon Hill                                                  21           29
  Boston                                                      172           31
  Brighton                                                     21           22
  Charlestown                                                  71           69
  Dorchester                                                  302          411
  Downtown / Financial District                                62          107
  East Boston                                                  49           95
  Fenway / Kenmore / Audubon Circle / Longwood                 33           26
  Greater Mattapan                                            122          135
  Hyde Park                                                    79          151
  Jamaica Plain                                               193          164
  Mattapan                                                      5            5
  Mission Hill                                                 45           53
  Roslindale                                                   72          154
  Roxbury                                                     191          143
  South Boston                                                 26           12
  South Boston / South Boston Waterfront                      108           81
  South End                                                    47           82
  West Roxbury                                                 86          230
# How are requests submitted for each department? Again, a few graphs are presented for discussion to see which better represents the question.
ggplot(Bos311, aes(subject)) +
geom_bar(aes(fill = source), position = position_dodge())+
labs(title = "Source of Requests per Department", x = "Department", y = "Frequency") +
coord_flip()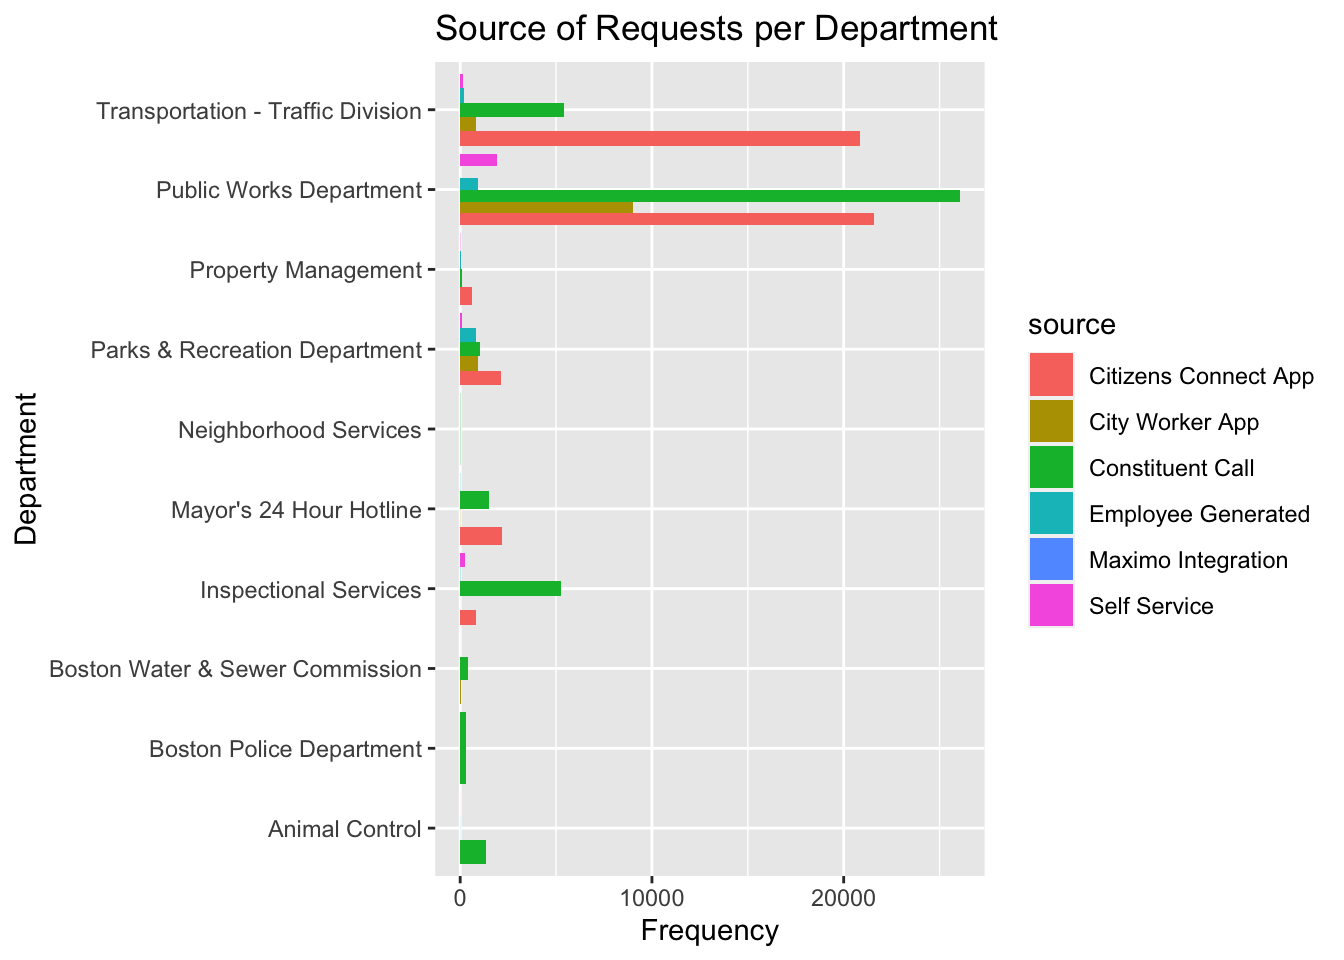
ggplot(Bos311_Neighbor, aes(subject)) +
  geom_bar(aes(fill = source), position = "fill")+
  labs(title = "Source of Requests per Department", x = "Department", y = "Percent") +
  coord_flip()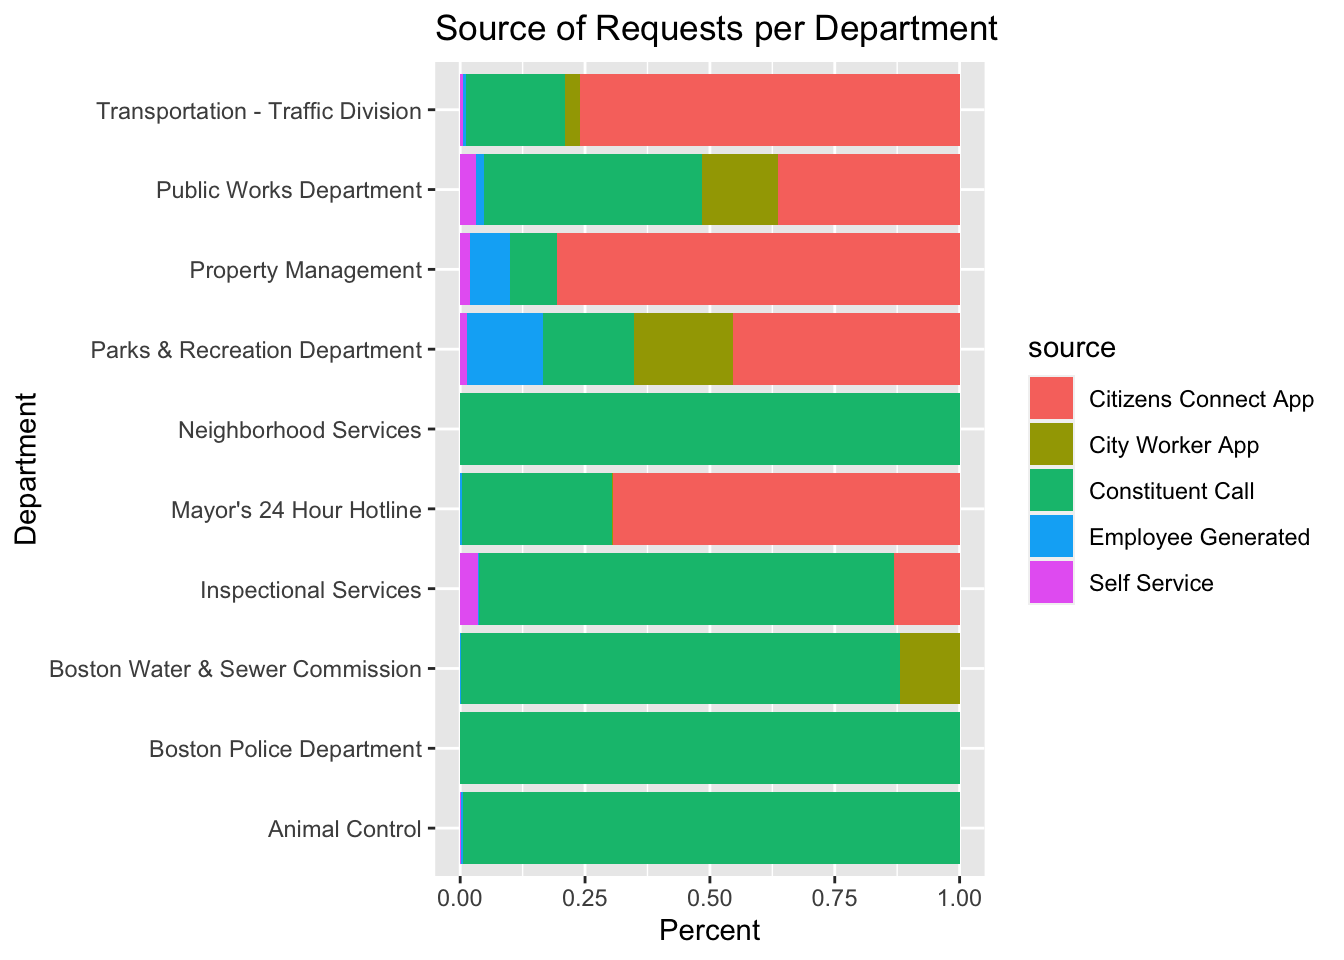
Conclusion and Discussion
I have a whole new appreciation for city management after sorting 100,000 plus non-emergency service requests. Tables and bar graphs show that Public Works receives the most requests, more than all the other departments combined. And that the Citizen Connect App is most frequent way requests are submitted. There are infinite ways to dive into the details of this data set. For instance, while Citizens Connect App is the most used way overall to report requests, constituent calls account for majority of requests for the Public Works department and the only way for the Water and Sewer, Police, and Animal Control. And knowing information like this can help planners enhance communication between the city and its residents.
Being perceptive about things like which departments and neighborhoods have more overdue requests can provide direction on improving services. For example, looking at additional variables like reason and type might shed light on why some areas have more overdue requests than others.
The chi-square test for independence for the variables ontime and neighborhood and for ontime and source. The conclusions for both tests are that these variables are associated, that they are not independent. What does that tell us? Possibly that for a service request to be completed on time might be dependent on which department or neighborhood. Is it reasonable to expect ontime to be independent of subject (department) and neighborhood? In theory, yes, but in reality, leads to more questions. What else can be contributing to these dependencies? Further study can lead to solutions so that departments have necessary resources and neighborhoods are attended to equally. Additional questions might be…
# What are the *reasons* for each *neighborhood*?
ggplot(Bos311_Neighbor, aes(neighborhood)) +
  geom_bar(aes(fill=reason), position = "fill") +
  labs(title = "Reason for Requests by Neighborhood", x = "Neighborhood", y = "Percent") +
  coord_flip()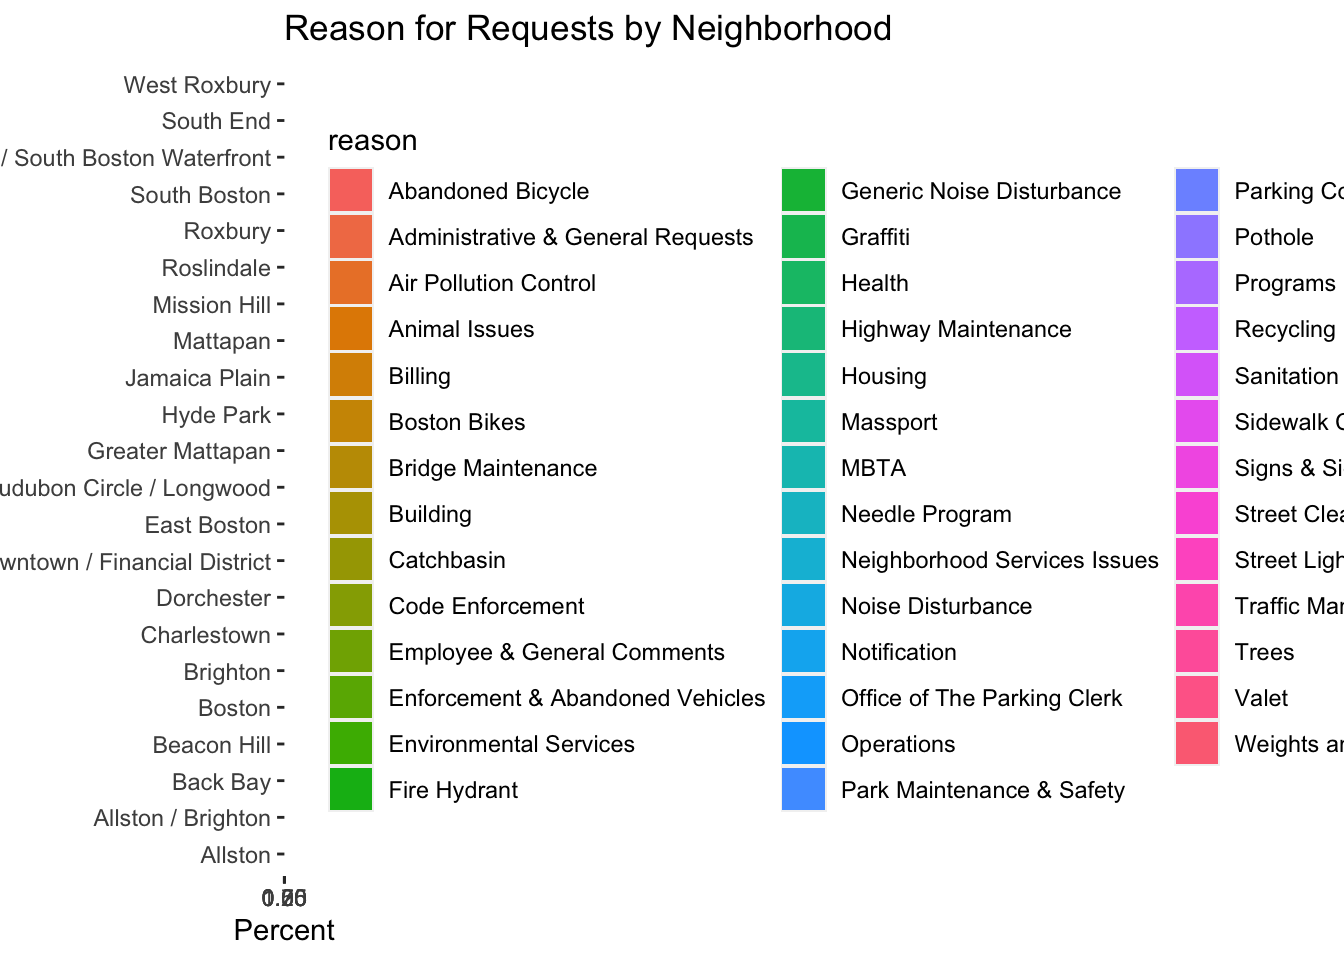
# What *reasons* are more likely to be *ontime*?
ggplot(Bos311_Neighbor, aes(ontime)) +
  geom_bar(aes(fill=reason), position = position_dodge()) +
  labs(title = "Reason by Completion", x = "Request Completion", y = "Percent") +
  coord_flip()
Bibliography
Center for Public Impact (2016, April 4) “Accessing Boston’s non-emergency services via Bos:311” URL https://www.centreforpublicimpact.org/case-study/updating-311-us-municipal-services
City Wide Analytics Team (2023, May 15) “Analyze Boston” URL https://data.boston.gov/
City Wide Analytics Team (2023, May 15) “311 Service-2023” URL https://data.boston.gov/dataset/8048697b-ad64-4bfc-b090-ee00169f2323/resource/e6013a93-1321-4f2 a-bf91-8d8a02f1e62f/download/tmp7tg4exd3.csv
Posit team (2022). RStudio: Integrated Development Environment for R. Posit Software, PBC, Boston, MA. URL http://www.posit.co/.
R Core Team (2022). R: A language and environment for statistical computing. R Foundation for Statistical Computing, Vienna, Austria. URL https://www.R-project.org/.