library(tidyverse)
library(readr)
library(ggplot2)
knitr::opts_chunk$set(echo = TRUE, warning=FALSE, message=FALSE)Final Project Assignment #2: Nanci Kopecky
final_Project_assignment_1
final_project_data_description
Boston 311 Service Requests for 2023
Part 1. Introduction
- Data set(s) Introduction:
311 Service Requests is a data set on Analyze Boston data.boston.gov, an open-source data website run by the City of Boston. Residents and city employees can make service requests through various means, such as by phone, with an app, and online. In April 2023, there are 74,930 service requests at that point. Each row represents a service request. There are 29 columns. Each column contains detailed information on each service request including the description, time, date, location, and city department/domain. Service requests are about maintenance, repair, cleaning, and policy. Note: As of May 3, 2021, there are now 91,254 service requests.
- What questions do you like to answer with this data set?
Questions that could inform city officials could be the following:
Which city department receives the most service requests? Do residents and city employees use or prefer making service requests by the phone, app, or some other format? Does certain time of the day, week, or month receive more requests? What type of service requests are made in each neighborhood? Are the proportions of On Time service requests the same for each neighborhood? For each city department?
Part 2. Describe the data set(s)
- Read the data set.
This data set is read in with a url.
Boston311 <- read.csv(url("https://data.boston.gov/dataset/8048697b-ad64-4bfc-b090-ee00169f2323/resource/e6013a93-1321-4f2a-bf91-8d8a02f1e62f/download/tmpo8qm0oqd.csv"))
Boston311Bos311 <- as.data.frame.matrix(Boston311)
Bos311- Descriptive information of the data set. As of May 3, 2023, there are 91,255 service requests. Each row represents a service request. There are 29 columns where each variable gives a detail of the service request. 28 of the variables are collected as categorical/character data. The only numerical variable is the case_enquiry_id, identifying each individual service request. The other variables provide information about the following: case status as open, target, close dates; descriptions the request with the title, subject, reason, and type; which department; location information including address, fire, city council and police districts, and latitude and longitude coordinates; and how the service request was reported.
dim(Bos311)[1] 92176 29head(Bos311)#Lists the structure of each variable.
str(Bos311)'data.frame': 92176 obs. of 29 variables:
$ case_enquiry_id : num 1.01e+11 1.01e+11 1.01e+11 1.01e+11 1.01e+11 ...
$ open_dt : chr "2023-01-03 09:39:00" "2023-01-01 15:08:00" "2023-01-01 01:34:42" "2023-01-01 03:55:00" ...
$ target_dt : chr "2023-01-04 09:39:29" "2023-01-06 08:30:00" "" "2023-01-04 08:30:00" ...
$ closed_dt : chr "" "" "2023-01-01 07:41:03" "2023-01-01 04:49:57" ...
$ ontime : chr "OVERDUE" "OVERDUE" "ONTIME" "ONTIME" ...
$ case_status : chr "Open" "Open" "Closed" "Closed" ...
$ closure_reason : chr " " " " "Case Closed. Closed date : Sun Jan 01 07:41:03 EST 2023 Resolved 3 syringe recovered dw " "Case Closed. Closed date : Sun Jan 01 04:49:57 EST 2023 Resolved Mva cleared " ...
$ case_title : chr "Request for Pothole Repair" "Building Inspection Request" "Needle Pickup" "Requests for Street Cleaning" ...
$ subject : chr "Public Works Department" "Inspectional Services" "Mayor's 24 Hour Hotline" "Public Works Department" ...
$ reason : chr "Highway Maintenance" "Building" "Needle Program" "Street Cleaning" ...
$ type : chr "Request for Pothole Repair" "Building Inspection Request" "Needle Pickup" "Requests for Street Cleaning" ...
$ queue : chr "BWSC_Pothole" "ISD_Building (INTERNAL)" "GEN_Needle_Pickup" "PWDx_District 07: South Dorchester" ...
$ department : chr "BWSC" "ISD" "GEN_" "PWDx" ...
$ submittedphoto : chr "" "" "" "" ...
$ closedphoto : chr "" "" "" "https://spot-boston-res.cloudinary.com/image/upload/v1672566594/boston/production/ytw83xz2pkbu6kwxont7.jpg#spot"| __truncated__ ...
$ location : chr "INTERSECTION of Huckins St & Lagrange Pl Roxbury MA " "1515 River St Hyde Park MA 02136" "INTERSECTION of Pompeii St & Theodore A Glynn Way Roxbury MA " "INTERSECTION of Beach St & Park St Dorchester MA " ...
$ fire_district : int 7 12 7 7 4 3 1 6 7 11 ...
$ pwd_district : chr "10B" "08" "10B" "07" ...
$ city_council_district : int 9 5 3 3 2 2 1 2 4 8 ...
$ police_district : chr "B2" "E18" "C6" "C11" ...
$ neighborhood : chr "Roxbury" "Hyde Park" "South Boston / South Boston Waterfront" "Dorchester" ...
$ neighborhood_services_district: int 13 10 13 7 6 3 1 5 13 15 ...
$ ward : chr "8" "Ward 18" "8" "16" ...
$ precinct : chr "0805" "1819" "0806" "1602" ...
$ location_street_name : chr "INTERSECTION Huckins St & Lagrange Pl" "1515 River St" "INTERSECTION Pompeii St & Theodore A Glynn Way" "INTERSECTION Beach St & Park St" ...
$ location_zipcode : int NA 2136 NA NA NA 2110 2128 2127 NA NA ...
$ latitude : num 42.4 42.3 42.4 42.4 42.4 ...
$ longitude : num -71.1 -71.1 -71.1 -71.1 -71.1 ...
$ source : chr "Citizens Connect App" "Constituent Call" "Citizens Connect App" "Constituent Call" ...- Summary statistics of the dataset(s).
This data set does not have numerical data so frequencies and percentages will summarize the categorical variables. Below the counts and proportions of some of the variables.
#Frequency and Proportions of Service Requests by Department
prop.table(table(Bos311$subject))
Animal Control Boston Police Department
0.0124652838 0.0026796563
Boston Water & Sewer Commission Inspectional Services
0.0044263149 0.0621745357
Mayor's 24 Hour Hotline Neighborhood Services
0.0348789273 0.0001301857
Parks & Recreation Department Property Management
0.0424730949 0.0077568998
Public Works Department Transportation - Traffic Division
0.5682932651 0.2647218365 table(Bos311$subject)
Animal Control Boston Police Department
1149 247
Boston Water & Sewer Commission Inspectional Services
408 5731
Mayor's 24 Hour Hotline Neighborhood Services
3215 12
Parks & Recreation Department Property Management
3915 715
Public Works Department Transportation - Traffic Division
52383 24401 #Counts and percentages of on-time and overdue service requests for each department.
table(Bos311$subject,Bos311$ontime)
ONTIME OVERDUE
Animal Control 1149 0
Boston Police Department 247 0
Boston Water & Sewer Commission 408 0
Inspectional Services 4628 1103
Mayor's 24 Hour Hotline 3043 172
Neighborhood Services 12 0
Parks & Recreation Department 3323 592
Property Management 429 286
Public Works Department 43968 8415
Transportation - Traffic Division 19382 5019prop.table(table(Bos311$subject,Bos311$ontime))
ONTIME OVERDUE
Animal Control 0.0124652838 0.0000000000
Boston Police Department 0.0026796563 0.0000000000
Boston Water & Sewer Commission 0.0044263149 0.0000000000
Inspectional Services 0.0502082972 0.0119662385
Mayor's 24 Hour Hotline 0.0330129318 0.0018659955
Neighborhood Services 0.0001301857 0.0000000000
Parks & Recreation Department 0.0360505989 0.0064224961
Property Management 0.0046541399 0.0031027599
Public Works Department 0.4770005207 0.0912927443
Transportation - Traffic Division 0.2102716542 0.0544501823#Removing the row with missing values for neighborhood.
Bos311_Neighbor <- Bos311[!(is.na(Bos311$neighborhood) | Bos311$neighborhood==" "| Bos311$neighborhood==""), ]
unique(Bos311_Neighbor$neighborhood) [1] "Roxbury"
[2] "Hyde Park"
[3] "South Boston / South Boston Waterfront"
[4] "Dorchester"
[5] "Back Bay"
[6] "Boston"
[7] "East Boston"
[8] "Allston / Brighton"
[9] "Charlestown"
[10] "Beacon Hill"
[11] "West Roxbury"
[12] "Allston"
[13] "Jamaica Plain"
[14] "South End"
[15] "South Boston"
[16] "Mission Hill"
[17] "Roslindale"
[18] "Downtown / Financial District"
[19] "Fenway / Kenmore / Audubon Circle / Longwood"
[20] "Greater Mattapan"
[21] "Mattapan"
[22] "Brighton"
[23] "Chestnut Hill" #Counts and percentages of on-time and overdue service requests for each neighborhood.
table(Bos311_Neighbor$neighborhood,Bos311_Neighbor$ontime)
ONTIME OVERDUE
Allston 293 38
Allston / Brighton 5335 975
Back Bay 3389 762
Beacon Hill 2333 393
Boston 2550 561
Brighton 501 88
Charlestown 2183 809
Chestnut Hill 1 0
Dorchester 11984 2073
Downtown / Financial District 3558 906
East Boston 6040 1173
Fenway / Kenmore / Audubon Circle / Longwood 1210 441
Greater Mattapan 4053 619
Hyde Park 3078 761
Jamaica Plain 4138 1107
Mattapan 210 36
Mission Hill 1345 282
Roslindale 2696 598
Roxbury 6882 1213
South Boston 709 122
South Boston / South Boston Waterfront 5808 1057
South End 5012 786
West Roxbury 2504 565prop.table(table(Bos311_Neighbor$neighborhood,Bos311_Neighbor$ontime))
ONTIME OVERDUE
Allston 3.213530e-03 4.167718e-04
Allston / Brighton 5.851256e-02 1.069349e-02
Back Bay 3.716946e-02 8.357371e-03
Beacon Hill 2.558759e-02 4.310298e-03
Boston 2.796758e-02 6.152867e-03
Brighton 5.494807e-03 9.651557e-04
Charlestown 2.394244e-02 8.872852e-03
Chestnut Hill 1.096768e-05 0.000000e+00
Dorchester 1.314367e-01 2.273600e-02
Downtown / Financial District 3.902300e-02 9.936716e-03
East Boston 6.624478e-02 1.286509e-02
Fenway / Kenmore / Audubon Circle / Longwood 1.327089e-02 4.836746e-03
Greater Mattapan 4.445200e-02 6.788993e-03
Hyde Park 3.375851e-02 8.346403e-03
Jamaica Plain 4.538425e-02 1.214122e-02
Mattapan 2.303212e-03 3.948364e-04
Mission Hill 1.475153e-02 3.092885e-03
Roslindale 2.956886e-02 6.558672e-03
Roxbury 7.547956e-02 1.330379e-02
South Boston 7.776084e-03 1.338057e-03
South Boston / South Boston Waterfront 6.370028e-02 1.159284e-02
South End 5.497000e-02 8.620595e-03
West Roxbury 2.746307e-02 6.196738e-03#Counts and percents of how residents and city employees make service for each neighborhood.
table(Bos311_Neighbor$neighborhood, Bos311_Neighbor$source)
Citizens Connect App
Allston 161
Allston / Brighton 3151
Back Bay 2394
Beacon Hill 1456
Boston 1733
Brighton 282
Charlestown 1661
Chestnut Hill 0
Dorchester 5608
Downtown / Financial District 2413
East Boston 3863
Fenway / Kenmore / Audubon Circle / Longwood 1038
Greater Mattapan 1322
Hyde Park 883
Jamaica Plain 2275
Mattapan 52
Mission Hill 749
Roslindale 1223
Roxbury 2760
South Boston 472
South Boston / South Boston Waterfront 4334
South End 3899
West Roxbury 824
City Worker App Constituent Call
Allston 25 131
Allston / Brighton 455 2378
Back Bay 587 1020
Beacon Hill 645 586
Boston 295 991
Brighton 25 240
Charlestown 275 930
Chestnut Hill 0 1
Dorchester 848 6969
Downtown / Financial District 744 1157
East Boston 799 2427
Fenway / Kenmore / Audubon Circle / Longwood 126 431
Greater Mattapan 469 2652
Hyde Park 686 2067
Jamaica Plain 317 2336
Mattapan 26 158
Mission Hill 170 622
Roslindale 277 1594
Roxbury 913 4116
South Boston 53 281
South Boston / South Boston Waterfront 392 1975
South End 734 1057
West Roxbury 481 1521
Employee Generated Self Service
Allston 10 4
Allston / Brighton 109 217
Back Bay 69 81
Beacon Hill 14 25
Boston 64 28
Brighton 20 22
Charlestown 67 59
Chestnut Hill 0 0
Dorchester 284 348
Downtown / Financial District 60 90
East Boston 41 83
Fenway / Kenmore / Audubon Circle / Longwood 33 23
Greater Mattapan 115 114
Hyde Park 69 134
Jamaica Plain 183 134
Mattapan 5 5
Mission Hill 43 43
Roslindale 66 134
Roxbury 182 124
South Boston 13 12
South Boston / South Boston Waterfront 91 73
South End 44 64
West Roxbury 51 192prop.table(table(Bos311_Neighbor$neighborhood, Bos311_Neighbor$source))
Citizens Connect App
Allston 1.765796e-03
Allston / Brighton 3.455915e-02
Back Bay 2.625662e-02
Beacon Hill 1.596894e-02
Boston 1.900699e-02
Brighton 3.092885e-03
Charlestown 1.821731e-02
Chestnut Hill 0.000000e+00
Dorchester 6.150674e-02
Downtown / Financial District 2.646501e-02
East Boston 4.236814e-02
Fenway / Kenmore / Audubon Circle / Longwood 1.138445e-02
Greater Mattapan 1.449927e-02
Hyde Park 9.684460e-03
Jamaica Plain 2.495147e-02
Mattapan 5.703193e-04
Mission Hill 8.214791e-03
Roslindale 1.341347e-02
Roxbury 3.027079e-02
South Boston 5.176744e-03
South Boston / South Boston Waterfront 4.753392e-02
South End 4.276298e-02
West Roxbury 9.037367e-03
City Worker App Constituent Call
Allston 2.741920e-04 1.436766e-03
Allston / Brighton 4.990294e-03 2.608114e-02
Back Bay 6.438027e-03 1.118703e-02
Beacon Hill 7.074152e-03 6.427059e-03
Boston 3.235465e-03 1.086897e-02
Brighton 2.741920e-04 2.632243e-03
Charlestown 3.016112e-03 1.019994e-02
Chestnut Hill 0.000000e+00 1.096768e-05
Dorchester 9.300591e-03 7.643375e-02
Downtown / Financial District 8.159953e-03 1.268960e-02
East Boston 8.763175e-03 2.661856e-02
Fenway / Kenmore / Audubon Circle / Longwood 1.381927e-03 4.727069e-03
Greater Mattapan 5.143841e-03 2.908628e-02
Hyde Park 7.523827e-03 2.267019e-02
Jamaica Plain 3.476754e-03 2.562050e-02
Mattapan 2.851596e-04 1.732893e-03
Mission Hill 1.864505e-03 6.821896e-03
Roslindale 3.038047e-03 1.748248e-02
Roxbury 1.001349e-02 4.514296e-02
South Boston 5.812869e-04 3.081918e-03
South Boston / South Boston Waterfront 4.299330e-03 2.166116e-02
South End 8.050276e-03 1.159284e-02
West Roxbury 5.275453e-03 1.668184e-02
Employee Generated Self Service
Allston 1.096768e-04 4.387071e-05
Allston / Brighton 1.195477e-03 2.379986e-03
Back Bay 7.567698e-04 8.883819e-04
Beacon Hill 1.535475e-04 2.741920e-04
Boston 7.019314e-04 3.070950e-04
Brighton 2.193536e-04 2.412889e-04
Charlestown 7.348344e-04 6.470930e-04
Chestnut Hill 0.000000e+00 0.000000e+00
Dorchester 3.114821e-03 3.816752e-03
Downtown / Financial District 6.580607e-04 9.870910e-04
East Boston 4.496748e-04 9.103173e-04
Fenway / Kenmore / Audubon Circle / Longwood 3.619334e-04 2.522566e-04
Greater Mattapan 1.261283e-03 1.250315e-03
Hyde Park 7.567698e-04 1.469669e-03
Jamaica Plain 2.007085e-03 1.469669e-03
Mattapan 5.483839e-05 5.483839e-05
Mission Hill 4.716102e-04 4.716102e-04
Roslindale 7.238668e-04 1.469669e-03
Roxbury 1.996117e-03 1.359992e-03
South Boston 1.425798e-04 1.316121e-04
South Boston / South Boston Waterfront 9.980587e-04 8.006405e-04
South End 4.825778e-04 7.019314e-04
West Roxbury 5.593516e-04 2.105794e-033. The Tentative Plan for Visualization
- Briefly describe what data analyses (please the special note on statistics in the next section) and visualizations you plan to conduct to answer the research questions you proposed above.
I would like to present bar graphs that can address the questions posed in part one.
#Frequency chart of service requests by department.
ggplot(Bos311, aes(subject)) +
geom_bar() +
coord_flip()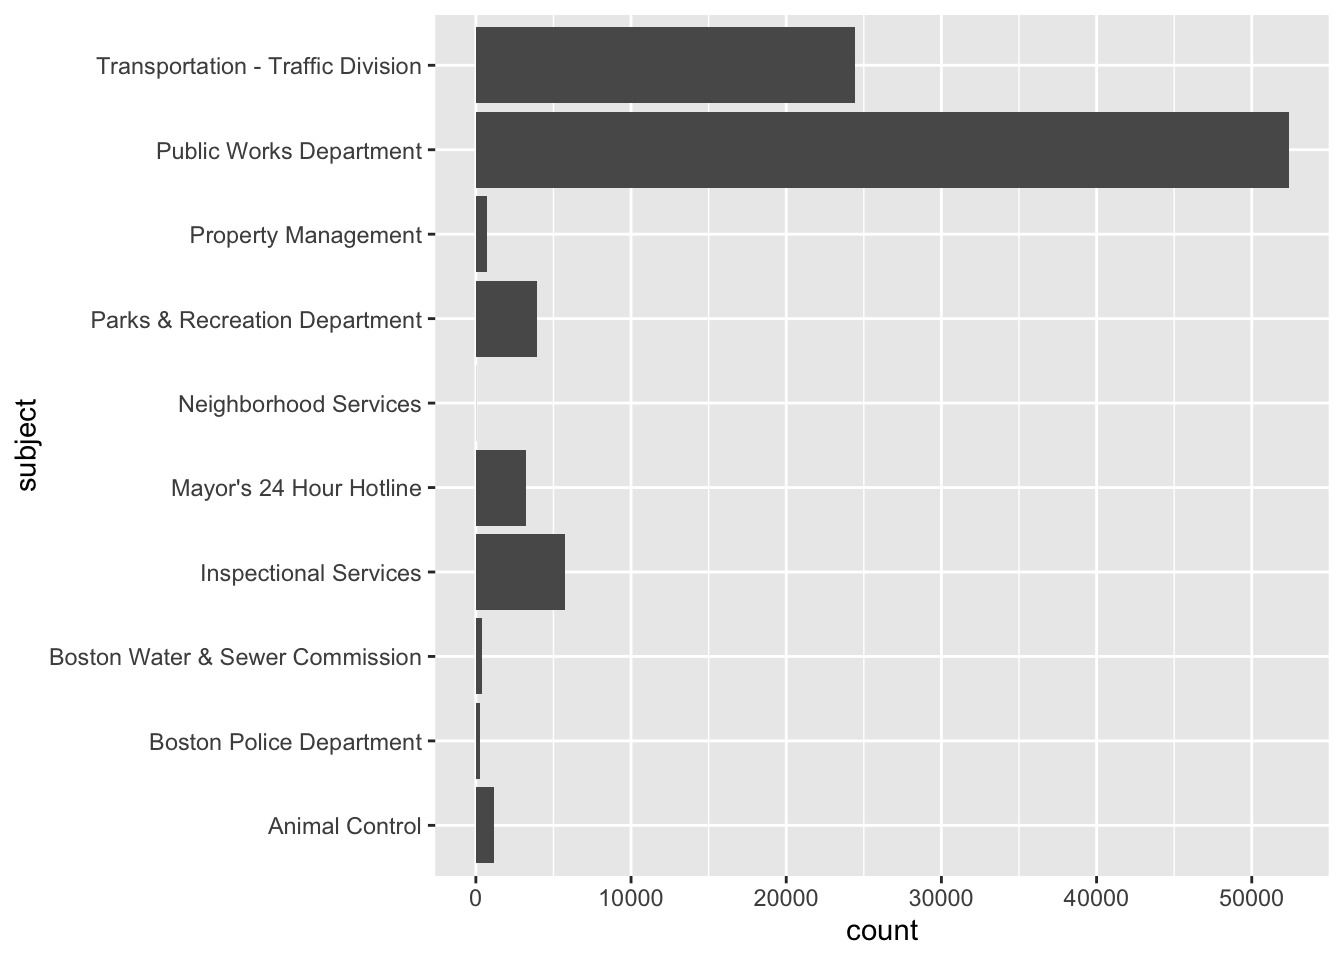
#Proportion of on time requests per neighborhood.
ggplot(Bos311_Neighbor, aes(neighborhood)) +
geom_bar(aes(fill = ontime), position = "fill") +
labs(title = "311 Service Requests for 2023", x = "Neighborhood", y = "Percent") +
coord_flip()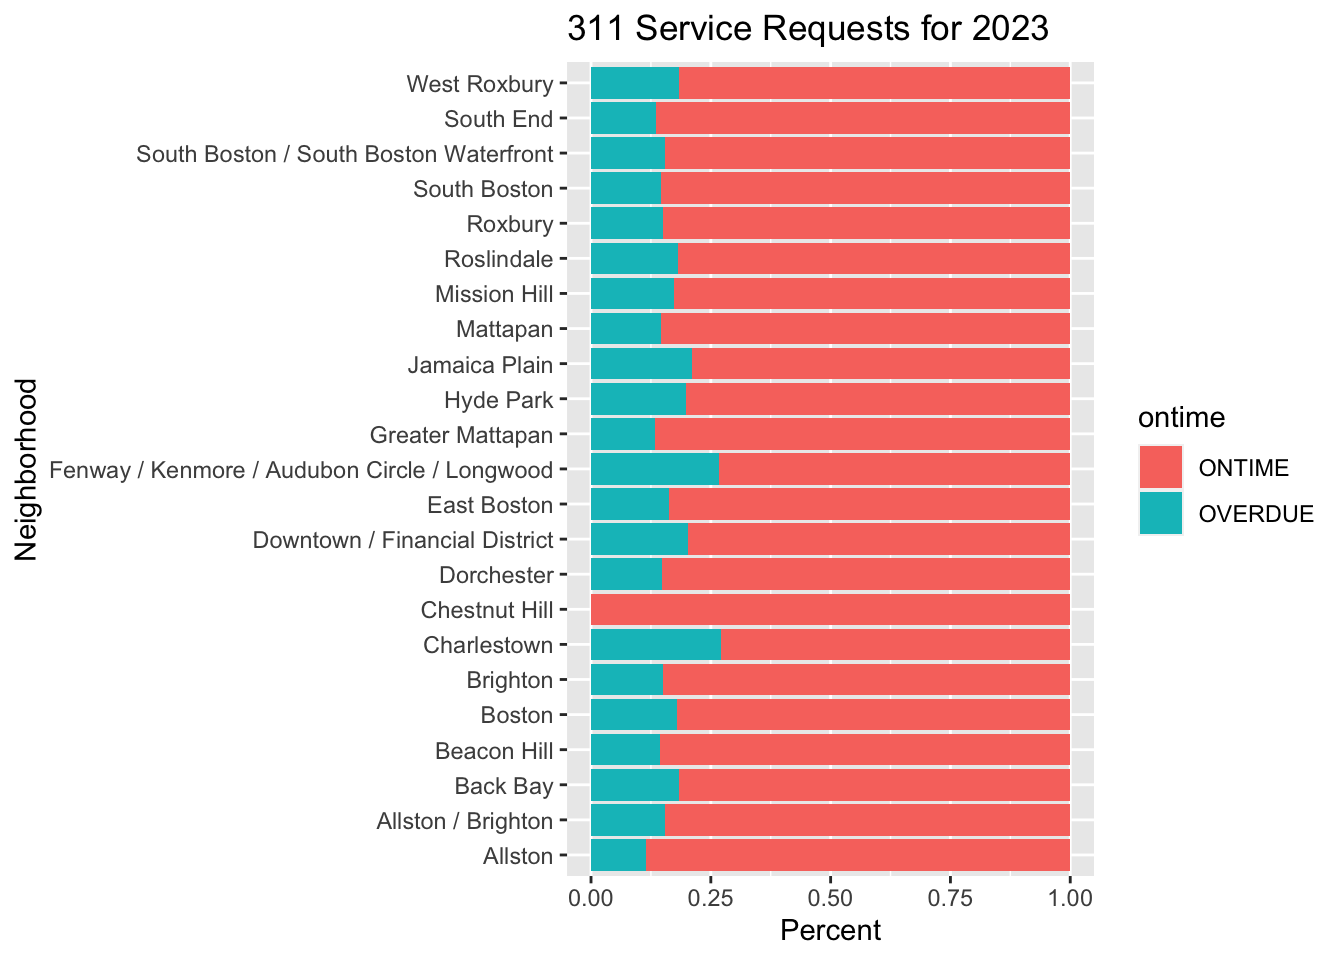
#Proportions of the ways residents and city employees make the service request.
ggplot(Bos311_Neighbor, aes(neighborhood)) +
geom_bar(aes(fill = source), position = "fill") +
labs(title = "311 Service Requests for 2023", x = "Neighborhood", y = "Percent") +
coord_flip()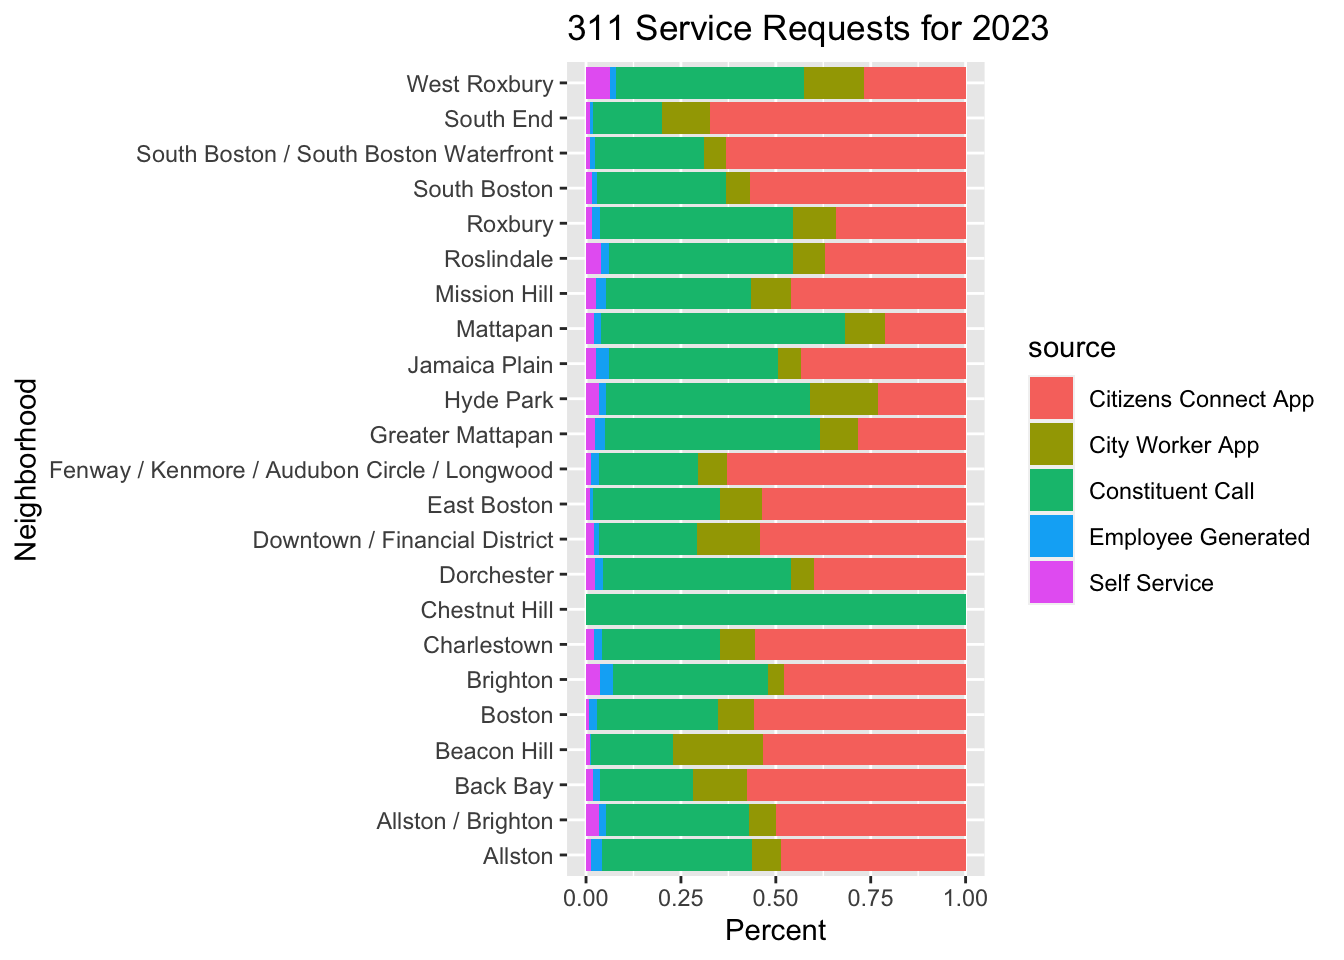
#Counts of the ways residents and city employees make the service request.
ggplot(Bos311_Neighbor, aes(subject)) +
geom_bar(aes(fill = source), position = position_dodge())+
labs(title = "311 Service Requests for 2023", x = "Neighborhood", y = "Frequency") +
coord_flip()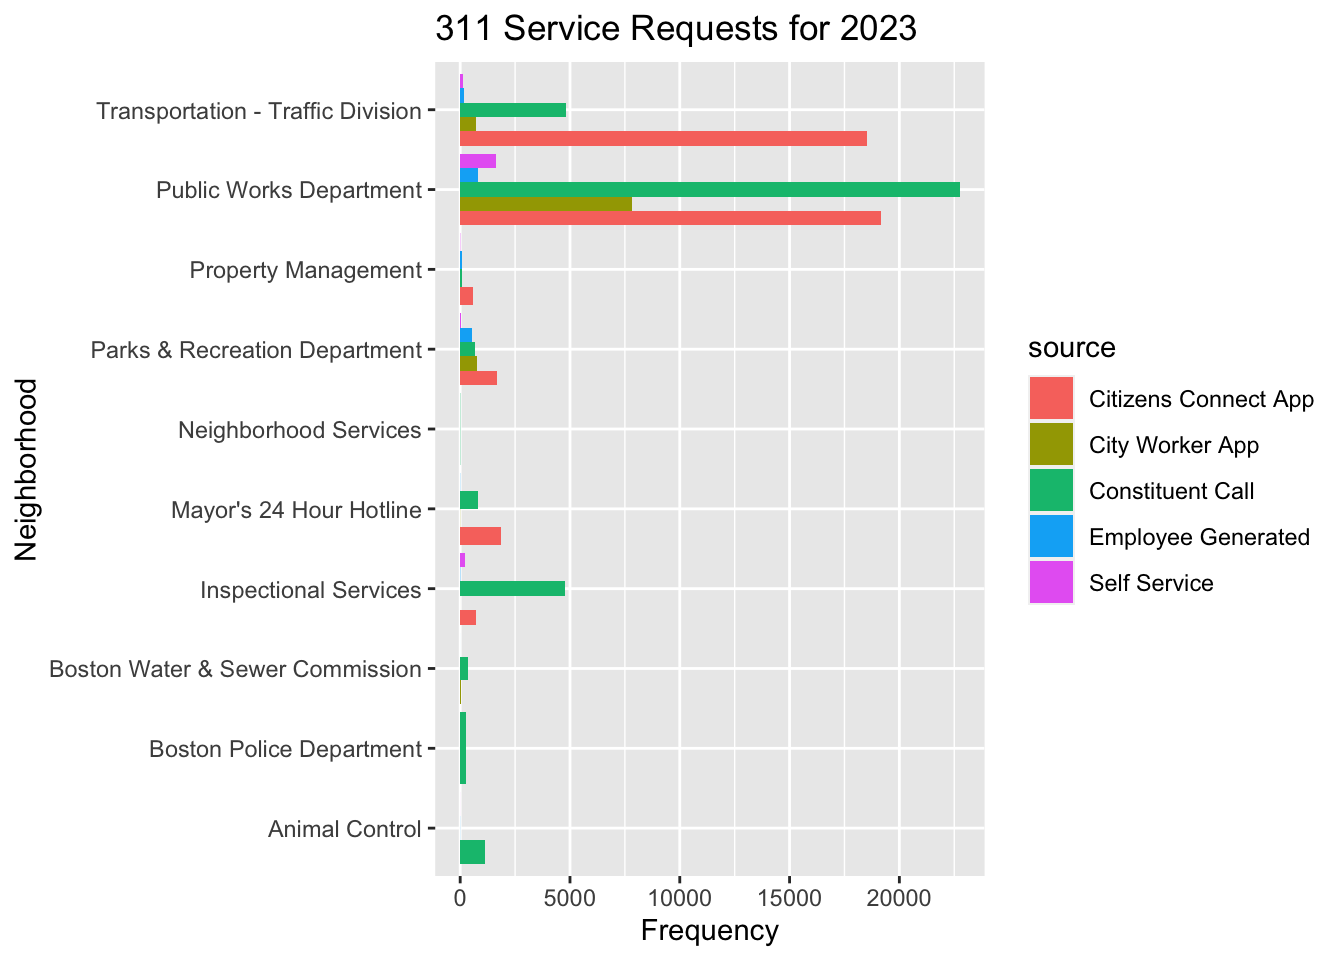
- Explain why you choose to conduct these specific data analyses and visualizations.
The bar graphs and tables can show if any variable, such as a type of request, particular department or neighborhoods are unusually high. Understanding the where the demands are can help the city be more efficient in terms of assigning resources, management, and communication.
- If you plan to conduct specific data analyses and visualizations, describe how do you need to process and prepare the tidy data.
Special Note on the role of statistics
After more in depth exploratory analysis, I may decide to conduct chi-square tests to see if there is an association between certain variables.