Code
library(tidyverse)
library(ggplot2)
library(lubridate)

knitr::opts_chunk$set(echo = TRUE)library(tidyverse)
library(ggplot2)
library(lubridate)
knitr::opts_chunk$set(echo = TRUE)library(readr)
#reading eggs_tidy csv data
eggs_data <- read_csv("_data/eggs_tidy.csv")Rows: 120 Columns: 6
── Column specification ────────────────────────────────────────────────────────
Delimiter: ","
chr (1): month
dbl (5): year, large_half_dozen, large_dozen, extra_large_half_dozen, extra_...
ℹ Use `spec()` to retrieve the full column specification for this data.
ℹ Specify the column types or set `show_col_types = FALSE` to quiet this message.#extracting all the column names
colnames(eggs_data)[1] "month" "year" "large_half_dozen"
[4] "large_dozen" "extra_large_half_dozen" "extra_large_dozen" #the dataset represents the price of particular quantity of eggs sold during specific time
#The quantity type has it's own column, Converting it to a single column below as they all represent the quantity/ carton size of eggs
eggs_tidy_data <- eggs_data%>%
pivot_longer(col = c(large_half_dozen, large_dozen, extra_large_half_dozen, extra_large_dozen),
names_to= "carton_size",
values_to= "price_per_pound")
eggs_tidy_data# A tibble: 480 × 4
month year carton_size price_per_pound
<chr> <dbl> <chr> <dbl>
1 January 2004 large_half_dozen 126
2 January 2004 large_dozen 230
3 January 2004 extra_large_half_dozen 132
4 January 2004 extra_large_dozen 230
5 February 2004 large_half_dozen 128.
6 February 2004 large_dozen 226.
7 February 2004 extra_large_half_dozen 134.
8 February 2004 extra_large_dozen 230
9 March 2004 large_half_dozen 131
10 March 2004 large_dozen 225
# … with 470 more rows#combining month and year to form a new column of data
#Please note - As no day is mentioned, it assumes the day to be 1st of the month specified
eggs_lubricate_data <- eggs_tidy_data%>%
mutate( date = str_c(month, year , sep = "-"),
date = my(date))
eggs_lubricate_data# A tibble: 480 × 5
month year carton_size price_per_pound date
<chr> <dbl> <chr> <dbl> <date>
1 January 2004 large_half_dozen 126 2004-01-01
2 January 2004 large_dozen 230 2004-01-01
3 January 2004 extra_large_half_dozen 132 2004-01-01
4 January 2004 extra_large_dozen 230 2004-01-01
5 February 2004 large_half_dozen 128. 2004-02-01
6 February 2004 large_dozen 226. 2004-02-01
7 February 2004 extra_large_half_dozen 134. 2004-02-01
8 February 2004 extra_large_dozen 230 2004-02-01
9 March 2004 large_half_dozen 131 2004-03-01
10 March 2004 large_dozen 225 2004-03-01
# … with 470 more rows# Visualization with Multiple Dimensions
#Histogram
eggs_lubricate_data%>%
ggplot(aes(x= price_per_pound,color = carton_size)) + geom_histogram() + labs(title = "Quantity of carton sold for a specific price", x = "Price Per Pound", y = "Amount")`stat_bin()` using `bins = 30`. Pick better value with `binwidth`.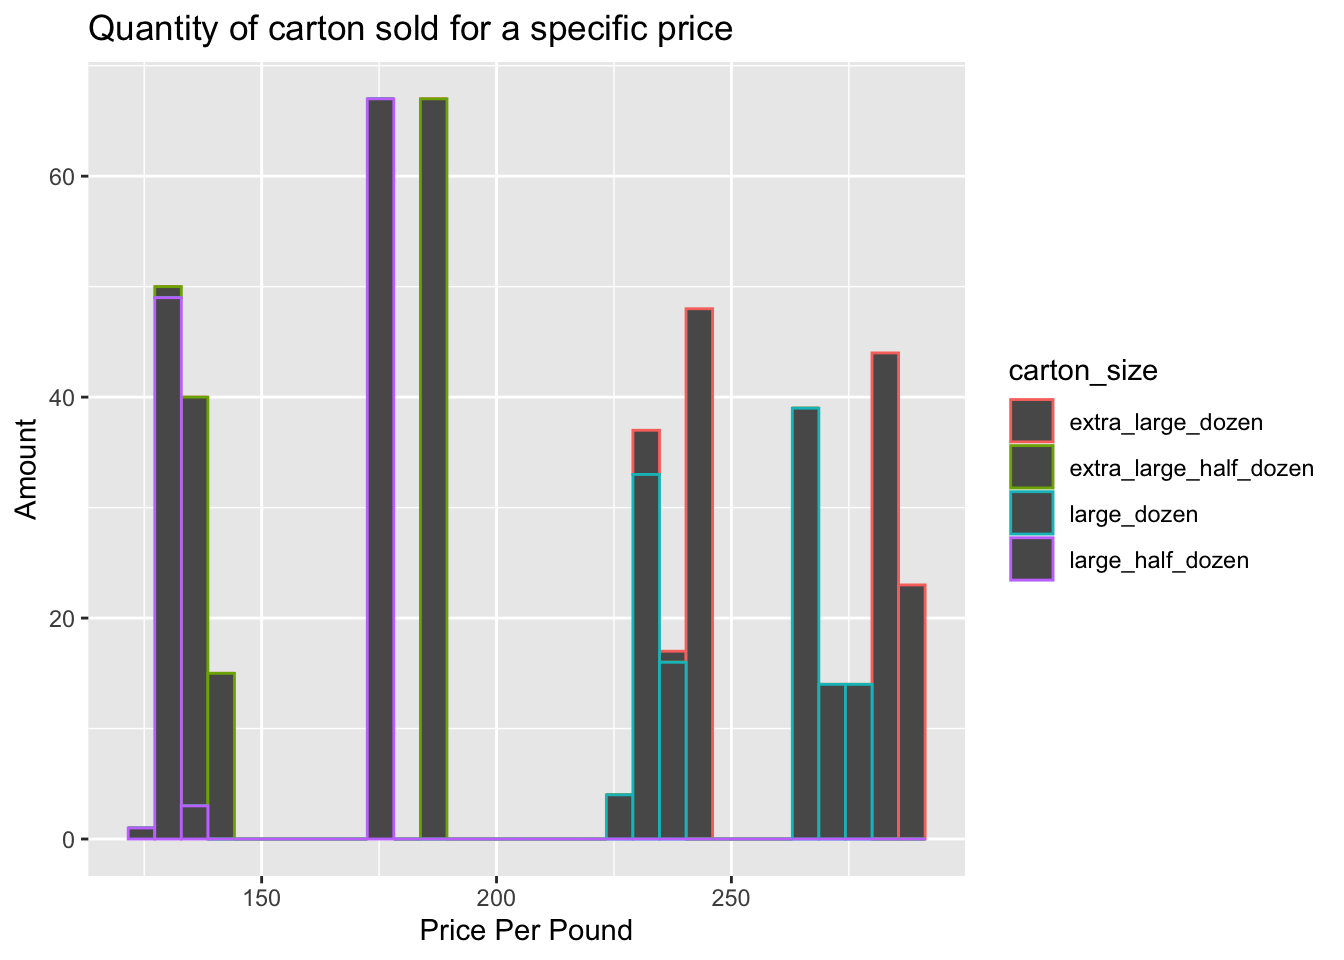
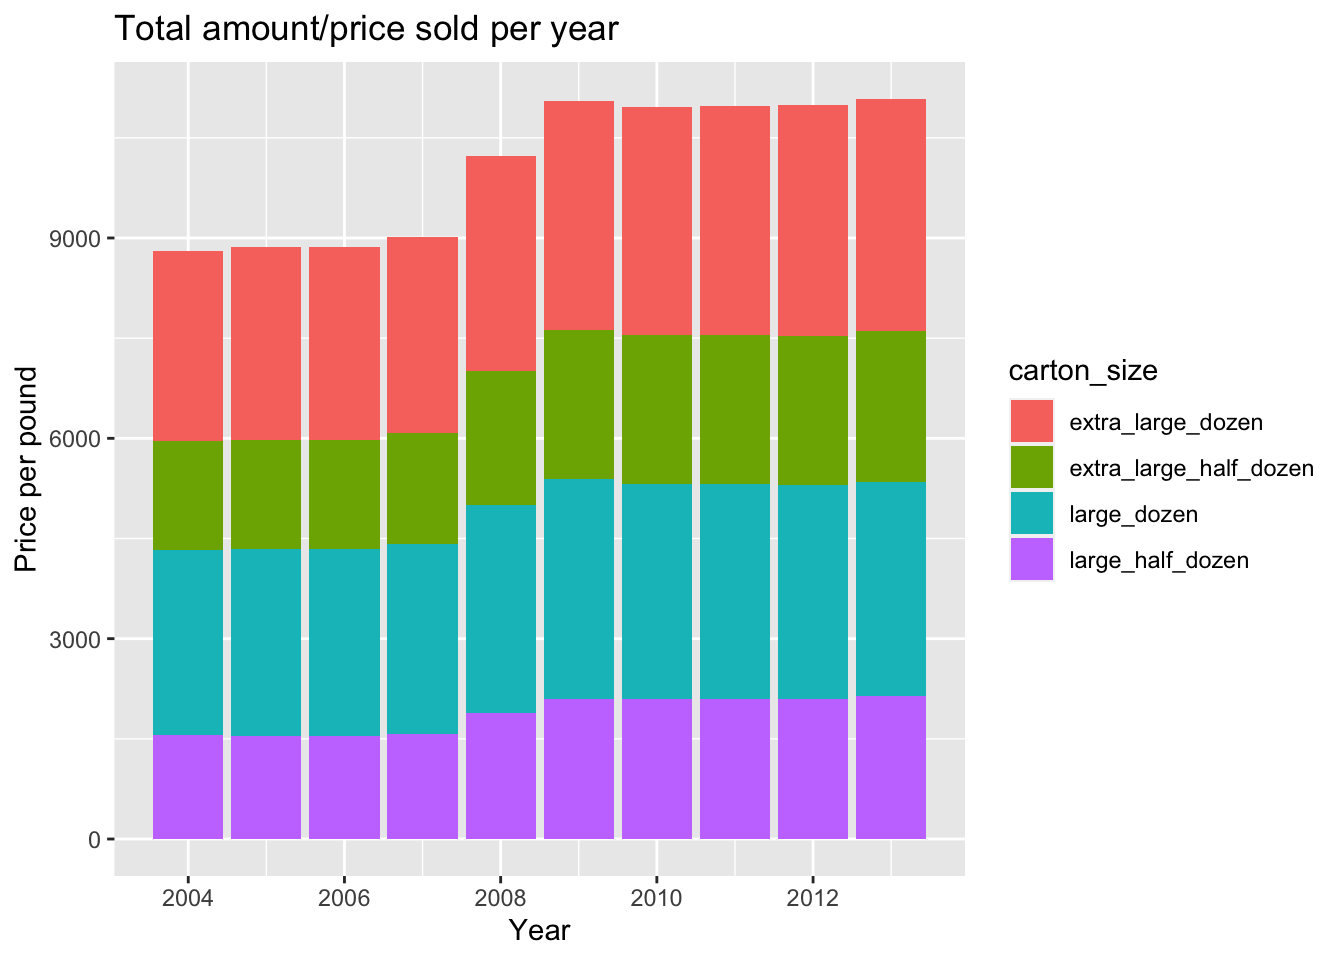
#Stacked Bar Graph
eggs_lubricate_data%>%
  ggplot(aes(x = year, y = price_per_pound, fill = carton_size)) + geom_bar(position = "stack", stat = "identity") + labs(title = "Total amount/price sold per year", x = "Year", y = "Price per pound")