Code
library(tidyverse)
library(readxl)

knitr::opts_chunk$set(echo = TRUE, warning=FALSE, message=FALSE)library(tidyverse)
library(readxl)
knitr::opts_chunk$set(echo = TRUE, warning=FALSE, message=FALSE)Today’s challenge is to:
pivot_longerWhen I use the read_excel data, it is not tidy for people to read. Therefore, I try my best to clean it. Finally the data would look like egg_tidy.csv. First of all, I skip the 4 columns. Then, I create one “date” row to copy the month data. Next, I used select to choose the data which I want. Moreover, use rename to let people easier read the data and more comfortable for using Pivot in the next part. Finally, category for the year and some strange data.
df <- read_excel("_data/organiceggpoultry.xls", sheet = "Data",skip=4)Describe the data, and be sure to comment on why you are planning to pivot it to make it “tidy” The data want to show the egg quality and chicken meat with price from 2004 to 2013 in USDA-certified organic eggs. In the Data, it give four different types of chicken and 5 different types of chicken part with the price per pound.
First of all, I skip the 4 columns. Then, I create one “date” row to copy the month data. Next, I used select to choose the data which I want. Moreover, use rename to let people easier read the data and more comfortable for using Pivot in the next part. Finally, category for the year and some strange data.
df2<-df%>%
  mutate(date=...1)%>%
  select(12,2:5)
df2<-df2%>%
  rename(xlarge_dozen=2,xlarge_halfdozen=3,large_dozen=4,large_halfdozen=5)
df2<-df2%>%
  mutate(date=str_remove(date," /1"))
egg<-df2%>%
  separate(date, into=c("month","year"),sep=" ")%>%
  fill(year)
egg
# A tibble: 120 × 6
month year xlarge_dozen xlarge_halfdozen large_dozen large_halfdozen
<chr> <chr> <dbl> <dbl> <dbl> <dbl>
1 Jan 2004 230 132 230 126
2 February 2004 230 134. 226. 128.
3 March 2004 230 137 225 131
4 April 2004 234. 137 225 131
5 May 2004 236 137 225 131
6 June 2004 241 137 231. 134.
7 July 2004 241 137 234. 134.
8 August 2004 241 137 234. 134.
9 September 2004 241 136. 234. 130.
10 October 2004 241 136. 234. 128.
# … with 110 more rowsI made the data become a tidy data. Then, I want to get the 2004 of the data.
egg_data2004<- filter(egg,year == "2004",)
egg_data2004
# A tibble: 12 × 6
month year xlarge_dozen xlarge_halfdozen large_dozen large_halfdozen
<chr> <chr> <dbl> <dbl> <dbl> <dbl>
1 Jan 2004 230 132 230 126
2 February 2004 230 134. 226. 128.
3 March 2004 230 137 225 131
4 April 2004 234. 137 225 131
5 May 2004 236 137 225 131
6 June 2004 241 137 231. 134.
7 July 2004 241 137 234. 134.
8 August 2004 241 137 234. 134.
9 September 2004 241 136. 234. 130.
10 October 2004 241 136. 234. 128.
11 November 2004 241 136. 234. 128.
12 December 2004 241 136. 234. 128.I want to compare each 4 types of eggs in January from 2004 to 2013. Finally, I want to compare the large dozen. It is clearly seen that we get the lowest price in 2004. Besides that, the price increased generally. It could make me understand that the commodity prices rising every year.
egg_Jan<-filter(egg,month == "Jan")
select(egg_Jan,1:2,5)
# A tibble: 10 × 3
month year large_dozen
<chr> <chr> <dbl>
1 Jan 2004 230
2 Jan 2005 234.
3 Jan 2006 234.
4 Jan 2007 234.
5 Jan 2008 237
6 Jan 2009 278.
7 Jan 2010 272.
8 Jan 2011 268.
9 Jan 2012 268.
10 Jan 2013 268.ggplot(egg_Jan,aes(year,large_dozen)) + geom_point()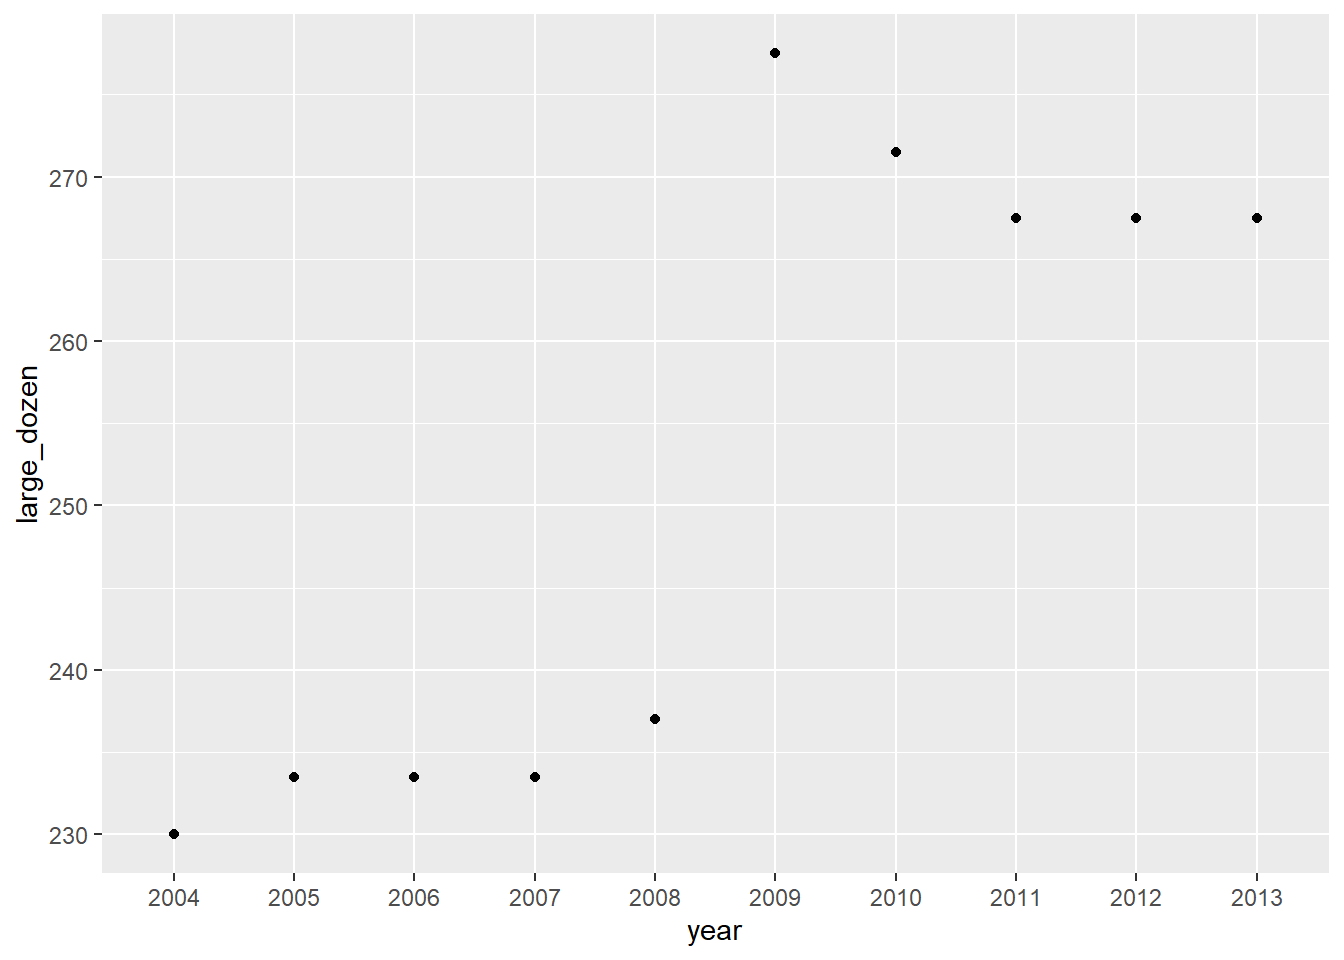
I used the Pivot to get the different types of the data with their cost. In col, there are large spelling in four of the types. Thus, we could use the for the type of the egg.
pivot_longer(egg, col= contains("large"),
              names_to="type_of_egg",
              values_to = "cost")
# A tibble: 480 × 4
month year type_of_egg cost
<chr> <chr> <chr> <dbl>
1 Jan 2004 xlarge_dozen 230
2 Jan 2004 xlarge_halfdozen 132
3 Jan 2004 large_dozen 230
4 Jan 2004 large_halfdozen 126
5 February 2004 xlarge_dozen 230
6 February 2004 xlarge_halfdozen 134.
7 February 2004 large_dozen 226.
8 February 2004 large_halfdozen 128.
9 March 2004 xlarge_dozen 230
10 March 2004 xlarge_halfdozen 137
# … with 470 more rows