library(tidyverse)
library(ggplot2)

knitr::opts_chunk$set(echo = TRUE, warning=FALSE, message=FALSE)
Challenge 8
challenge_8
snl
poobigan murugesan
Joining Data
Challenge Overview
Today’s challenge is to:
- read in multiple data sets, and describe the data set using both words and any supporting information (e.g., tables, etc)
- tidy data (as needed, including sanity checks)
- mutate variables as needed (including sanity checks)
- join two or more data sets and analyze some aspect of the joined data
(be sure to only include the category tags for the data you use!)
Read in data
Reading in the snl datasets:
snl_actors <- read.csv("_data/snl_actors.csv")
snl_casts <- read.csv("_data/snl_casts.csv")
snl_seasons <- read.csv("_data/snl_seasons.csv")head(snl_actors) aid url type gender
1 Kate McKinnon /Cast/?KaMc cast female
2 Alex Moffat /Cast/?AlMo cast male
3 Ego Nwodim /Cast/?EgNw cast unknown
4 Chris Redd /Cast/?ChRe cast male
5 Kenan Thompson /Cast/?KeTh cast male
6 Carey Mulligan /Guests/?3677 guest andydim(snl_actors)[1] 2306 4head(snl_casts) aid sid featured first_epid last_epid update_anchor n_episodes
1 A. Whitney Brown 11 True 19860222 NA False 8
2 A. Whitney Brown 12 True NA NA False 20
3 A. Whitney Brown 13 True NA NA False 13
4 A. Whitney Brown 14 True NA NA False 20
5 A. Whitney Brown 15 True NA NA False 20
6 A. Whitney Brown 16 True NA NA False 20
season_fraction
1 0.4444444
2 1.0000000
3 1.0000000
4 1.0000000
5 1.0000000
6 1.0000000dim(snl_casts)[1] 614 8head(snl_seasons) sid year first_epid last_epid n_episodes
1 1 1975 19751011 19760731 24
2 2 1976 19760918 19770521 22
3 3 1977 19770924 19780520 20
4 4 1978 19781007 19790526 20
5 5 1979 19791013 19800524 20
6 6 1980 19801115 19810411 13dim(snl_seasons)[1] 46 5Briefly describe the data
These three datasets contain information pertaining to actors, casts, and seasons associated with the television program “Saturday Night Live.” From the dimensions of these dataframes we can observe that Saturday Night Live featured a total of 2306 actors and spanned across 46 seasons. The dataset named “snl_actors” contains specific actor-related information, while the “snl_casts” dataset comprises information about the cast members’ appearances on the show, including details such as their featured episodes, number of appearances, and other relevant data. Lastly, the “snl_seasons” dataset has information related to each season of the show, such as the initial and final episodes, the year of airing, and the total number of episodes within each respective season.
Tidy Data (as needed)
The data is already tidy.
Join Data
Joining actors and casts dataframes with the aid column and using select to keep useful columns, followed by joining the snl_casts_actors dataframe with the seasons dataframe with the sid column. The resulting dataframe can be used to explore the relationship between the various variables.
snl_casts_actors <- snl_casts %>%
  left_join(snl_actors, by = "aid") %>%
  select(sid, type, gender, n_episodes, featured)

snl_join <- snl_seasons %>%
  left_join(snl_casts_actors, by = "sid")
head(snl_join)
sid year first_epid last_epid n_episodes.x type gender n_episodes.y featured
1 1 1975 19751011 19760731 24 cast female 24 False
2 1 1975 19751011 19760731 24 cast male 4 False
3 1 1975 19751011 19760731 24 cast female 24 False
4 1 1975 19751011 19760731 24 cast male 24 False
5 1 1975 19751011 19760731 24 cast female 24 False
6 1 1975 19751011 19760731 24 cast male 1 Falsedim(snl_join)[1] 614 9Since ours is a left_join no. of columns must be same as snl_join which is 614.
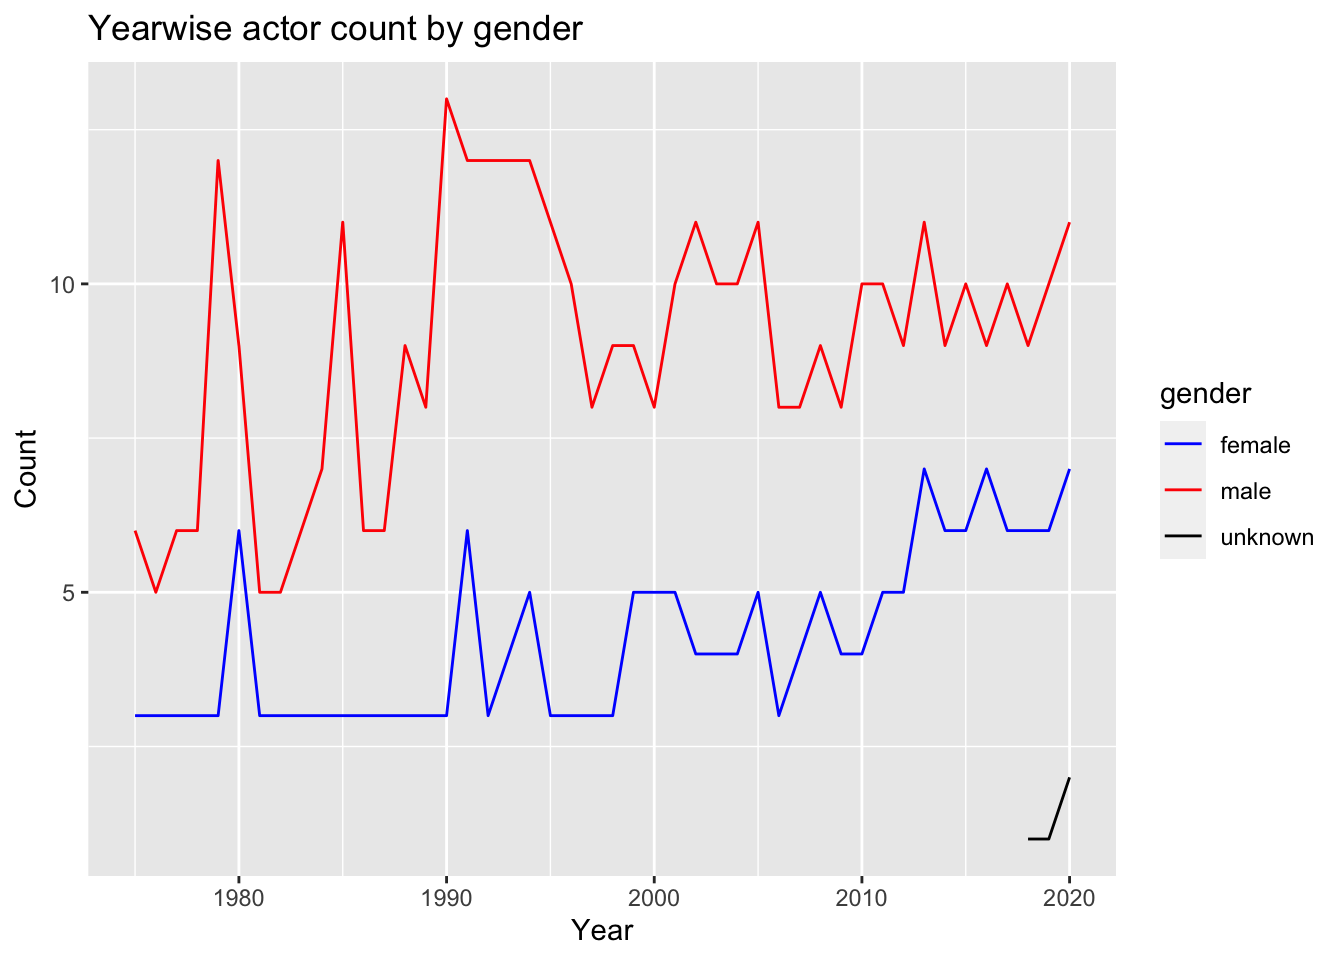
Visualization
Plotting the number of actors on snl shows based on gender over the years.
snl_join<-snl_join %>%
  group_by(sid, year, gender) %>%
  summarise(count = n(), groups = 'drop')
snl_join %>%
ggplot(aes(year, count, col = gender)) +
geom_line() +
ylab("Count") +
xlab("Year")+
ggtitle("Yearwise actor count by gender")+
scale_colour_manual(values= c("#0000FF","#FF0000", "#000000"
))