options(warn = -1)Final Project
Spotify Songs
Final Project
Analysis of Spotify Songs
library(tidyverse)── Attaching packages ─────────────────────────────────────── tidyverse 1.3.2 ──
✔ ggplot2 3.4.2 ✔ purrr 1.0.1
✔ tibble 3.2.1 ✔ dplyr 1.1.2
✔ tidyr 1.3.0 ✔ stringr 1.5.0
✔ readr 2.1.4 ✔ forcats 1.0.0
── Conflicts ────────────────────────────────────────── tidyverse_conflicts() ──
✖ dplyr::filter() masks stats::filter()
✖ dplyr::lag() masks stats::lag()library(magrittr)
Attaching package: 'magrittr'

The following object is masked from 'package:purrr':

    set_names

The following object is masked from 'package:tidyr':

extractlibrary(plotly)
Attaching package: 'plotly'

The following object is masked from 'package:ggplot2':

    last_plot

The following object is masked from 'package:stats':

    filter

The following object is masked from 'package:graphics':

layoutlibrary(dplyr)
library(tm)Loading required package: NLP
Attaching package: 'NLP'
The following object is masked from 'package:ggplot2':
annotatelibrary(wordcloud)Loading required package: RColorBrewerlibrary(corrplot)corrplot 0.92 loadedlibrary(cowplot)Background and Introduction:
Spotify has emerged as one of the leading digital music, podcast, and streaming platforms globally. With millions of songs and podcasts available to its vast user base, understanding the factors that contribute to a song’s popularity and exploring the relationship between music features and genres can provide valuable insights for both users and artists.
The Spotify dataset was chosen due to its relevance and significance in the music streaming industry. Spotify is a widely used platform with a vast collection of songs and a diverse user base, making it an ideal dataset to analyze and explore factors influencing song popularity and genre classifications. This dataset offers valuable insights into the dynamics of the music industry and can provide meaningful findings for both artists and music enthusiasts.
The purpose of this study is to analyze the Spotify data and delve into the factors that influence the popularity of songs. By examining the relationship between music features, such as loudness, speechiness, danceability, and genre/sub-genre classification, we aim to gain a deeper understanding of what makes a song popular. Furthermore, we seek to identify trends in these features over the years and explore any correlations that may exist among them.
Research Questions:
- How do music features, both categorical and numerical, relate to the popularity of songs on Spotify?
- What are the characteristics and classifications of different genres according to Spotify?
- Do specific factors make a song more or less popular on the platform?
- How have the music features evolved over time, and are there any noticeable trends?
- Are there any correlations among the different features, and how do they impact a song’s popularity?
By addressing these research questions, we aim to develop a model that can predict the popularity score of a song based on its features. This knowledge can be instrumental for artists in understanding the factors to focus on when composing music to maximize their chances of popularity. Additionally, we hope to build a recommender system that suggests similar songs based on user preferences, aiding in the discovery of new songs and facilitating playlist creation.
Understanding the Data:
spotify_songs <- readr::read_csv('https://raw.githubusercontent.com/rfordatascience/tidytuesday/master/data/2020/2020-01-21/spotify_songs.csv', show_col_types = FALSE)
View(spotify_songs)dim(spotify_songs)[1] 32833 23tail(spotify_songs,5)summary(spotify_songs) track_id track_name track_artist track_popularity
Length:32833 Length:32833 Length:32833 Min. : 0.00
Class :character Class :character Class :character 1st Qu.: 24.00
Mode :character Mode :character Mode :character Median : 45.00
Mean : 42.48
3rd Qu.: 62.00
Max. :100.00
track_album_id track_album_name track_album_release_date
Length:32833 Length:32833 Length:32833
Class :character Class :character Class :character
Mode :character Mode :character Mode :character
playlist_name playlist_id playlist_genre playlist_subgenre
Length:32833 Length:32833 Length:32833 Length:32833
Class :character Class :character Class :character Class :character
Mode :character Mode :character Mode :character Mode :character
danceability energy key loudness
Min. :0.0000 Min. :0.000175 Min. : 0.000 Min. :-46.448
1st Qu.:0.5630 1st Qu.:0.581000 1st Qu.: 2.000 1st Qu.: -8.171
Median :0.6720 Median :0.721000 Median : 6.000 Median : -6.166
Mean :0.6548 Mean :0.698619 Mean : 5.374 Mean : -6.720
3rd Qu.:0.7610 3rd Qu.:0.840000 3rd Qu.: 9.000 3rd Qu.: -4.645
Max. :0.9830 Max. :1.000000 Max. :11.000 Max. : 1.275
mode speechiness acousticness instrumentalness
Min. :0.0000 Min. :0.0000 Min. :0.0000 Min. :0.0000000
1st Qu.:0.0000 1st Qu.:0.0410 1st Qu.:0.0151 1st Qu.:0.0000000
Median :1.0000 Median :0.0625 Median :0.0804 Median :0.0000161
Mean :0.5657 Mean :0.1071 Mean :0.1753 Mean :0.0847472
3rd Qu.:1.0000 3rd Qu.:0.1320 3rd Qu.:0.2550 3rd Qu.:0.0048300
Max. :1.0000 Max. :0.9180 Max. :0.9940 Max. :0.9940000
liveness valence tempo duration_ms
Min. :0.0000 Min. :0.0000 Min. : 0.00 Min. : 4000
1st Qu.:0.0927 1st Qu.:0.3310 1st Qu.: 99.96 1st Qu.:187819
Median :0.1270 Median :0.5120 Median :121.98 Median :216000
Mean :0.1902 Mean :0.5106 Mean :120.88 Mean :225800
3rd Qu.:0.2480 3rd Qu.:0.6930 3rd Qu.:133.92 3rd Qu.:253585
Max. :0.9960 Max. :0.9910 Max. :239.44 Max. :517810 colnames(spotify_songs) [1] "track_id" "track_name"
[3] "track_artist" "track_popularity"
[5] "track_album_id" "track_album_name"
[7] "track_album_release_date" "playlist_name"
[9] "playlist_id" "playlist_genre"
[11] "playlist_subgenre" "danceability"
[13] "energy" "key"
[15] "loudness" "mode"
[17] "speechiness" "acousticness"
[19] "instrumentalness" "liveness"
[21] "valence" "tempo"
[23] "duration_ms" Description of Data:
The Spotify dataset is a collection of information on songs available on the music streaming platform. The case of this dataset is an individual song, represented by each row in the dataset. The dataset includes audio features (e.g., loudness, speechiness, danceability) and popularity score information for over 170,000 songs available on Spotify. The songs were released between 1921 and 2020 and cover a variety of genres and sub-genres. Each song has a unique Spotify ID and is associated with an artist, album, and release year. The dataset includes information on the popularity score of the song, which ranges from 0 to 100 and is based on the number of plays and user interactions. The dataset also includes categorical variables such as key and mode, which describe the tonality of the song.In addition, the dataset also provides information on user behavior on the platform, such as the number of times a song has been played, skipped, or saved. Overall, the Spotify dataset offers a comprehensive view of the music streaming landscape and can be used to identify trends and patterns in music consumption and preferences.
Here is a brief description of each variable in the dataset:
track_name: Name of the song
track_id: Unique identifier for the song
artist_name: Name of the artist who recorded the song
artist_id: Unique identifier for the artist
album_name: Name of the album that the song is from
album_id: Unique identifier for the album
popularity: The popularity of the song on a scale of 0 to 100, where 100 is the most popular.
duration_ms: The duration of the song in milliseconds
explicit: Whether or not the song contains explicit lyrics (0 = No, 1 = Yes)
danceability: The measure of how suitable a track is for dancing based on a combination of musical elements including tempo, rhythm stability, beat strength, and overall regularity energy: A measure of the intensity and activity of the music, based on a combination of musical elements including dynamic range, perceived loudness, timbre, onset rate, and general entropy
key: The estimated key of the song (C=0, C#=1, D=2, D#=3, E=4, F=5, F#=6, G=7, G#=8, A=9, A#=10, B=11)
loudness: The overall loudness of the track in decibels (dB)
mode: The mode (major or minor) of the song (0 = Minor, 1 = Major)
speechiness: The presence of spoken words in a track
acousticness: A confidence measure of whether the track is acoustic or not
instrumentalness: A confidence measure of whether the track contains no vocals
liveness: A confidence measure of whether the track was recorded live or not
valence: A measure of the musical positiveness conveyed by a track
tempo: The overall estimated tempo of a track in beats per minute (BPM)
Data Cleaning:
Checking for NULLs/Missing values
colSums(is.na(spotify_songs)) track_id track_name track_artist
0 5 5
track_popularity track_album_id track_album_name
0 0 5
track_album_release_date playlist_name playlist_id
0 0 0
playlist_genre playlist_subgenre danceability
0 0 0
energy key loudness
0 0 0
mode speechiness acousticness
0 0 0
instrumentalness liveness valence
0 0 0
tempo duration_ms
0 0 Null Values: We can observe that the variables track_name, track_album_name, and track_artist have 5 instances of missing data. Out of 32833 rows, we can remove 5 rows without any significant impact on our data.
Duplicate Values: Upon examining the dataset, it became apparent that certain songs were included more than once. Specifically, out of the 32,833 songs in the dataset, only 28,352 songs are unique. These repeated songs are identified by the same ‘track_id’, but a different ‘playlist_id’. Therefore, to remove these duplicates, we will delete the rows with repeated ‘track_id’ values. Since the ‘track_id’ serves as a unique identifier for each song, and the other numeric and categorical features associated with each song remain consistent across all instances of that song, this method of deduplication will be effective.
Removing NULL from data
spotify_songs <- na.omit(spotify_songs)Changing datatype of some categorical columns from string to factor.
spotify_songs <-spotify_songs %>%
  mutate(playlist_genre=as.factor(spotify_songs$playlist_genre),
         playlist_subgenre=as.factor(spotify_songs$playlist_subgenre),
         mode=as.factor(mode),
         key=as.factor(key))
Removing Duplicate Data
spotify_songs <- spotify_songs[!duplicated(spotify_songs$track_id),]
dim(spotify_songs)
[1] 28352 23Dropping Redundant Columns
spotify_songs <- spotify_songs %>% select(-c(track_id, track_album_id,
                                             track_album_name,
                                             playlist_id, playlist_name,
                                             playlist_subgenre))
Converting date to string and creating a new column ‘year’
spotify_songs$track_album_release_date <- as.character(spotify_songs$track_album_release_date, "%m/%d/%Y")
spotify_songs$year <- substr(spotify_songs$track_album_release_date,1,4)
Changing data type of year column
spotify_songs$year <- as.numeric(spotify_songs$year)To view Cleaned Data
output_data <- head(spotify_songs, n = 100)
View(output_data)
Exploratory Data Analysis:
spotify_songs %>% group_by(Genre = playlist_genre) %>%
  summarise(No_of_tracks = n()) %>%
arrange(desc(No_of_tracks)) %>% knitr::kable()| Genre | No_of_tracks |
|---|---|
| rap | 5398 |
| pop | 5132 |
| edm | 4877 |
| r&b | 4504 |
| rock | 4305 |
| latin | 4136 |
The above code groups Spotify songs by genre and calculates the number of tracks for each genre, then arranges the genres by the number of tracks in descending order and displays them in a table using the ‘knitr’ package’s ‘kable’ function.
Popularity Across Genres
popularity_genre<- ggplot(spotify_songs, aes(x = playlist_genre, y =
                                                 track_popularity)) +
        geom_boxplot() +
        coord_flip() +
        labs(title = "Popularity across different genres", x = "Genres", y = "Popularity")

ggplotly(popularity_genre)
The above code generates a box plot using the to display the distribution of track popularity across different genres of Spotify songs.
Artists With Most Track Releases
artists_tracks <- spotify_songs %>%
  group_by(Artist = track_artist) %>%
  summarise(No_of_tracks = n()) %>%
  arrange(desc(No_of_tracks)) %>%
  top_n(15, wt = No_of_tracks) %>%
  ggplot(aes(x = reorder(Artist, -No_of_tracks), y = No_of_tracks)) +
  geom_bar(stat = "identity") +
  geom_text(aes(label = No_of_tracks), vjust = -0.5, color = "RED", size = 3) +
  coord_flip() +
  labs(title = "Artists With Most Track Releases", x = "Artist Name", y = "Number of Tracks")

ggplotly(artists_tracks)
The above code groups Spotify songs by artist and calculates the number of tracks released by each artist in the descending order. It then selects the top 15 artists with the most track releases, creates a bar chart using the ‘ggplot2’ package.
Most Frequent Track Names
#Create a vector and a corpus containing only the text
track_name <- spotify_songs$track_name
corpus_ <- Corpus(VectorSource(track_name))


#clean text data - remove suffix and adjectives
corpus_ <- corpus_ %>%
        tm_map(removeNumbers) %>%
        tm_map(removePunctuation) %>%
        tm_map(stripWhitespace)
corpus_ <- tm_map(corpus_, content_transformer(tolower))
corpus_ <- tm_map(corpus_, removeWords, stopwords("english"))
corpus_ <- tm_map(corpus_, removeWords,c("feat","edit","remix","remastered","remaster","radio","version","original","mix"))
dtm <- TermDocumentMatrix(corpus_)
dtm_matrix <- as.matrix(dtm)
words <- sort(rowSums(dtm_matrix),decreasing=TRUE)
data <- data.frame(word = names(words),freq=words)

#generate the word cloud
wordcloud(words = data$word, freq = data$freq,scale=c(8,0.25), min.freq = 1,
          max.words=150, random.order=FALSE, rot.per=0.25,
          colors=brewer.pal(8, "Dark2"))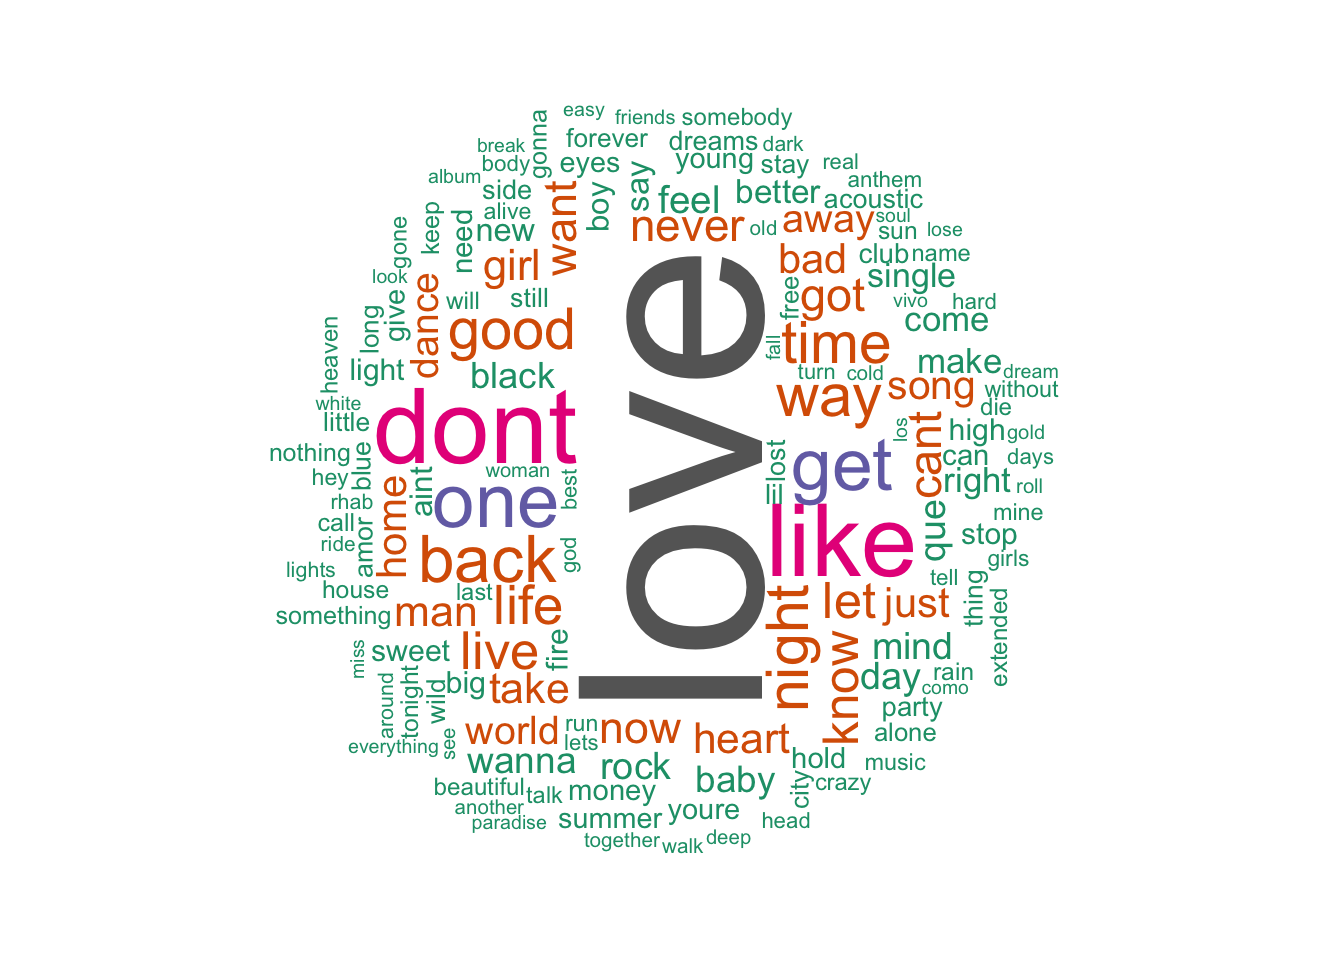
The above code creates a corpus from the track names in the Spotify dataset, cleans the text data, generates a term-document matrix, calculates word frequencies, and generates a word cloud visualization.
Song Release Over the Years
years <- spotify_songs %>%
  select(year) %>%
  filter(year<2020) %>%
  group_by(year) %>%
  summarise(count = n())

#plot of tracks released across the years

tracks_vs_year <- ggplot(years,aes(x = year, y = count,group = 1)) +
  geom_line() +
  theme(legend.position = "none",axis.text.x = element_text(angle = 90, hjust = 1)) +
  labs(title = "Number of Songs released across the Years", x = "Year",
       y = "Number of Songs Released")

ggplotly(tracks_vs_year)
The above code analyzes the count of tracks released each year from the Spotify dataset. It creates a line plot showing the release of songs across the years, with the x-axis representing the year and the y-axis representing the count of songs released. The plot is then converted into an interactive plot using ggplotly for enhanced exploration of the data.
Popularity of Genres Over the Decades
## Find popular genres over the decades
spotify_1 <- spotify_songs %>%
  select(track_popularity,year,playlist_genre) %>%
  mutate(year = as.numeric(spotify_songs$year), decade = year - (year %% 10))

spotify_2 <- spotify_1 %>%
  filter(track_popularity > 50) %>%
  group_by(decade, playlist_genre) %>%
  summarise(count = n())
`summarise()` has grouped output by 'decade'. You can override using the
`.groups` argument.decadewise_tracks_genre <- spotify_2 %>%
group_by(decade) %>%
ggplot(aes(fill = playlist_genre, x = decade, y = count)) +
geom_bar(position= "stack", stat = "identity") +
labs(title = "Popular genre over the decades", x = "Decade", y = "Popularity of Genre")
ggplotly(decadewise_tracks_genre)The above code analyzes the popularity of genres over the decades using the Spotify dataset. It filters the data to include only tracks with a popularity score above 50 and groups the tracks by decade and playlist genre. A stacked bar chart is created to visualize the count of tracks for each genre in each decade. The chart provides insights into the popular genres over time.
Feature analysis
The provided code snippets analyze various features of songs in the Spotify dataset to gain insights into their popularity, characteristics, and trends. The first snippet examines the release of songs over the years, revealing the growth and activity in the music industry. The second snippet identifies popular genres across decades, showcasing the evolution and dominance of different genres over time. The third snippet analyzes the track names to uncover common themes and naming conventions in popular songs. Together, these feature analyses provide valuable insights into the factors influencing song popularity, changing musical preferences, and patterns in song titles, contributing to a better understanding of the dynamics of the music industry.
Co-relation With Different Musical Features
corr_spotify <- spotify_songs %>%
  select(track_popularity, danceability, energy, loudness, speechiness,
         acousticness, instrumentalness, liveness, valence, tempo, duration_ms)

correlation_matrix <- cor(corr_spotify)
corrplot(correlation_matrix, type = "lower")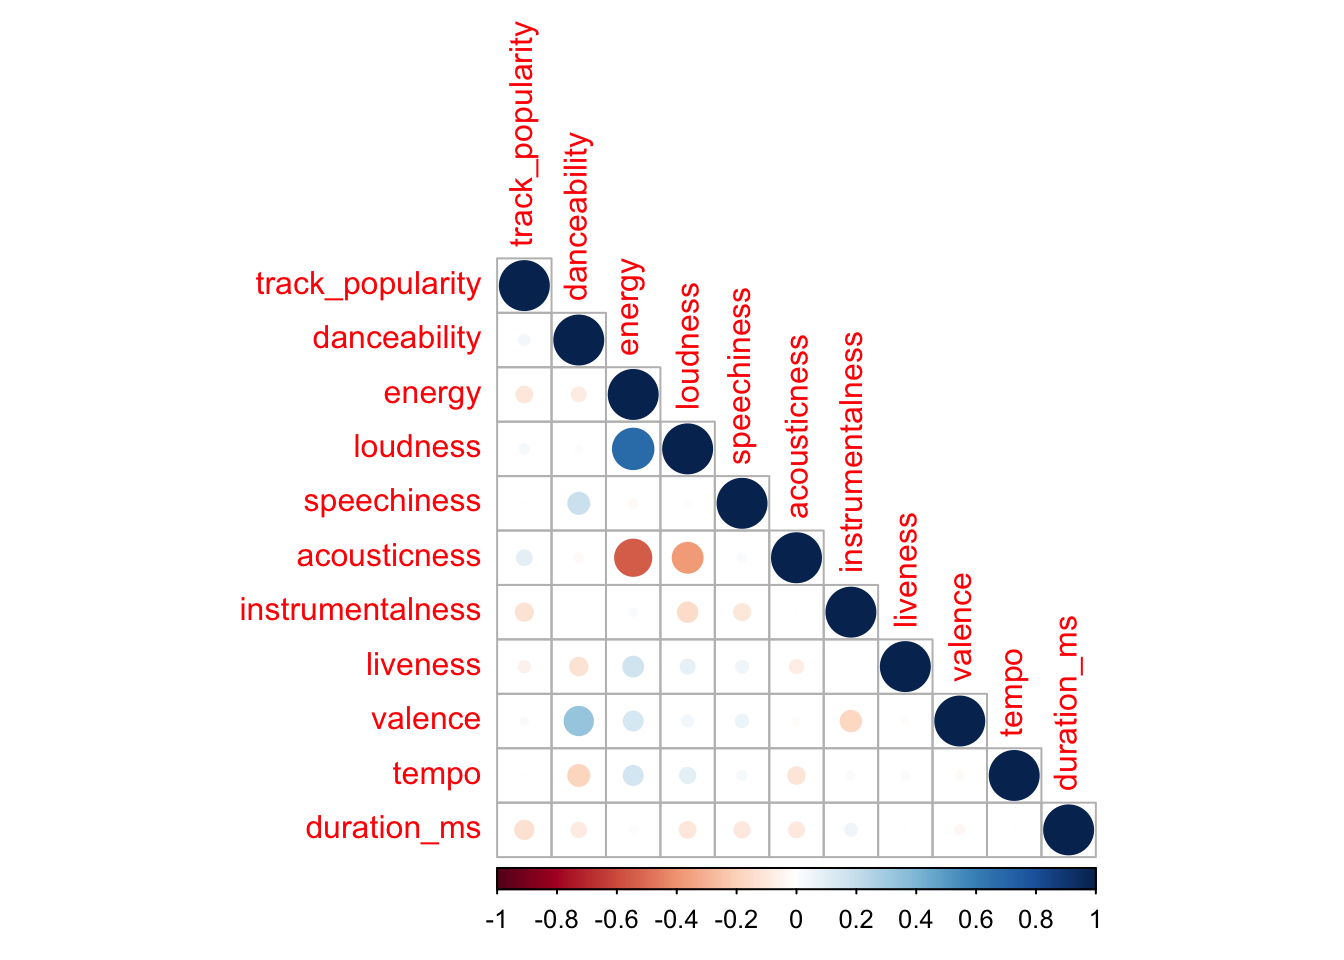
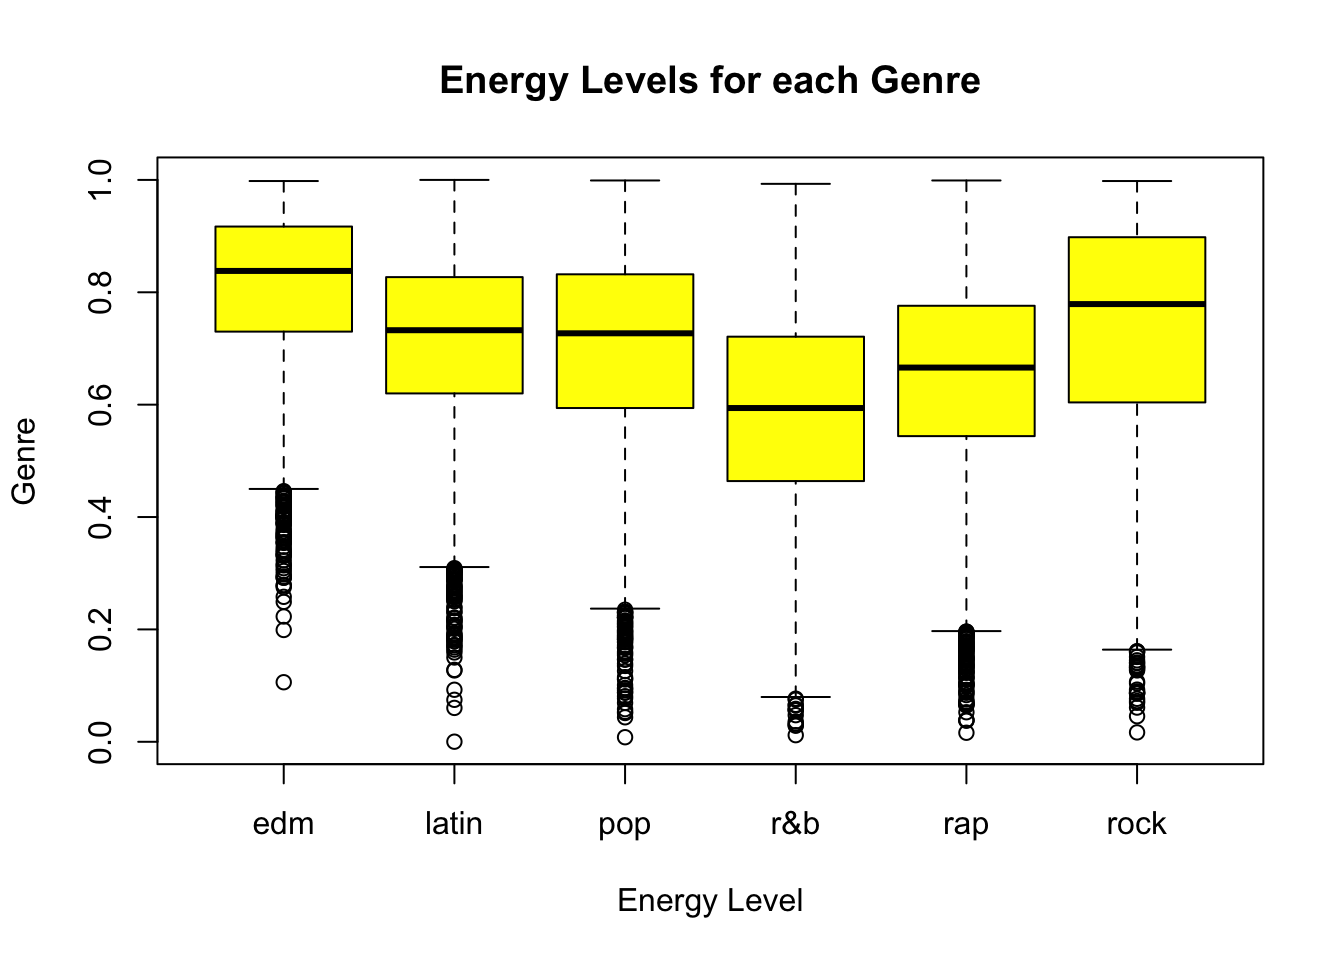
Energy levels per Genre
boxplot(energy ~ playlist_genre, data = spotify_songs,
        main = "Energy Levels for each Genre",
        xlab = "Energy Level",
        ylab = "Genre",
        col = "Yellow",
        border = "black",
        horizontal = FALSE
)
trend_chart <- function(arg){
trend_change <- spotify_songs %>% filter(year>2010) %>% group_by(year) %>% summarize_at(vars(all_of(arg)), funs(Average = mean))


chart <- ggplot(data = trend_change, aes(x = year, y = Average)) +
geom_line(color = "bLack", size = 1) +
scale_x_continuous(breaks=seq(2011, 2020, 1)) + scale_y_continuous(name=paste("",arg,sep=""))
return(chart)
}
track_popularity<-trend_chart("track_popularity")
danceability<-trend_chart("danceability")
energy<-trend_chart("energy")
loudness<-trend_chart("loudness")
duration_ms<-trend_chart("duration_ms")
speechiness<-trend_chart("speechiness")


plot_grid(track_popularity, danceability, energy, loudness, duration_ms, speechiness,ncol = 2, label_size = 1)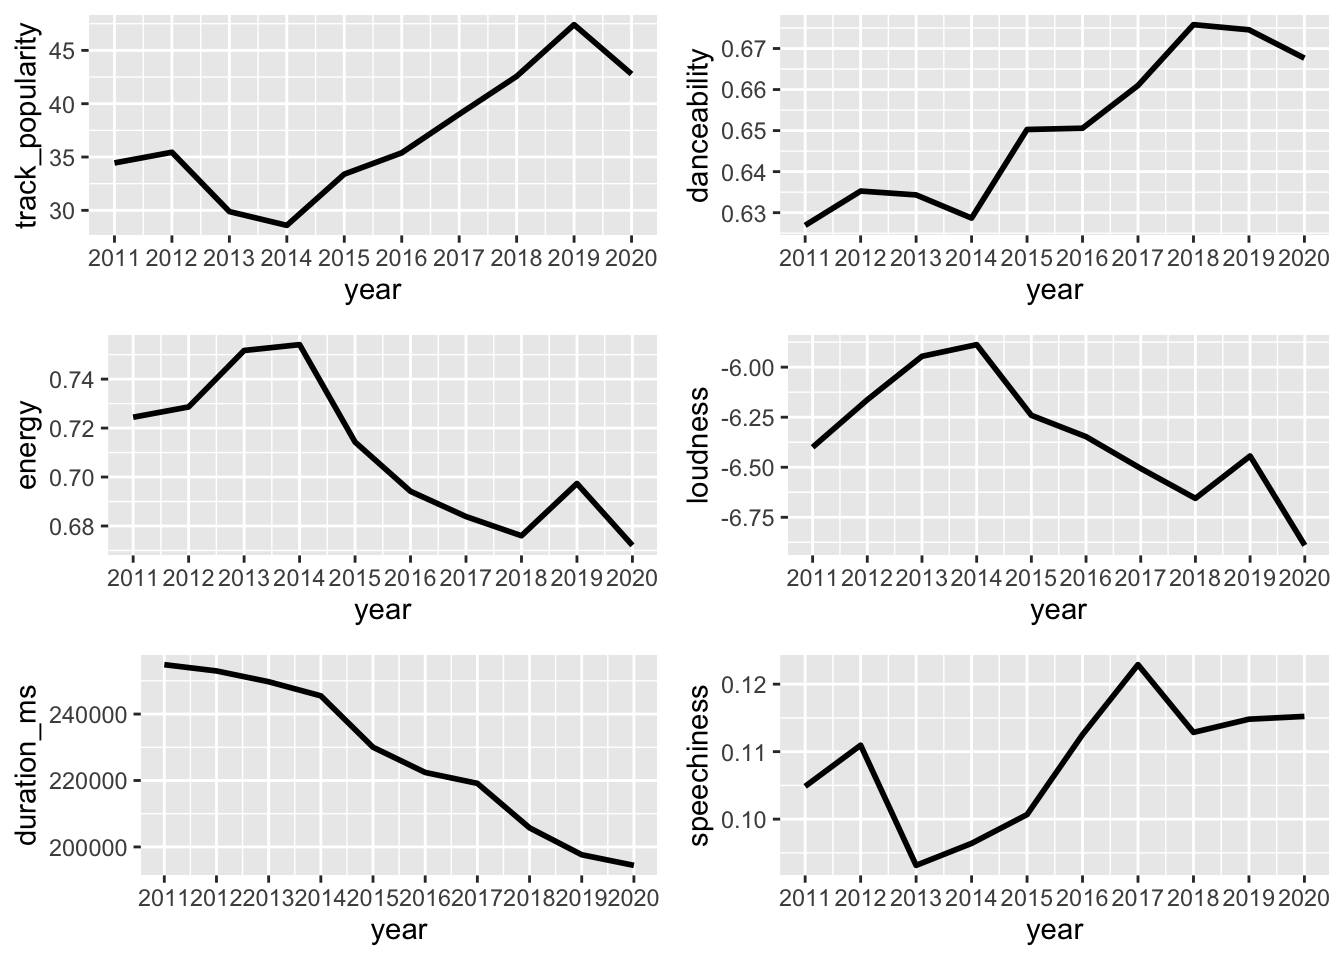
Observations and Conclusion
Observations:
The most popular titles used in songs on Spotify are “Love,” followed closely by “Don’t” and “Like.” This indicates that these words resonate with listeners and are commonly used to convey emotions and themes in music. Popular songs tend to have a duration ranging from 2.5 to 4 minutes. This suggests that shorter song lengths are preferred by listeners, possibly due to their concise and easily digestible nature. Over the years, there has been a significant decrease in the duration of songs. This trend indicates a shift towards shorter musical compositions, possibly influenced by changing listener preferences and the rise of streaming platforms. In the 1960s and 1970s, the “Rock” genre dominated in popularity compared to other genres. However, over time, the “Pop” genre has taken over as the most popular genre on Spotify, reflecting changes in musical trends and audience preferences.
A majority of songs have an instrumentalness value lower than 0.1. This suggests that vocals play a prominent role in popular songs, with fewer instrumental-only tracks. The distribution of valence, energy, and danceability features appears to be normally distributed. This indicates that these features are spread across a range of values, with a balance of high and low levels observed in popular songs. Songs with higher speechiness, indicating a higher presence of spoken words or vocal sections, are generally not as popular. This suggests that listeners may prefer songs with a greater focus on melodic elements rather than extensive spoken or narrated content.
By examining these observations, we can gain insights into the characteristics of popular songs on Spotify, such as the choice of titles, song duration, genre popularity, instrumentalness, and the impact of certain audio features on song popularity. These findings can be valuable for artists, music producers, and music recommendation algorithms in understanding listener preferences and creating music that resonates with a wider audience.
Future Direction:
Sub-genre Analysis: Further investigate specific sub-genres within popular genres to gain more insights into listener preferences and target niche audiences effectively.
Predictive Models: Develop predictive models using machine learning to forecast song popularity based on its characteristics, enabling artists and industry professionals to gauge potential success.
User-Driven Playlist Recommendations: Incorporate user preferences and listening habits to enhance playlist recommendations, leveraging personalized data for more accurate and tailored suggestions.
Social and Cultural Analysis: Analyze social media trends, cultural events, and viral content to understand their influence on song popularity, incorporating external data sources and sentiment analysis.
Exploration of Emerging Trends: Explore emerging music trends, including new genres, streaming platform impact, and the role of emerging artists, to stay up-to-date with evolving music landscapes.
By pursuing these future directions, we can deepen our understanding of music features, genres, and song popularity on Spotify, improving recommendation systems, assisting artists, and enhancing the music listening experience.
Bibliography:
Spotify Dataset 1921-2020, Kaggle, https://www.kaggle.com/yamaerenay/spotify-dataset-19212020.
R Core Team. (2021). R: A Language and Environment for Statistical Computing. R Foundation for Statistical Computing, Vienna, Austria. https://www.R-project.org/.