library(readr)
library(tidyverse)
library(ggplot2)
library(dplyr)

knitr::opts_chunk$set(echo = TRUE, warning=FALSE, message=FALSE)Challenge 8
challenge_8
snl
Joining Data
Data Description
I chose the SNL dataset for this project and it comprises of 3 files where each of these files talk about the following details respectively:
- Actors
data_actors <- read_csv("_data/snl_actors.csv", show_col_types = FALSE)
head(data_actors)
# A tibble: 6 × 4
aid url type gender
<chr> <chr> <chr> <chr>
1 Kate McKinnon /Cast/?KaMc cast female
2 Alex Moffat /Cast/?AlMo cast male
3 Ego Nwodim /Cast/?EgNw cast unknown
4 Chris Redd /Cast/?ChRe cast male
5 Kenan Thompson /Cast/?KeTh cast male
6 Carey Mulligan /Guests/?3677 guest andy This file specifically talks about the crew who work or associated to SNL. There are 4 columns where the column ‘aid’ represents the name of the person, ‘url’ refers to the url associated to the aid and two other columns type and gender which talks about how the aid is associated and the gender of the aid respectively.
The dimensions of the actors dataset is as follows:
dim(data_actors)[1] 2306 4- Casts
data_casts <- read_csv("_data/snl_casts.csv", show_col_types = FALSE)
head(data_casts)
# A tibble: 6 × 8
aid sid featured first_epid last_epid update_…¹ n_epi…² seaso…³
<chr> <dbl> <lgl> <dbl> <dbl> <lgl> <dbl> <dbl>
1 A. Whitney Brown 11 TRUE 19860222 NA FALSE 8 0.444
2 A. Whitney Brown 12 TRUE NA NA FALSE 20 1
3 A. Whitney Brown 13 TRUE NA NA FALSE 13 1
4 A. Whitney Brown 14 TRUE NA NA FALSE 20 1
5 A. Whitney Brown 15 TRUE NA NA FALSE 20 1
6 A. Whitney Brown 16 TRUE NA NA FALSE 20 1
# … with abbreviated variable names ¹update_anchor, ²n_episodes,
# ³season_fractionThis dataset appears to depict the engagement of the casts with SNL like episodes appeared on and other casting related information.
The dimensions of the casts dataset is as follows:
dim(data_casts)[1] 614 8- Seasons
data_seasons <- read_csv("_data/snl_seasons.csv", show_col_types = FALSE)
head(data_seasons)
# A tibble: 6 × 5
sid year first_epid last_epid n_episodes
<dbl> <dbl> <dbl> <dbl> <dbl>
1 1 1975 19751011 19760731 24
2 2 1976 19760918 19770521 22
3 3 1977 19770924 19780520 20
4 4 1978 19781007 19790526 20
5 5 1979 19791013 19800524 20
6 6 1980 19801115 19810411 13This dataset appears to talk about the number of episodes that were telecasted during different years.
The dimensions of the dataset are as follows:
dim(data_seasons)[1] 46 5Tidying Data
Let the target be to find the cast members who made most number of appearances on SNL. So first we’ll need to re-structure the casts dataset and obtain a new dataframe comprising of total number of appearances made by each actor.
modified_data_casts <- data_casts %>%
                        group_by(aid) %>%
                        select(-last_epid, -first_epid) %>%
                        summarise(total_appearances = sum(n_episodes))
head(modified_data_casts)
# A tibble: 6 × 2
aid total_appearances
<chr> <dbl>
1 A. Whitney Brown 101
2 Abby Elliott 81
3 Adam Sandler 89
4 Aidy Bryant 182
5 Al Franken 200
6 Alan Zweibel 5Now we have each of the cast members and the number of episodes in which they appeared in. Now this dataset can be merged with the actors dataset to observe many other things such as what is the distribution of the cast members in SNL and how often did they make their appearances on the SNL.
Join Data
Now we join the modified_data_casts with the actors dataframe and it can be done as follows:
combined_cast_data <- modified_data_casts %>%
                        left_join(data_actors, by='aid')
head(combined_cast_data)
# A tibble: 6 × 5
aid total_appearances url type gender
<chr> <dbl> <chr> <chr> <chr>
1 A. Whitney Brown 101 /Cast/?AWBr cast male
2 Abby Elliott 81 /Cast/?AbEl cast female
3 Adam Sandler 89 /Cast/?AdSa cast male
4 Aidy Bryant 182 /Cast/?AiBr cast female
5 Al Franken 200 /Cast/?AlFr cast male
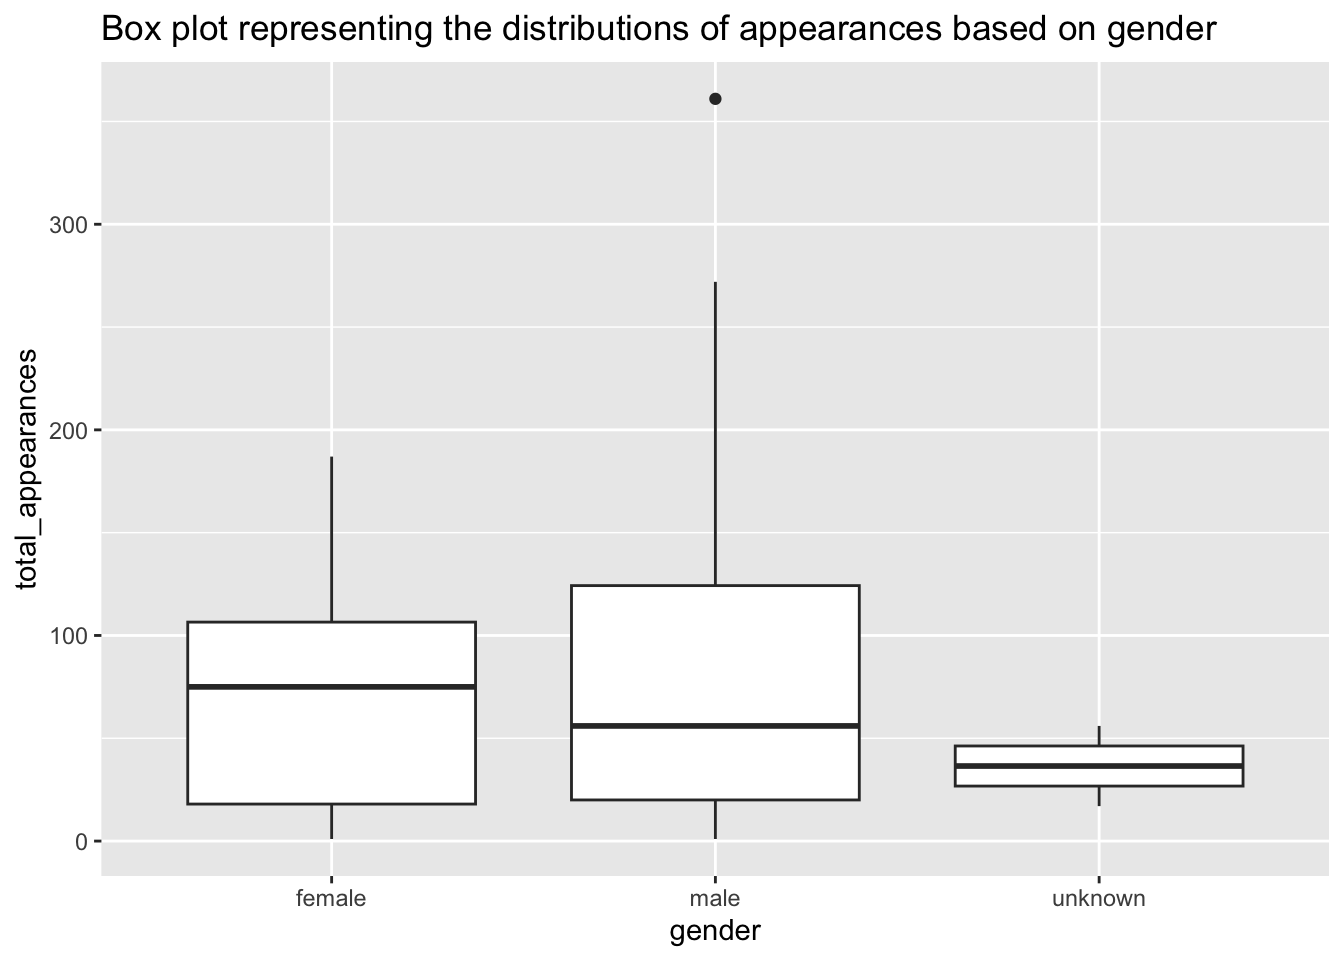
6 Alan Zweibel 5 /Cast/?AlZw cast male Now we can plot the box plot to obtain statistics about the appearances of cast on SNL.
ggplot(combined_cast_data)+
  geom_boxplot(aes(x = gender, y = total_appearances))+
  labs(title = "Box plot representing the distributions of appearances based on gender")