library(tidyverse)
library(ggplot2)

knitr::opts_chunk$set(echo = TRUE, warning=FALSE, message=FALSE)
Challenge 8
challenge_8
activeduty
snl
faostat
Joining Data
Challenge Overview
Today’s challenge is to:
- read in multiple data sets, and describe the data set using both words and any supporting information (e.g., tables, etc)
- tidy data (as needed, including sanity checks)
- mutate variables as needed (including sanity checks)
- join two or more data sets and analyze some aspect of the joined data (see detailed instruction below)
(be sure to only include the category tags for the data you use!)
Read in data
Read in one (or more) of the following datasets, using the correct R package and command.
- military marriages (ActiveDuty_MaritalStatus.xls)⭐⭐
- faostat (birds.csv,FAOSTAT_country_groups.csv, and other “FAOSTAT_*” files) ⭐⭐⭐⭐
- snl (snl_actors.csv, snl_casts.csv, snl_seasons.csv)⭐⭐⭐
We are going to read the snl data.
snl_actors <- read_csv("_data/snl_actors.csv")
head(snl_actors)
# A tibble: 6 × 4
aid url type gender
<chr> <chr> <chr> <chr>
1 Kate McKinnon /Cast/?KaMc cast female
2 Alex Moffat /Cast/?AlMo cast male
3 Ego Nwodim /Cast/?EgNw cast unknown
4 Chris Redd /Cast/?ChRe cast male
5 Kenan Thompson /Cast/?KeTh cast male
6 Carey Mulligan /Guests/?3677 guest andy # The Dimensions
dim(snl_actors)[1] 2306 4# The Column Names
colnames(snl_actors)[1] "aid" "url" "type" "gender"summary(snl_actors) aid url type gender
Length:2306 Length:2306 Length:2306 Length:2306
Class :character Class :character Class :character Class :character
Mode :character Mode :character Mode :character Mode :character snl_casts <- read_csv("_data/snl_casts.csv")
head(snl_casts)# A tibble: 6 × 8
aid sid featured first_epid last_epid update_…¹ n_epi…² seaso…³
<chr> <dbl> <lgl> <dbl> <dbl> <lgl> <dbl> <dbl>
1 A. Whitney Brown 11 TRUE 19860222 NA FALSE 8 0.444
2 A. Whitney Brown 12 TRUE NA NA FALSE 20 1
3 A. Whitney Brown 13 TRUE NA NA FALSE 13 1
4 A. Whitney Brown 14 TRUE NA NA FALSE 20 1
5 A. Whitney Brown 15 TRUE NA NA FALSE 20 1
6 A. Whitney Brown 16 TRUE NA NA FALSE 20 1
# … with abbreviated variable names ¹update_anchor, ²n_episodes,
# ³season_fraction# The Dimensions
dim(snl_casts)[1] 614 8# The Column Names
colnames(snl_casts)[1] "aid" "sid" "featured" "first_epid"
[5] "last_epid" "update_anchor" "n_episodes" "season_fraction"summary(snl_casts) aid sid featured first_epid
Length:614 Min. : 1.00 Mode :logical Min. :19770115
Class :character 1st Qu.:15.00 FALSE:451 1st Qu.:19801215
Mode :character Median :26.00 TRUE :163 Median :19901110
Mean :25.47 Mean :19909634
3rd Qu.:37.00 3rd Qu.:19957839
Max. :46.00 Max. :20141025
NA's :564
last_epid update_anchor n_episodes season_fraction
Min. :19751011 Mode :logical Min. : 1.00 Min. :0.04167
1st Qu.:19850112 FALSE:541 1st Qu.:19.00 1st Qu.:1.00000
Median :19950225 TRUE :73 Median :20.00 Median :1.00000
Mean :19944038 Mean :18.73 Mean :0.94827
3rd Qu.:20040117 3rd Qu.:21.00 3rd Qu.:1.00000
Max. :20140201 Max. :24.00 Max. :1.00000
NA's :597 snl_seasons <- read_csv("_data/snl_seasons.csv")
head(snl_seasons)# A tibble: 6 × 5
sid year first_epid last_epid n_episodes
<dbl> <dbl> <dbl> <dbl> <dbl>
1 1 1975 19751011 19760731 24
2 2 1976 19760918 19770521 22
3 3 1977 19770924 19780520 20
4 4 1978 19781007 19790526 20
5 5 1979 19791013 19800524 20
6 6 1980 19801115 19810411 13# The Dimensions
dim(snl_seasons)[1] 46 5# The Column Names
colnames(snl_seasons)[1] "sid" "year" "first_epid" "last_epid" "n_episodes"summary(snl_seasons) sid year first_epid last_epid
Min. : 1.00 Min. :1975 Min. :19751011 Min. :19760731
1st Qu.:12.25 1st Qu.:1986 1st Qu.:19863512 1st Qu.:19872949
Median :23.50 Median :1998 Median :19975926 Median :19985512
Mean :23.50 Mean :1998 Mean :19975965 Mean :19985509
3rd Qu.:34.75 3rd Qu.:2009 3rd Qu.:20088423 3rd Qu.:20098015
Max. :46.00 Max. :2020 Max. :20201003 Max. :20210410
n_episodes
Min. :12.0
1st Qu.:20.0
Median :20.0
Mean :19.7
3rd Qu.:21.0
Max. :24.0 Briefly describe the data
SNL
These data came to my attention courtesy of Jeremy Singer-Vine’s wonderful Data is Plural newsletter. These datasets, archived by Joel Navaroli and scraped by Hendrik Hilleckes and Colin Morris, contain data about the actors, cast, seasons, etc. from every season of Saturday Night Live from its inception through 2020.
With these three datasets, we can join them together to observe many different features, such as gender makeup and number of appearance, of the SNL casts and actors changed over time.
SNL Actos consists of the actors with their ID, gender, type, url of around 2306 actors.
SNL Casts consists of data for around 614 actors and their first, last episode, no of episodes, season id.
SNL Seasons consists of data of the seasons which are in total 46 from 1975 - 2021
Tidy Data (as needed)
Is your data already tidy, or is there work to be done? Be sure to anticipate your end result to provide a sanity check, and document your work here.
The data is already tidied.
  non_matching_rows <- snl_actors %>%
    anti_join(snl_casts, by = "aid")
  non_matching_rows
# A tibble: 2,150 × 4
aid url type gender
<chr> <chr> <chr> <chr>
1 Carey Mulligan /Guests/?3677 guest andy
2 Marcus Mumford /Guests/?3679 guest male
3 Steve Higgins /Crew/?StHi crew male
4 Kid Cudi /Guests/?3678 guest unknown
5 Timothee Chalamet /Guests/?3680 guest unknown
6 Daniel Kaluuya /Guests/?3675 guest male
7 St. Vincent /Guests/?3676 guest unknown
8 Jack Harlow /Guests/?3670 guest male
9 Adam Levine /Guests/?3671 guest male
10 Nick Jonas /Guests/?3667 guest male
# … with 2,140 more rowsThis shows there are a lot of rows in actors that are not in casts.
Join Data
We will join the necessary 3 datasets together first and then plot graphs based on them.
snl_actors_casts <- snl_actors %>%
  inner_join(snl_casts, by="aid")

snl_actors_casts_seasons <- snl_actors_casts %>%
  inner_join(snl_seasons, by="sid")
snl_actors_casts_seasons
# A tibble: 614 × 15
aid url type gender sid featu…¹ first…² last_…³ updat…⁴ n_epi…⁵
<chr> <chr> <chr> <chr> <dbl> <lgl> <dbl> <dbl> <lgl> <dbl>
1 Kate McKinn… /Cas… cast female 37 TRUE 2.01e7 NA FALSE 5
2 Kate McKinn… /Cas… cast female 38 TRUE NA NA FALSE 21
3 Kate McKinn… /Cas… cast female 39 FALSE NA NA FALSE 21
4 Kate McKinn… /Cas… cast female 40 FALSE NA NA FALSE 21
5 Kate McKinn… /Cas… cast female 41 FALSE NA NA FALSE 21
6 Kate McKinn… /Cas… cast female 42 FALSE NA NA FALSE 21
7 Kate McKinn… /Cas… cast female 43 FALSE NA NA FALSE 21
8 Kate McKinn… /Cas… cast female 44 FALSE NA NA FALSE 21
9 Kate McKinn… /Cas… cast female 45 FALSE NA NA FALSE 18
10 Kate McKinn… /Cas… cast female 46 FALSE NA NA FALSE 17
# … with 604 more rows, 5 more variables: season_fraction <dbl>, year <dbl>,
# first_epid.y <dbl>, last_epid.y <dbl>, n_episodes.y <dbl>, and abbreviated
# variable names ¹featured, ²first_epid.x, ³last_epid.x, ⁴update_anchor,
# ⁵n_episodes.xsnl_actors_casts_seasons %>%
ggplot(aes(sid, col=gender)) +
geom_histogram() +
labs(title = "Gender Makeup")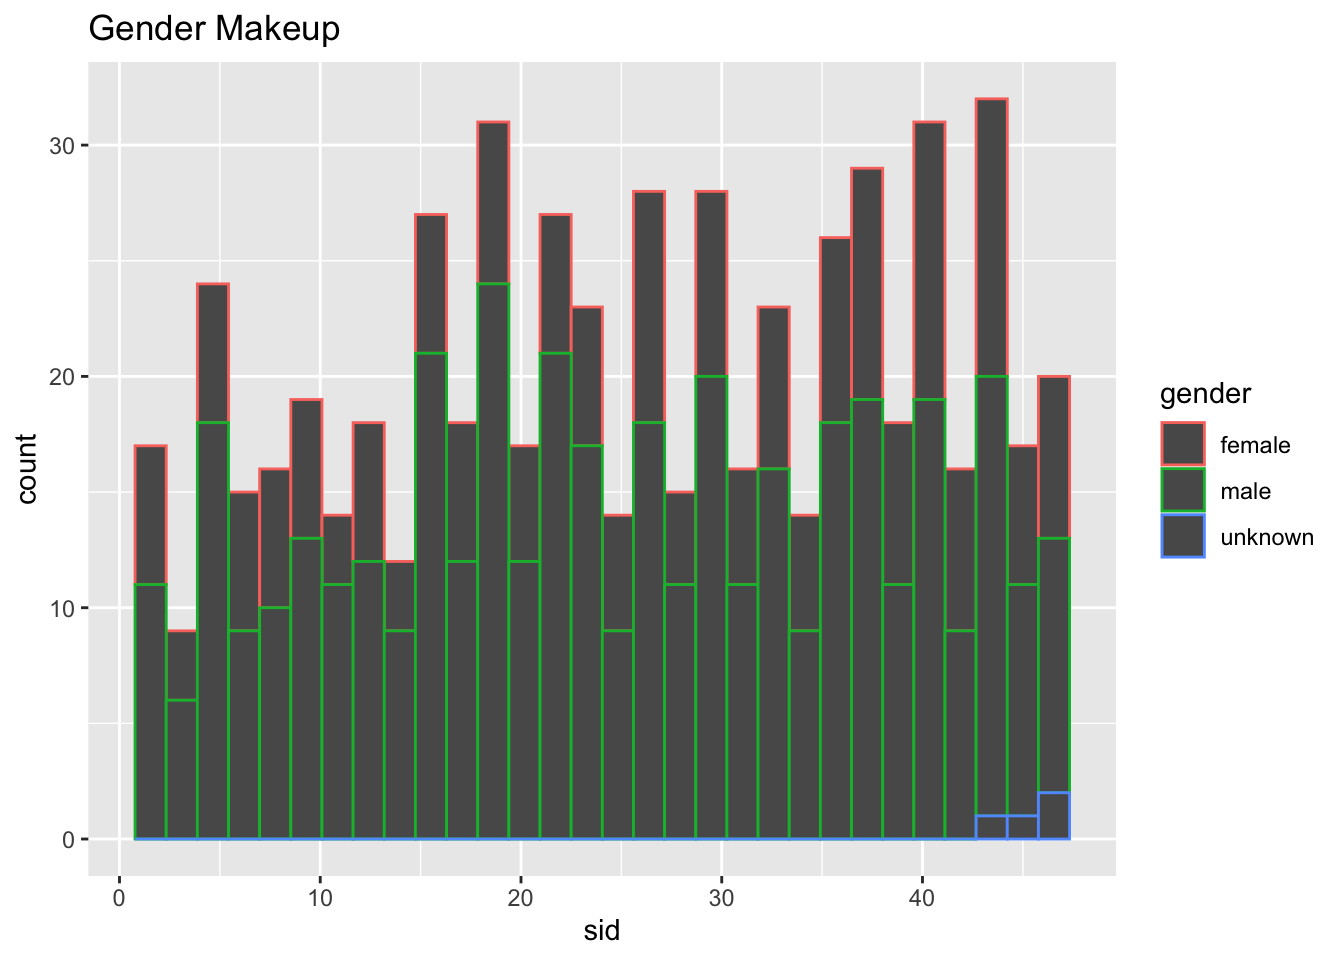
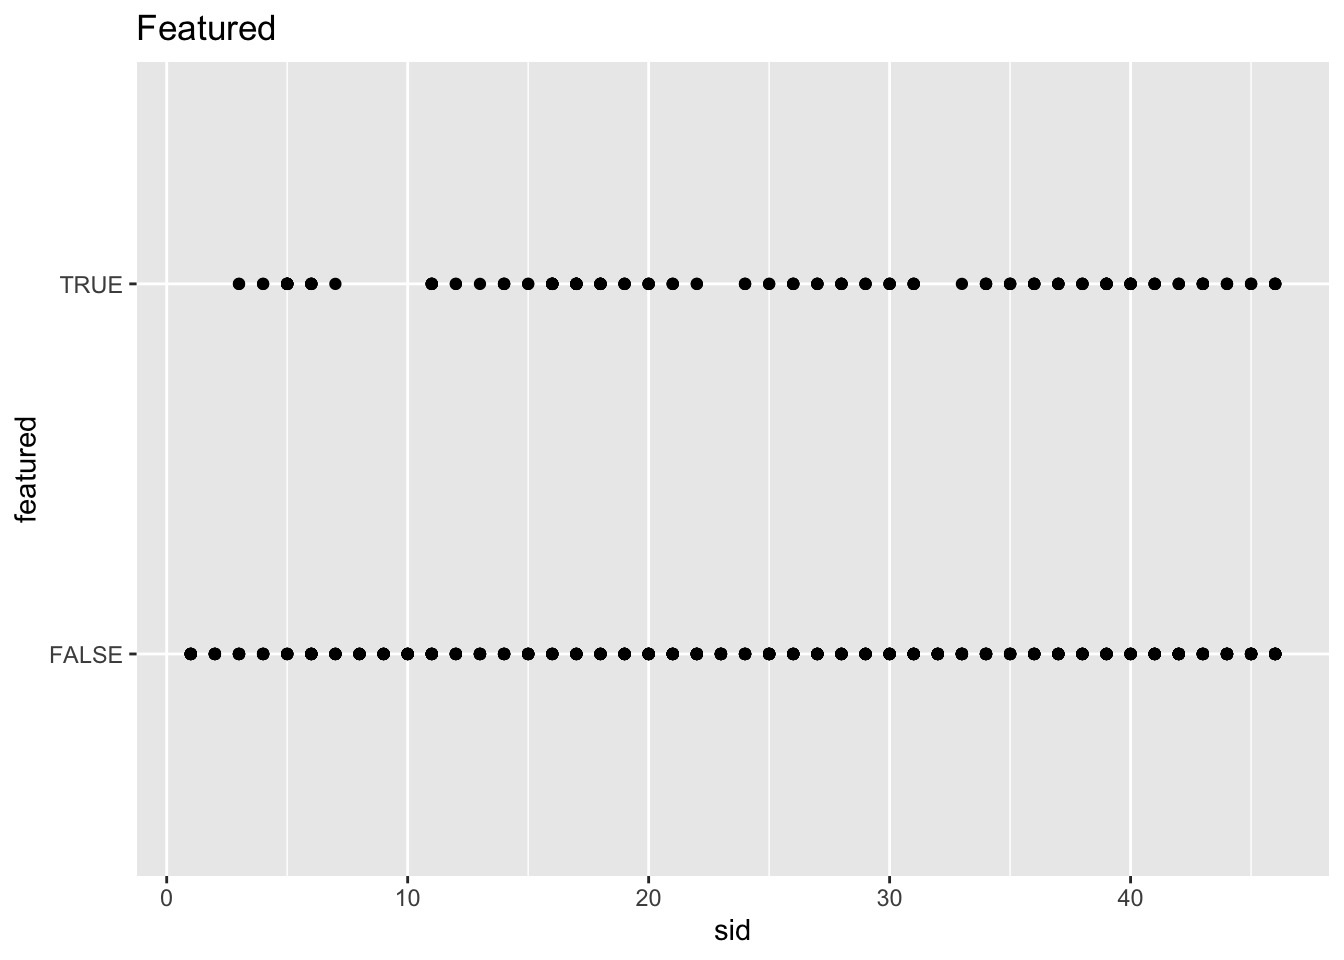
snl_actors_casts_seasons %>%
  ggplot(aes(sid, featured)) +
  geom_point() +
  labs(title = "Featured")