library(tidyverse)
library(ggplot2)

knitr::opts_chunk$set(echo = TRUE, warning=FALSE, message=FALSE)
Challenge 8 : Joining SNL Data
challenge_8
snl
Saksham Kumar
Joining Data
Challenge Overview
Today’s challenge is to:
- read in multiple data sets, and describe the data set using both words and any supporting information (e.g., tables, etc)
- tidy data (as needed, including sanity checks)
- mutate variables as needed (including sanity checks)
- join two or more data sets and analyze some aspect of the joined data
(be sure to only include the category tags for the data you use!)
Read in data
Read in one (or more) of the following datasets, using the correct R package and command.
- snl ⭐⭐⭐⭐⭐
snl_actors <- read_csv("_data/snl_actors.csv", show_col_types = FALSE)
snl_casts <- read_csv("_data/snl_casts.csv", show_col_types = FALSE)
snl_seasons <- read_csv("_data/snl_seasons.csv", show_col_types = FALSE)
Briefly describe the data
snl_actorsThis data frame is a list of actors who were SNL, if they were guests, crew members or part of the cast, and finally their gender
snl_castsThis data frame contains information about which actor appeared in which season in SNL and other information about the actor-season relationship
snl_seasonsFinally this data frame contains information about each season like air year, no. of episodes and first and last episode id
Join Data
lets joins the actors and casts data frame by aid. Let us also drop url
snl_casts_actors <- snl_casts %>%
                left_join(snl_actors, by ="aid") %>%
                select(!url)

snl_casts_actors
Let us next join snl_casts_actors and snl_seasons based on sid. Let us also drop episode information
snl_agg_data <- snl_casts_actors %>%
                left_join(snl_seasons, by ="sid") %>%
                select(-c(first_epid.x, last_epid.x, n_episodes.x, first_epid.y, last_epid.y, n_episodes.y))

snl_agg_data
Let us now try to see the number od male and female actors across the years
snl_agg_data_filtered <- snl_agg_data %>% group_by(sid, year, gender) %>% summarise(count = n(), .groups = 'drop')

snl_agg_data_filtered
Let us try to visualize this
ggplot(snl_agg_data_filtered, aes(year, count, col = gender)) + geom_line()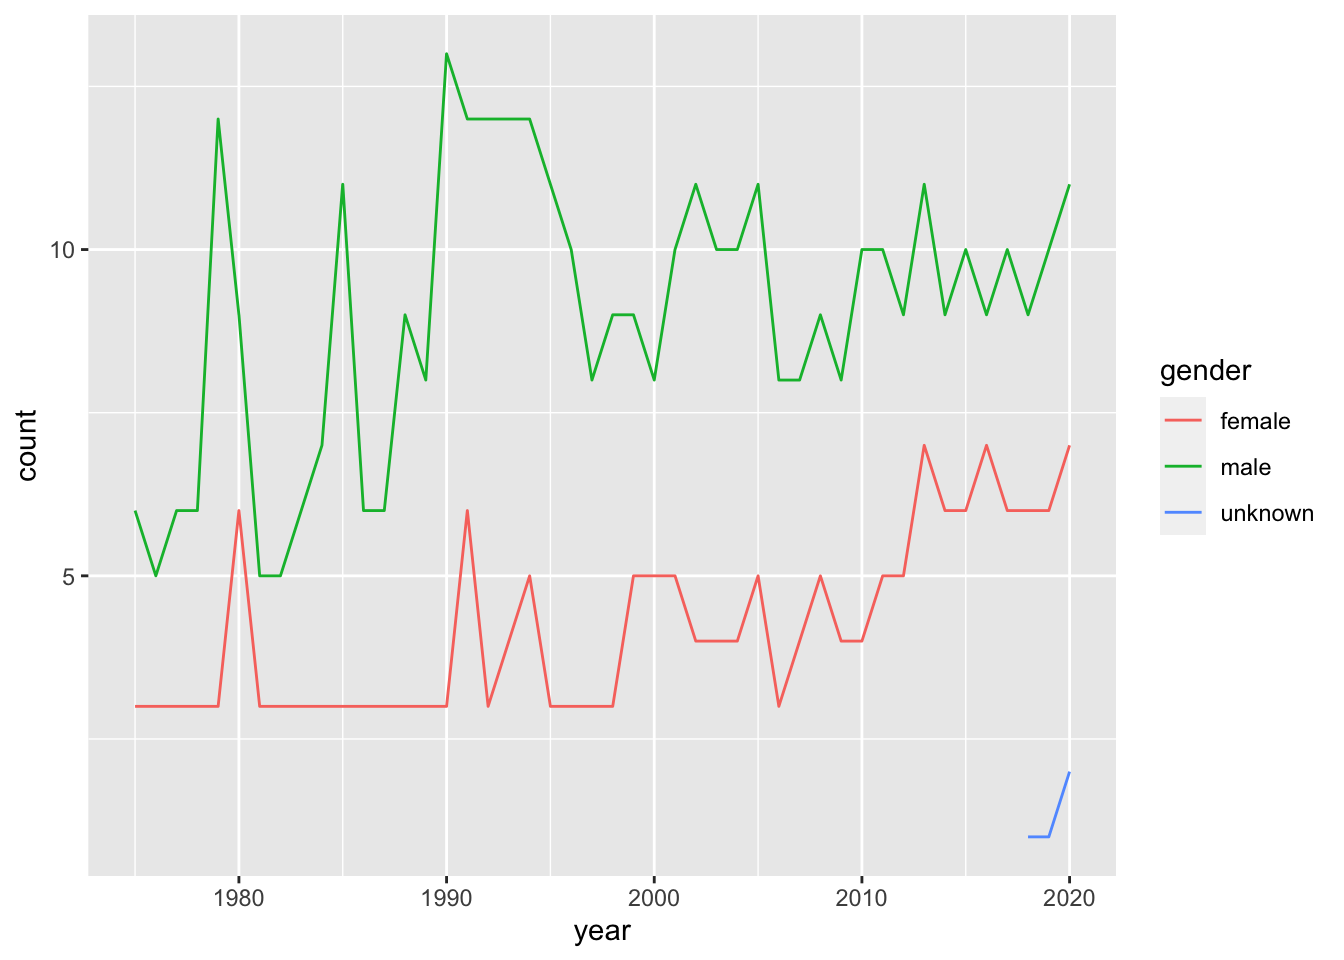
We can see from the plot that the number of female actors on SNL has increased from the 2010s. Also we can see the actors with gender marked as “unkown” (possibly individuals that identify as non-binary) have appreared on SNL from the 2020s.