library(tidyverse)
library(ggplot2)

knitr::opts_chunk$set(echo = TRUE, warning=FALSE, message=FALSE)
Challenge 8
challenge_8
railroads
snl
faostat
debt
Joining Data
Challenge Overview
Today’s challenge is to:
- read in multiple data sets, and describe the data set using both words and any supporting information (e.g., tables, etc)
- tidy data (as needed, including sanity checks)
- mutate variables as needed (including sanity checks)
- join two or more data sets and analyze some aspect of the joined data
(be sure to only include the category tags for the data you use!)
Read in data
Read in one (or more) of the following datasets, using the correct R package and command.
- military marriages ⭐⭐
- faostat ⭐⭐
- railroads ⭐⭐⭐
- fed_rate ⭐⭐⭐
- debt ⭐⭐⭐
- us_hh ⭐⭐⭐⭐
- snl ⭐⭐⭐⭐⭐
Briefly describe the data
Tidy Data (as needed)
Is your data already tidy, or is there work to be done? Be sure to anticipate your end result to provide a sanity check, and document your work here.
After checking the sanity of the data by using glimpse function to check the data types & column names and NA count, it has been found that casts data has more NA values. So it would be ideal to move ahead with actors and seasons data.
library(tidyverse)

# Load the data sets
snl_actors <- read_csv("_data/snl_actors.csv")
snl_casts <- read_csv("_data/snl_casts.csv")
snl_seasons <- read_csv("_data/snl_seasons.csv")

# Check the structure of the data sets
names(snl_actors)
[1] "aid" "url" "type" "gender"glimpse(snl_actors)Rows: 2,306
Columns: 4
$ aid <chr> "Kate McKinnon", "Alex Moffat", "Ego Nwodim", "Chris Redd", "Ke…
$ url <chr> "/Cast/?KaMc", "/Cast/?AlMo", "/Cast/?EgNw", "/Cast/?ChRe", "/C…
$ type <chr> "cast", "cast", "cast", "cast", "cast", "guest", "guest", "cast…
$ gender <chr> "female", "male", "unknown", "male", "male", "andy", "male", "f…names(snl_casts)[1] "aid" "sid" "featured" "first_epid"
[5] "last_epid" "update_anchor" "n_episodes" "season_fraction"glimpse(snl_casts)Rows: 614
Columns: 8
$ aid <chr> "A. Whitney Brown", "A. Whitney Brown", "A. Whitney Br…
$ sid <dbl> 11, 12, 13, 14, 15, 16, 5, 39, 40, 41, 42, 45, 46, 21,…
$ featured <lgl> TRUE, TRUE, TRUE, TRUE, TRUE, TRUE, TRUE, TRUE, TRUE, …
$ first_epid <dbl> 19860222, NA, NA, NA, NA, NA, 19800409, 20140118, NA, …
$ last_epid <dbl> NA, NA, NA, NA, NA, NA, NA, NA, NA, NA, NA, NA, NA, NA…
$ update_anchor <lgl> FALSE, FALSE, FALSE, FALSE, FALSE, FALSE, FALSE, FALSE…
$ n_episodes <dbl> 8, 20, 13, 20, 20, 20, 5, 11, 21, 21, 21, 18, 17, 20, …
$ season_fraction <dbl> 0.4444444, 1.0000000, 1.0000000, 1.0000000, 1.0000000,…names(snl_seasons)[1] "sid" "year" "first_epid" "last_epid" "n_episodes"glimpse(snl_seasons)Rows: 46
Columns: 5
$ sid <dbl> 1, 2, 3, 4, 5, 6, 7, 8, 9, 10, 11, 12, 13, 14, 15, 16, 17, …
$ year <dbl> 1975, 1976, 1977, 1978, 1979, 1980, 1981, 1982, 1983, 1984,…
$ first_epid <dbl> 19751011, 19760918, 19770924, 19781007, 19791013, 19801115,…
$ last_epid <dbl> 19760731, 19770521, 19780520, 19790526, 19800524, 19810411,…
$ n_episodes <dbl> 24, 22, 20, 20, 20, 13, 20, 20, 19, 17, 18, 20, 13, 20, 20,…sum(is.na(snl_actors))[1] 57sum(is.na(snl_casts))[1] 1161sum(is.na(snl_seasons))[1] 0Are there any variables that require mutation to be usable in your analysis stream? For example, do you need to calculate new values in order to graph them? Can string values be represented numerically? Do you need to turn any variables into factors and reorder for ease of graphics and visualization?
Join Data
Be sure to include a sanity check, and double-check that case count is correct!
Document your work here.
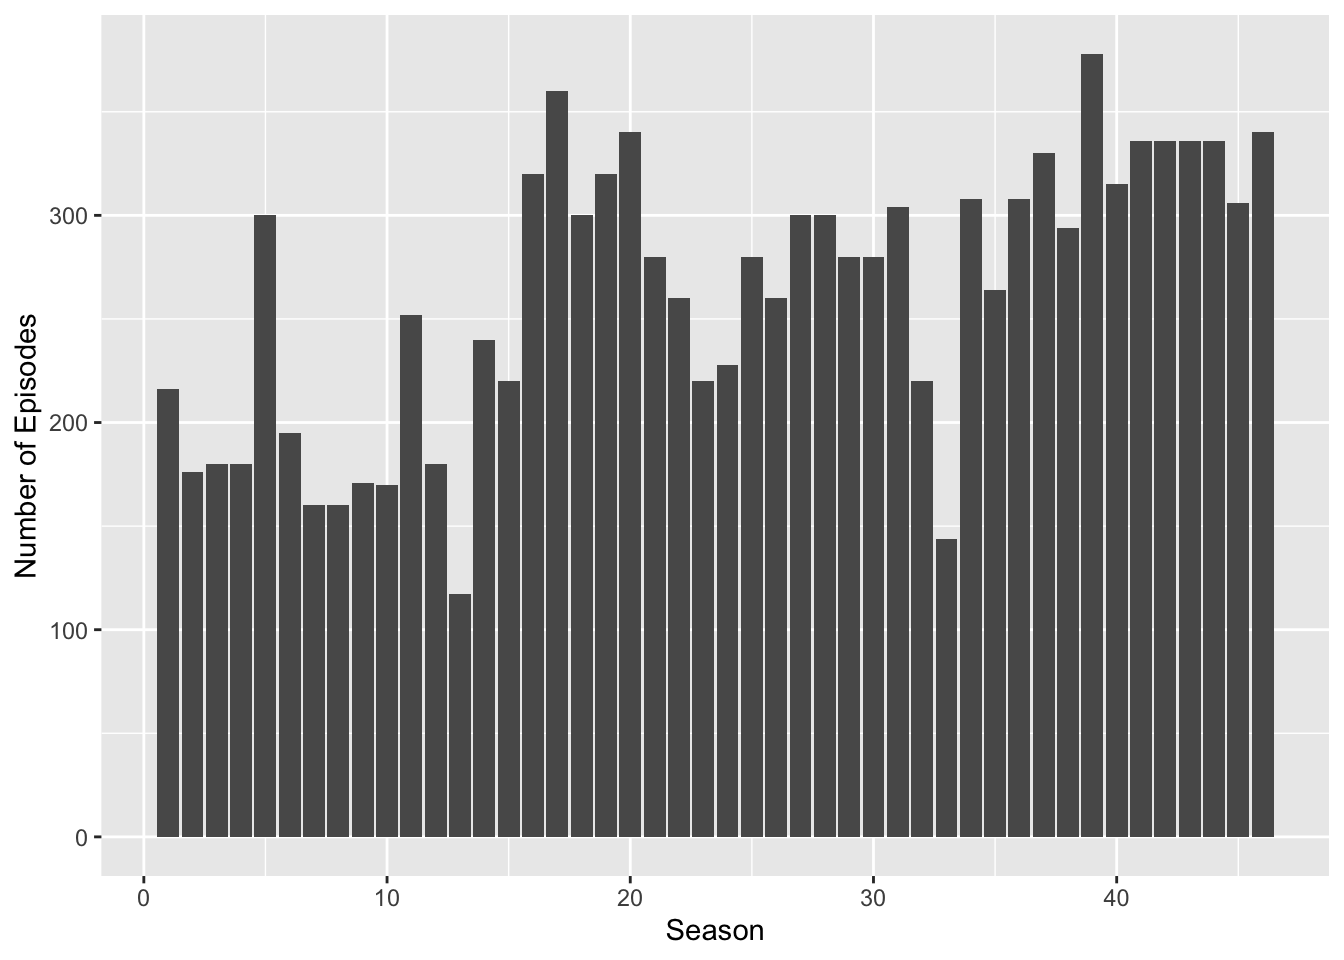
Below we join both the datasets, then convert dates to appropriate format and create a new colummn with season duration. Featured, updated_anchor are converted to factors. Then we create a visualisation with number of episodes per season.
library(dplyr)

snl <- left_join(snl_seasons, snl_casts, by = "sid")

str(snl)
spc_tbl_ [614 × 12] (S3: spec_tbl_df/tbl_df/tbl/data.frame)
$ sid : num [1:614] 1 1 1 1 1 1 1 1 1 2 ...
$ year : num [1:614] 1975 1975 1975 1975 1975 ...
$ first_epid.x : num [1:614] 19751011 19751011 19751011 19751011 19751011 ...
$ last_epid.x : num [1:614] 19760731 19760731 19760731 19760731 19760731 ...
$ n_episodes.x : num [1:614] 24 24 24 24 24 24 24 24 24 22 ...
$ aid : chr [1:614] "Gilda Radner" "Michael O'Donoghue" "Laraine Newman" "Garrett Morris" ...
$ featured : logi [1:614] FALSE FALSE FALSE FALSE FALSE FALSE ...
$ first_epid.y : num [1:614] NA NA NA NA NA NA NA NA NA NA ...
$ last_epid.y : num [1:614] NA 19751108 NA NA NA ...
$ update_anchor : logi [1:614] FALSE FALSE FALSE FALSE FALSE FALSE ...
$ n_episodes.y : num [1:614] 24 4 24 24 24 1 24 24 24 22 ...
$ season_fraction: num [1:614] 1 0.167 1 1 1 ...
- attr(*, "spec")=
.. cols(
.. sid = col_double(),
.. year = col_double(),
.. first_epid = col_double(),
.. last_epid = col_double(),
.. n_episodes = col_double()
.. )
- attr(*, "problems")=<externalptr> library(ggplot2)
snl$first_epid.x <- as.Date(as.character(snl$first_epid.x), format = "%Y%m%d")
snl$last_epid.x <- as.Date(as.character(snl$last_epid.x), format = "%Y%m%d")
snl$featured <- as.factor(snl$featured)
snl$update_anchor <- as.factor(snl$update_anchor)
snl$aid <- factor(snl$aid, levels = unique(snl$aid[order(table(snl$aid), decreasing = TRUE)]))
snl$season_duration <- snl$last_epid.x - snl$first_epid.x
snl$season_fraction <- as.numeric(snl$season_fraction)
ggplot(snl, aes(x = sid, y = n_episodes.x)) +
geom_bar(stat = "identity") +
labs(x = "Season", y = "Number of Episodes")