R Markdown
library(ggplot2)
library(markdown)
library(rmarkdown)
library(tidyr)
library(tidyselect)
library(tidyverse)
── Attaching packages ─────────────────────────────────────── tidyverse 1.3.1 ──
✓ tibble  3.1.6     ✓ dplyr   1.0.7
✓ readr   2.1.2     ✓ stringr 1.4.0
✓ purrr   0.3.4     ✓ forcats 0.5.1
── Conflicts ────────────────────────────────────────── tidyverse_conflicts() ──
x dplyr::filter() masks stats::filter()
x dplyr::lag()    masks stats::lag()
library(readxl)
LungCapData <- read_excel("_data/LungCapData.xls")
View(LungCapData)
m_lung<-mean(LungCapData$LungCap)
sd_lung<-sd(LungCapData$LungCap)

hist(LungCapData$LungCap, prob= TRUE, xlim = c(0, 20))
curve(dnorm(x, m_lung, sd_lung), add= TRUE,lwd= 2,col= "blue")
Section 1 Question 1
Looks like a normal distribution
Question 2
grouped_gender<- LungCapData %>% group_by(Gender)
summarize(grouped_gender)
# A tibble: 2 × 1
  Gender
  <chr>
1 female
2 male
qplot(data = grouped_gender, x = Gender, y = LungCap, geom = "boxplot")
Males have a higher mean than females.
Question 3
Smokers have a higher mean
grouped_smokers<- LungCapData %>% group_by(Smoke)
summarize(grouped_smokers)
# A tibble: 2 × 1
  Smoke
  <chr>
1 no
2 yes
qplot(data = grouped_smokers, x = Smoke, y = LungCap, geom = "boxplot")
Question 4
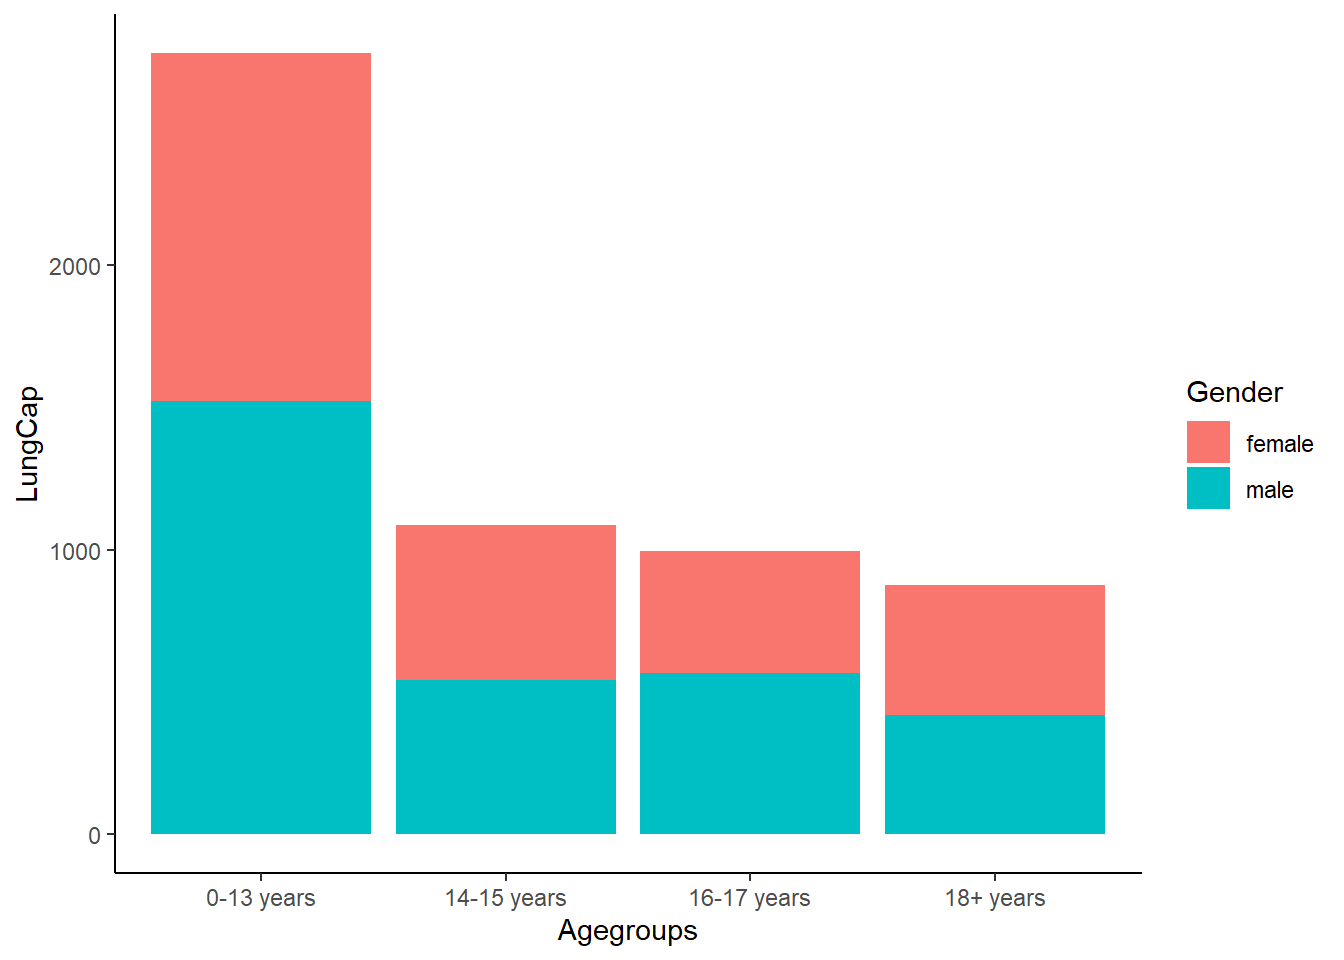
Looks like the lung capacity is highest for children ages 0-13, specifically for males.
LungCapData$Agegroups<-cut(LungCapData$Age,breaks=c(-Inf, 13, 15, 17, 20), labels=c("0-13 years", "14-15 years", "16-17 years", "18+ years"))

ggplot(LungCapData, aes(x = LungCap, y = Agegroups, fill = Gender)) +
          geom_bar(stat = "identity") +
          coord_flip() +
          theme_classic()
Question 5
Doesnt look like its good being a smoker under the age of 18, or any age. Lung capacity is smaller for these groups
ggplot(LungCapData, aes(x = LungCap, y = Agegroups, fill = Smoke)) +
    geom_bar(stat = "identity") +
    coord_flip() +
    theme_classic()
Question 6
covar<-cov(LungCapData$LungCap, LungCapData$Age)
print(covar)
corre<-cor(LungCapData$LungCap, LungCapData$Age, method = "pearson")
print(corre)
Section 2 Question 2
ei<-((a*0)+(b*1)+(c*2)+(d*3)+(e*4))
ei
varei<-((0-ei)^2+(1-ei)^2+(2-ei)^2+(3-ei)^2+(4-ei)^2)/5
varei