DACSS 603 Fall 2022 Final Project – Draft (Statistical Analysis)

Assessing the Impact of Voter Turnout on Partisan Outcomes in U.S. Presidential Elections since 1980

Author

Nicholas Boonstra

Published

November 14, 2022

Code
library(tidyverse)
── Attaching packages ─────────────────────────────────────── tidyverse 1.3.2 ──
✔ ggplot2 3.3.6      ✔ purrr   0.3.5 
✔ tibble  3.1.8      ✔ dplyr   1.0.10
✔ tidyr   1.2.1      ✔ stringr 1.4.1 
✔ readr   2.1.3      ✔ forcats 0.5.2 
── Conflicts ────────────────────────────────────────── tidyverse_conflicts() ──
✖ dplyr::filter() masks stats::filter()
✖ dplyr::lag()    masks stats::lag()
Code
library(readxl)
library(plm)
Error in library(plm): there is no package called 'plm'
Code
library(lmtest)
Error in library(lmtest): there is no package called 'lmtest'
Code
library(sandwich)
library(stargazer)
Error in library(stargazer): there is no package called 'stargazer'
Code
knitr::opts_chunk$set(echo = TRUE, warning=FALSE, message=FALSE)

Data Read-In and Clean-Up

Election Data

Code
elections_read <- read_csv("_data/mit_election_1976_2020.csv")

elections_read <- elections_read %>% 
  mutate(party_simplified=str_to_lower(party_simplified)) %>% 
  mutate(state=str_to_title(state)) %>% 
  group_by(party_simplified,state,year) %>% 
  summarise(votes=sum(candidatevotes)) %>% 
  ungroup() %>% 
  pivot_wider(
    names_from = party_simplified,
    values_from = votes,
    values_fill = 0
  ) %>% 
  mutate(third = libertarian + other) %>% 
  select(!c(libertarian,other)) %>% 
  mutate(totvotes = democrat + republican + third) %>% 
  mutate(dem_rate = democrat/totvotes) %>% 
  mutate(rep_rate = republican/totvotes) %>% 
  mutate(third_rate = third/totvotes)

head(elections_read,20)
# A tibble: 20 × 9
   state    year democrat republican  third totvotes dem_rate rep_rate third_r…¹
   <chr>   <dbl>    <dbl>      <dbl>  <dbl>    <dbl>    <dbl>    <dbl>     <dbl>
 1 Alabama  1976   659170     504070  19610  1182850    0.557    0.426   0.0166 
 2 Alabama  1980   636730     654192  51007  1341929    0.474    0.488   0.0380 
 3 Alabama  1984   551899     872849  16965  1441713    0.383    0.605   0.0118 
 4 Alabama  1988   549506     815576  13394  1378476    0.399    0.592   0.00972
 5 Alabama  1992   690080     804283 193697  1688060    0.409    0.476   0.115  
 6 Alabama  1996   662165     769044 103140  1534349    0.432    0.501   0.0672 
 7 Alabama  2000   692611     941173  32488  1666272    0.416    0.565   0.0195 
 8 Alabama  2004   693933    1176394  13088  1883415    0.368    0.625   0.00695
 9 Alabama  2008   813479    1266546  19794  2099819    0.387    0.603   0.00943
10 Alabama  2012   795696    1255925  22717  2074338    0.384    0.605   0.0110 
11 Alabama  2016   729547    1318255  75570  2123372    0.344    0.621   0.0356 
12 Alabama  2020   849624    1441170  32488  2323282    0.366    0.620   0.0140 
13 Alaska   1976    44058      71555   7961   123574    0.357    0.579   0.0644 
14 Alaska   1980    41842      86112  30491   158445    0.264    0.543   0.192  
15 Alaska   1984    62007     138377   7221   207605    0.299    0.667   0.0348 
16 Alaska   1988    72584     119251   8281   200116    0.363    0.596   0.0414 
17 Alaska   1992    78294     102000  78212   258506    0.303    0.395   0.303  
18 Alaska   1996    80380     122746  38494   241620    0.333    0.508   0.159  
19 Alaska   2000    79004     167398  39158   285560    0.277    0.586   0.137  
20 Alaska   2004   111025     190889  10684   312598    0.355    0.611   0.0342 
# … with abbreviated variable name ¹​third_rate

The election data was obtained from the MIT Election Lab on October 10, 2022. These data are for U.S. Presidential elections between 1976 and 2020. Because of the availability of other data (namely turnout data), the cases used below will be, in basic models, elections between 1980 and 2020, and, in robust models, elections between 1996 and 2020.

Turnout Data

Code
# 1980 to 2012
turnout <- read_excel("_data/1980-2014 November General Election.xlsx",skip=1)

turnout <- turnout %>% 
  rename("year" = 1) %>% 
  rename("skip2" = 2) %>% 
  rename("skip3" = 3) %>% 
  rename("state" = 4) %>% 
  rename("totballots_vep_rate" = 5) %>% 
  rename("highestoff_vep_rate" = 6) %>% 
  rename("highestoff_vap_rate" = 7) %>% 
  rename("totballots_count" = 8) %>% 
  rename("highestoff_count" = 9) %>% 
  rename("vep_count" = 10) %>% 
  rename("vap_count" = 11) %>% 
  rename("noncitizen_vap_rate" = 12) %>% 
  rename("prison_count" = 13) %>% 
  rename("probation_count" = 14) %>% 
  rename("parole_count" = 15) %>% 
  rename("totfelon_count" = 16) %>% 
  rename("skip17" = 17) %>% 
  select(!contains("skip")) %>% 
  mutate("totfelon_vap_rate" = (totfelon_count/vap_count)*100)


# 2016
turnout_2016 <- read_excel("_data/2016 November General Election.xlsx",skip=1)

turnout_2016 <- turnout_2016 %>% 
  mutate(year=2016) %>% 
  rename("state" = 1) %>% 
  rename("skip2" = 2) %>% 
  rename("skip3" = 3) %>% 
  rename("totballots_vep_rate" = 4) %>% 
  rename("highestoff_vep_rate" = 5) %>% 
  rename("highestoff_vap_rate" = 6) %>% 
  rename("totballots_count" = 7) %>% 
  rename("highestoff_count" = 8) %>% 
  rename("vep_count" = 9) %>% 
  mutate(vep_count=floor(vep_count)) %>% 
  rename("vap_count" = 10) %>% 
  rename("noncitizen_vap_rate" = 11) %>% 
  rename("prison_count" = 12) %>% 
  rename("probation_count" = 13) %>% 
  rename("parole_count" = 14) %>% 
  rename("totfelon_count" = 15) %>% 
  mutate(totfelon_count = floor(totfelon_count)) %>% 
  rename("skip16" = 16) %>% 
  rename("abbrev" = 17) %>% 
  select(!contains("skip")) %>% 
  mutate("totfelon_vap_rate" = (totfelon_count/vap_count)*100) 

elections_read <- turnout_2016 %>% 
  select(c(state,abbrev)) %>% 
  right_join(elections_read)

turnout_2016 <- turnout_2016 %>% 
  select(!contains("abbrev"))


# 2020
turnout_2020 <- read_excel("_data/2020 November General Election.xlsx",skip=1)

turnout_2020 <- turnout_2020 %>% 
  mutate(year=2020) %>% 
  rename("state" = 1) %>% 
  rename("skip2" = 2) %>% 
  rename("skip3" = 3) %>% 
  rename("totballots_count" = 4) %>% 
  rename("highestoff_count" = 5) %>% 
  rename("totballots_vep_rate" = 6) %>% 
  rename("highestoff_vep_rate" = 7) %>% 
  rename("vep_count" = 8) %>% 
  mutate(vep_count = floor(vep_count)) %>% 
  rename("vap_count" = 9) %>% 
  mutate(vap_count = floor(vap_count)) %>% 
  mutate(highestoff_vap_rate = highestoff_count/vap_count) %>% 
  rename("noncitizen_vap_rate" = 10) %>% 
  rename("prison_count" = 11) %>% 
  rename("probation_count" = 12) %>% 
  rename("parole_count" = 13) %>% 
  rename("totfelon_count" = 14) %>% 
  mutate(totfelon_count = floor(totfelon_count)) %>% 
  mutate(totfelon_vap_rate = (totfelon_count/vap_count)*100) %>% 
  rename("skip15" = 15) %>%
  rename("skip16" = 16) %>% 
  select(!contains("skip")) %>% 
  mutate(state = str_replace(state, "[*]", ""))


# putting it all together
turnout <- turnout %>% 
  bind_rows(turnout_2016) %>% 
  bind_rows(turnout_2020) %>% 
  mutate(state=str_to_title(state))

elections_read <- elections_read %>% 
  left_join(turnout)

turnout %>% 
  filter(state!="United States") %>% 
  arrange(state,year) %>% 
  head(.,20)
# A tibble: 20 × 15
    year state   totba…¹ highe…² highe…³ totba…⁴ highe…⁵ vep_c…⁶ vap_c…⁷ nonci…⁸
   <dbl> <chr>     <dbl>   <dbl>   <dbl>   <dbl>   <dbl>   <dbl>   <dbl>   <dbl>
 1  2020 " Note…  NA      NA      NA          NA      NA      NA      NA NA     
 2  1980 "Alaba…  NA       0.492   0.487      NA 1341929 2726249 2753078  0.004 
 3  1982 "Alaba…  NA       0.406   0.401      NA 1128725 2780689 2813033  0.005 
 4  1984 "Alaba…  NA       0.509   0.503      NA 1441713 2831099 2867180  0.005 
 5  1986 "Alaba…  NA       0.431   0.425      NA 1236230 2869652 2911819  0.006 
 6  1988 "Alaba…  NA       0.475   0.467      NA 1378476 2901744 2949934  0.006 
 7  1990 "Alaba…  NA       0.411   0.404      NA 1215889 2956385 3012797  0.007 
 8  1992 "Alaba…  NA       0.557   0.545      NA 1688060 3030549 3096959  0.009 
 9  1994 "Alaba…  NA       0.388   0.379      NA 1201969 3095745 3170782  0.01  
10  1996 "Alaba…  NA       0.488   0.475      NA 1534349 3144249 3227688  0.012 
11  1998 "Alaba…  NA       0.412   0.4        NA 1317842 3202052 3293917  0.013 
12  2000 "Alaba…  NA       0.516   0.501      NA 1672551 3241682 3334576  0.015 
13  2002 "Alaba…  NA       0.415   0.404      NA 1364602 3285643 3371451  0.018 
14  2004 "Alaba…   0.574   0.572   0.552 1890317 1883415 3292608 3427542  0.019 
15  2006 "Alaba…  NA       0.375   0.359      NA 1250401 3338467 3513952  0.023 
16  2008 "Alaba…   0.61    0.608   0.584 2105622 2099819 3454510 3595708  0.022 
17  2010 "Alaba…   0.433   0.43    0.408 1503232 1494273 3472582 3661784  0.028 
18  2012 "Alaba…  NA       0.586   0.56       NA 2074338 3539217 3707440  0.026 
19  2014 "Alaba…   0.332   0.329   0.315 1191274 1180413 3588783 3751844  0.025 
20  2016 "Alaba…   0.591   0.588   0.563 2134061 2123372 3609447 3770142  0.0249
# … with 5 more variables: prison_count <dbl>, probation_count <dbl>,
#   parole_count <dbl>, totfelon_count <dbl>, totfelon_vap_rate <dbl>, and
#   abbreviated variable names ¹​totballots_vep_rate, ²​highestoff_vep_rate,
#   ³​highestoff_vap_rate, ⁴​totballots_count, ⁵​highestoff_count, ⁶​vep_count,
#   ⁷​vap_count, ⁸​noncitizen_vap_rate

Turnout data was obtained from the U.S. Elections Project on October 5 (2016 and 2020 sets) and October 11 (1980-2014 dataset), 2022. The U.S. Elections Project is generally considered the most reliable source of turnout data on U.S. general as well as midterm elections.

Cost of Voting Index (COVI) Data

Code
covi <- read_excel("_data/COVI Values 1996-2022 website.xlsx",
                   skip=1,
                 col_types=c(
                   "skip","text","numeric","skip","skip","numeric","skip","numeric","skip","skip","skip"),
                 col_names=c(
                   "abbrev","year","covi_val","covi_covid"
                 ))

covi <- covi %>% 
  filter(year<2022) %>% 
  mutate(covi_covid = case_when(
    year == 2020 ~ covi_covid,
    T ~ covi_val
  ))

elections_read <- elections_read %>% 
  left_join(covi) %>% 
  select(!abbrev)

head(covi,20)
# A tibble: 20 × 4
   abbrev  year covi_val covi_covid
   <chr>  <dbl>    <dbl>      <dbl>
 1 AL      1996 -0.399     -0.399  
 2 AK      1996  0.664      0.664  
 3 AZ      1996  0.821      0.821  
 4 AR      1996  0.346      0.346  
 5 CA      1996  0.530      0.530  
 6 CO      1996  0.749      0.749  
 7 CT      1996  0.0839     0.0839 
 8 DE      1996  0.359      0.359  
 9 FL      1996 -0.0565    -0.0565 
10 GA      1996  0.00691    0.00691
11 HI      1996  0.312      0.312  
12 ID      1996 -1.18      -1.18   
13 IL      1996  0.254      0.254  
14 IN      1996  0.458      0.458  
15 IA      1996 -0.0370    -0.0370 
16 KS      1996  0.317      0.317  
17 KY      1996  0.484      0.484  
18 LA      1996  0.434      0.434  
19 ME      1996 -2.17      -2.17   
20 MD      1996  0.676      0.676  

The Cost of Voting Index (“COVI”) is an empirical measurement of voting ease and accessibility in the fifty U.S. states. (Unfortunately, this dataset does not include observations for the District of Columbia.) The main substance of the dataset comes from a paper published by professors at Northern Illinois, Jacksonville, and Wuhan Universities (Schraufnagel et al., 2020). The dataset was obtained October 10, 2022.

Because ballot access was a central aspect of the theoretical underpinnings of this study, it felt appropriate to include these COVI data in my analysis. As will be seen below, these data do appear to play a significant role in affecting partisan vote outcomes.

The covi_covid column differs from the covi_val column only for the year 2020, and accounts for the electoral changes made by many states in response to the COVID-19 pandemic in that year. The values from covi_covid are the ones used for this study.

Final Merged Dataset

Code
elections <- elections_read %>% 
  arrange(state,year) %>% 
  mutate(state = as_factor(state)) %>% 
  mutate(year = as_factor(year)) %>% 
  mutate(dem_win = case_when(
    democrat > republican & democrat > third ~ 1,
    T ~ 0
  )) %>% 
  mutate(dem_rate = dem_rate * 100) %>% 
  mutate(rep_rate = rep_rate * 100) %>% 
  mutate(third_rate = third_rate * 100) %>% 
  mutate(totballots_vep_rate = totballots_vep_rate * 100) %>% 
  mutate(highestoff_vep_rate = highestoff_vep_rate * 100) %>% 
  mutate(highestoff_vap_rate = highestoff_vap_rate * 100) %>% 
  mutate(noncitizen_vap_rate = noncitizen_vap_rate * 100)

head(elections,20)
# A tibble: 20 × 25
   state   year  democrat repub…¹  third totvo…² dem_r…³ rep_r…⁴ third…⁵ totba…⁶
   <fct>   <fct>    <dbl>   <dbl>  <dbl>   <dbl>   <dbl>   <dbl>   <dbl>   <dbl>
 1 Alabama 1976    659170  504070  19610 1182850    55.7    42.6   1.66     NA  
 2 Alabama 1980    636730  654192  51007 1341929    47.4    48.8   3.80     NA  
 3 Alabama 1984    551899  872849  16965 1441713    38.3    60.5   1.18     NA  
 4 Alabama 1988    549506  815576  13394 1378476    39.9    59.2   0.972    NA  
 5 Alabama 1992    690080  804283 193697 1688060    40.9    47.6  11.5      NA  
 6 Alabama 1996    662165  769044 103140 1534349    43.2    50.1   6.72     NA  
 7 Alabama 2000    692611  941173  32488 1666272    41.6    56.5   1.95     NA  
 8 Alabama 2004    693933 1176394  13088 1883415    36.8    62.5   0.695    57.4
 9 Alabama 2008    813479 1266546  19794 2099819    38.7    60.3   0.943    61  
10 Alabama 2012    795696 1255925  22717 2074338    38.4    60.5   1.10     NA  
11 Alabama 2016    729547 1318255  75570 2123372    34.4    62.1   3.56     59.1
12 Alabama 2020    849624 1441170  32488 2323282    36.6    62.0   1.40     63.1
13 Alaska  1976     44058   71555   7961  123574    35.7    57.9   6.44     NA  
14 Alaska  1980     41842   86112  30491  158445    26.4    54.3  19.2      60.2
15 Alaska  1984     62007  138377   7221  207605    29.9    66.7   3.48     62.1
16 Alaska  1988     72584  119251   8281  200116    36.3    59.6   4.14     57.3
17 Alaska  1992     78294  102000  78212  258506    30.3    39.5  30.3      67.1
18 Alaska  1996     80380  122746  38494  241620    33.3    50.8  15.9      60.7
19 Alaska  2000     79004  167398  39158  285560    27.7    58.6  13.7      68.7
20 Alaska  2004    111025  190889  10684  312598    35.5    61.1   3.42     69.6
# … with 15 more variables: highestoff_vep_rate <dbl>,
#   highestoff_vap_rate <dbl>, totballots_count <dbl>, highestoff_count <dbl>,
#   vep_count <dbl>, vap_count <dbl>, noncitizen_vap_rate <dbl>,
#   prison_count <dbl>, probation_count <dbl>, parole_count <dbl>,
#   totfelon_count <dbl>, totfelon_vap_rate <dbl>, covi_val <dbl>,
#   covi_covid <dbl>, dem_win <dbl>, and abbreviated variable names
#   ¹​republican, ²​totvotes, ³​dem_rate, ⁴​rep_rate, ⁵​third_rate, …

The final dataframe contains 612 observations (51 states \(\times\) 12 elections) of 25 variables.

Code
colnames(elections)
 [1] "state"               "year"                "democrat"           
 [4] "republican"          "third"               "totvotes"           
 [7] "dem_rate"            "rep_rate"            "third_rate"         
[10] "totballots_vep_rate" "highestoff_vep_rate" "highestoff_vap_rate"
[13] "totballots_count"    "highestoff_count"    "vep_count"          
[16] "vap_count"           "noncitizen_vap_rate" "prison_count"       
[19] "probation_count"     "parole_count"        "totfelon_count"     
[22] "totfelon_vap_rate"   "covi_val"            "covi_covid"         
[25] "dem_win"            

(The party name variables record raw vote totals for each party or party group in a given state and year.)

Visualizations

Turnout Rate and Democratic Vote Share

Code
statelevel_plot <- elections %>%  
  ggplot(aes(x=highestoff_vap_rate,y=dem_rate)) +
  geom_point() +
  geom_smooth(method=lm,se=F) +
  facet_wrap(vars(state)) +
  theme_linedraw() +
  labs(
    title = "Turnout Rates and Democratic Vote Share",
    subtitle = "U.S. Presidential Elections by State*, 1980-2020",
    x = "Turnout Rate (%VAP)",
    y = "Democratic Vote Share (% of votes cast)",
    caption = "*Includes Washington, DC"
  )
# statelevel_plot

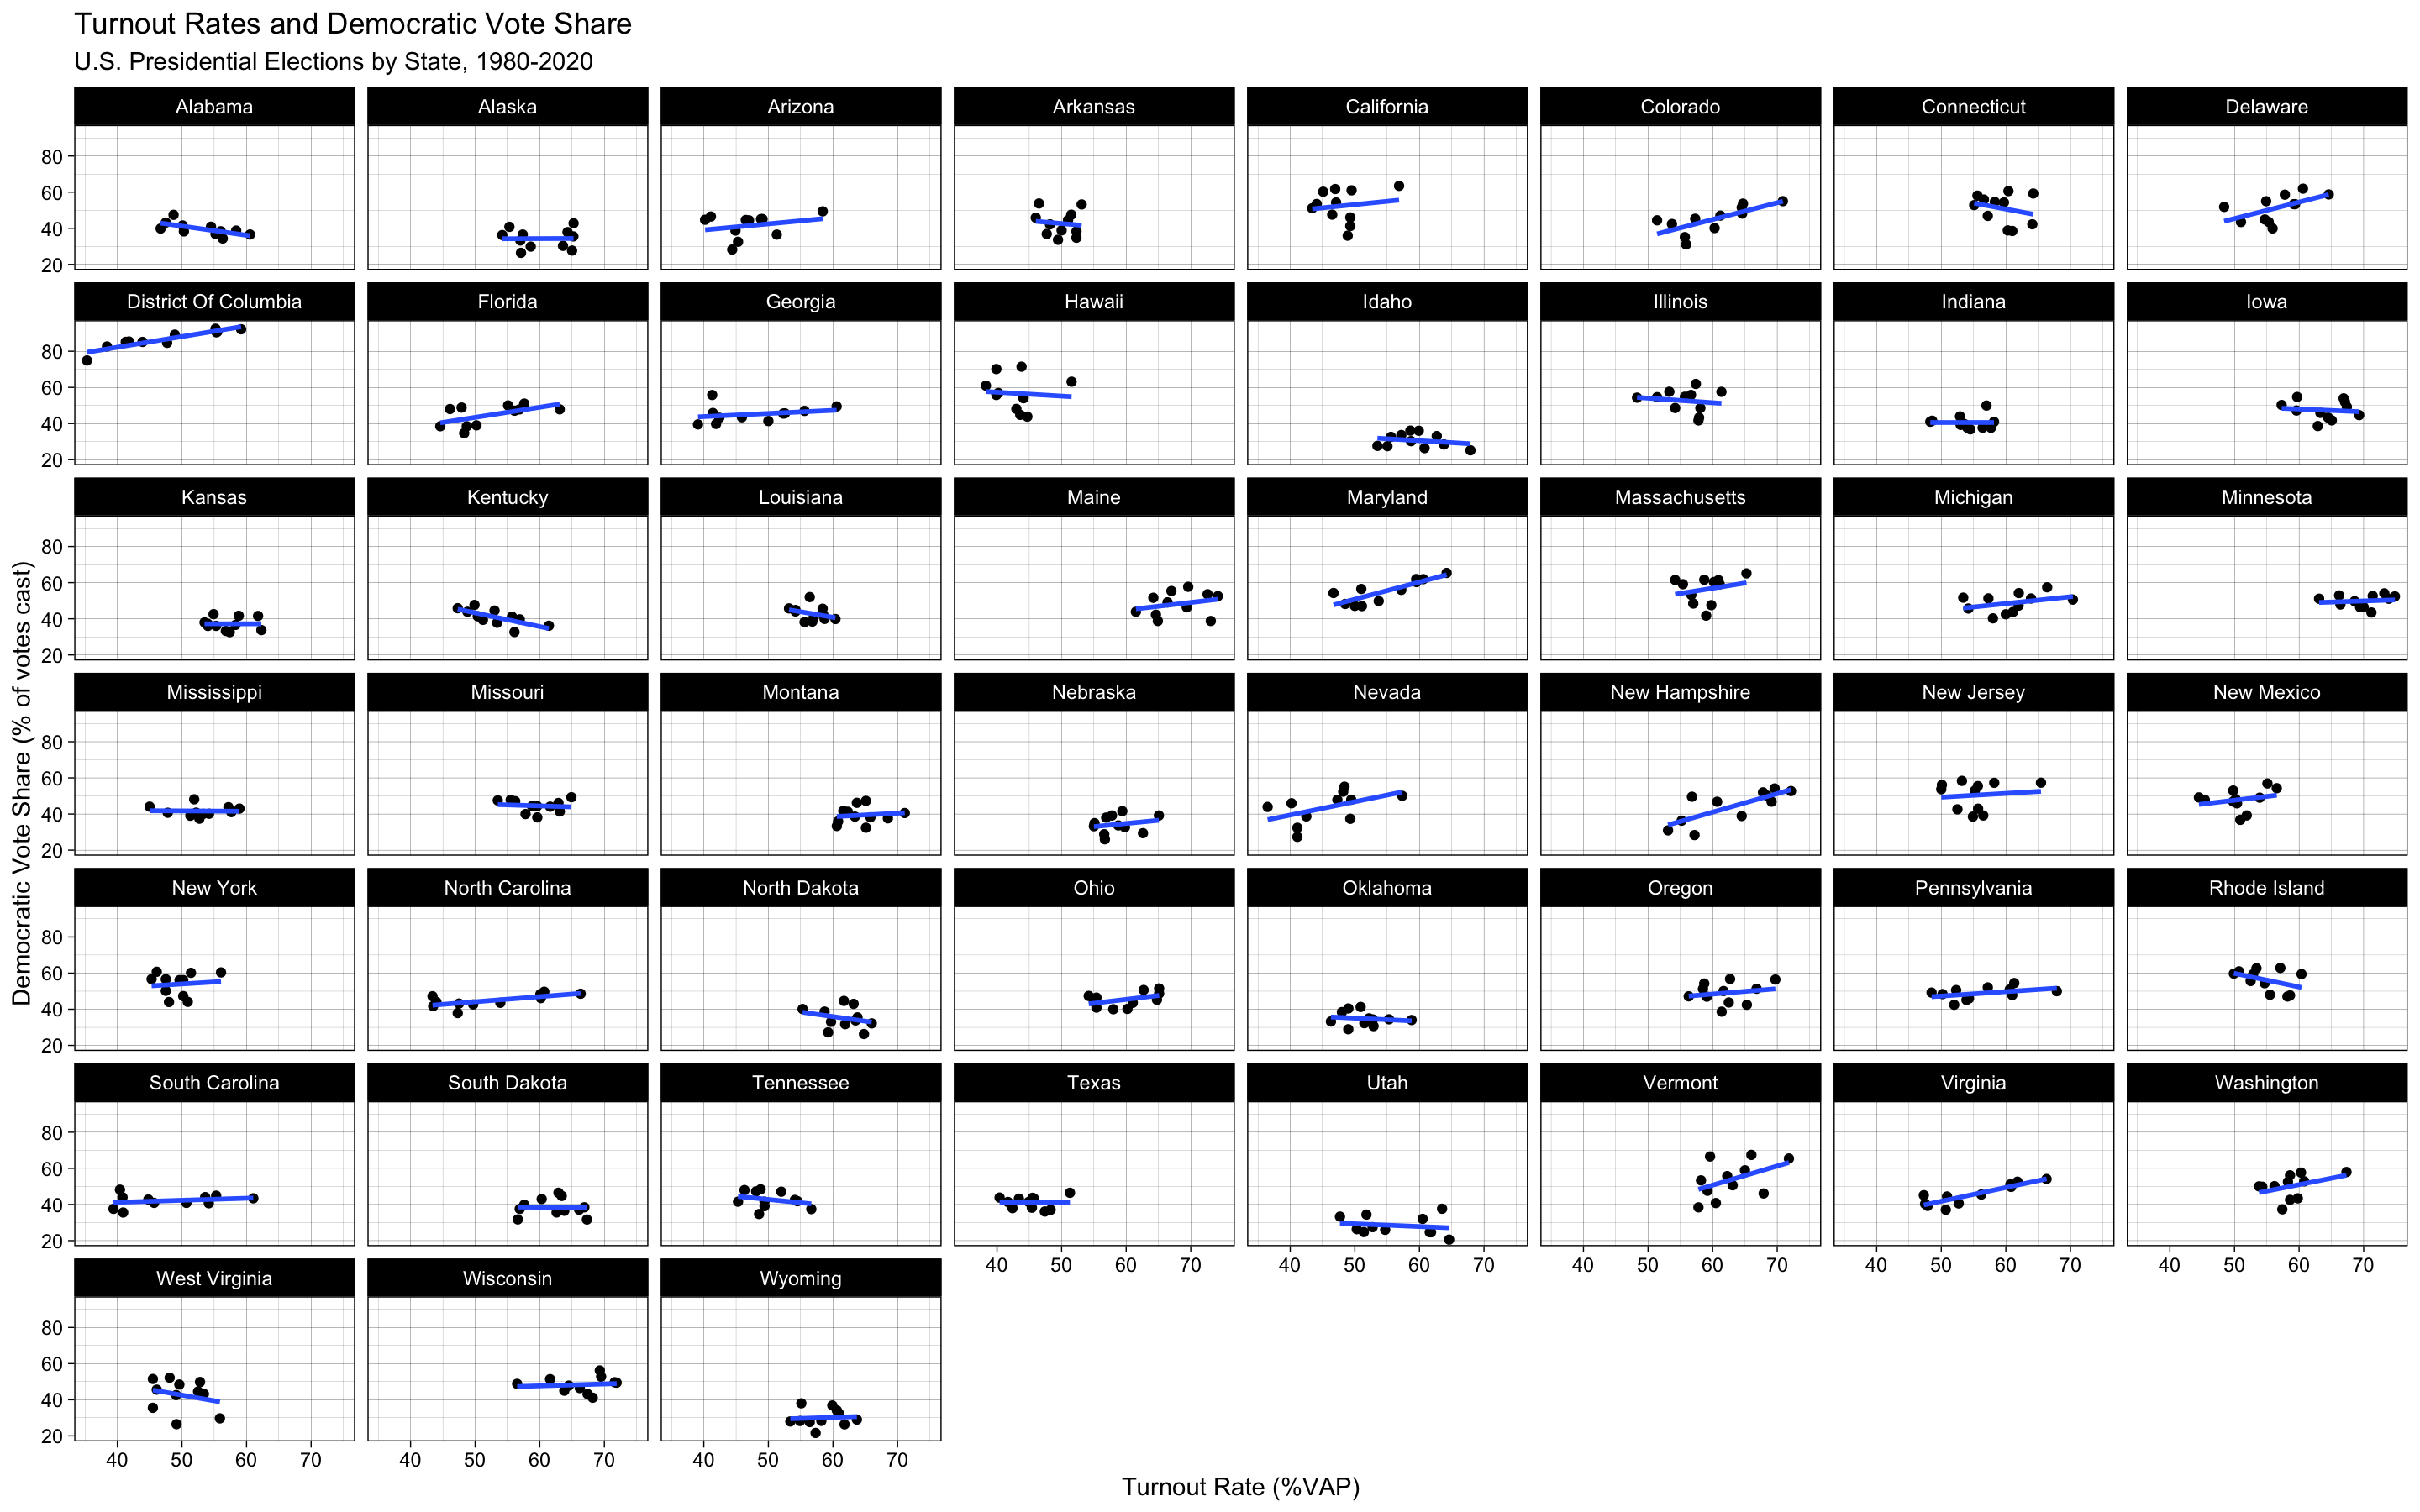
State-by-state plots of Democratic vote share against %VAP Turnout

Effects vary by state, but a number of states demonstrate a positive correlation between turnout rate and Democratic vote share, lending some initial support to the study’s hypothesis.

Cost of Voting Index and Democratic Vote Share

Code
covi_plot <- elections %>% 
  filter(state!="District Of Columbia") %>% 
  ggplot(aes(x=covi_covid,y=dem_rate)) +
  geom_point() +
  geom_smooth(method=lm,se=F) +
  facet_wrap(vars(state)) +
  theme_linedraw() +
  labs(
    title = "Cost of Voting Index Values and Democratic Vote Share",
    subtitle = "U.S. Presidential Elections by State*, 1996-2020",
    x = "Cost of Voting Index",
    y = "Democratic Vote Share (% of votes cast)",
    caption = "*Excludes Washington, DC"
  )
# covi_plot

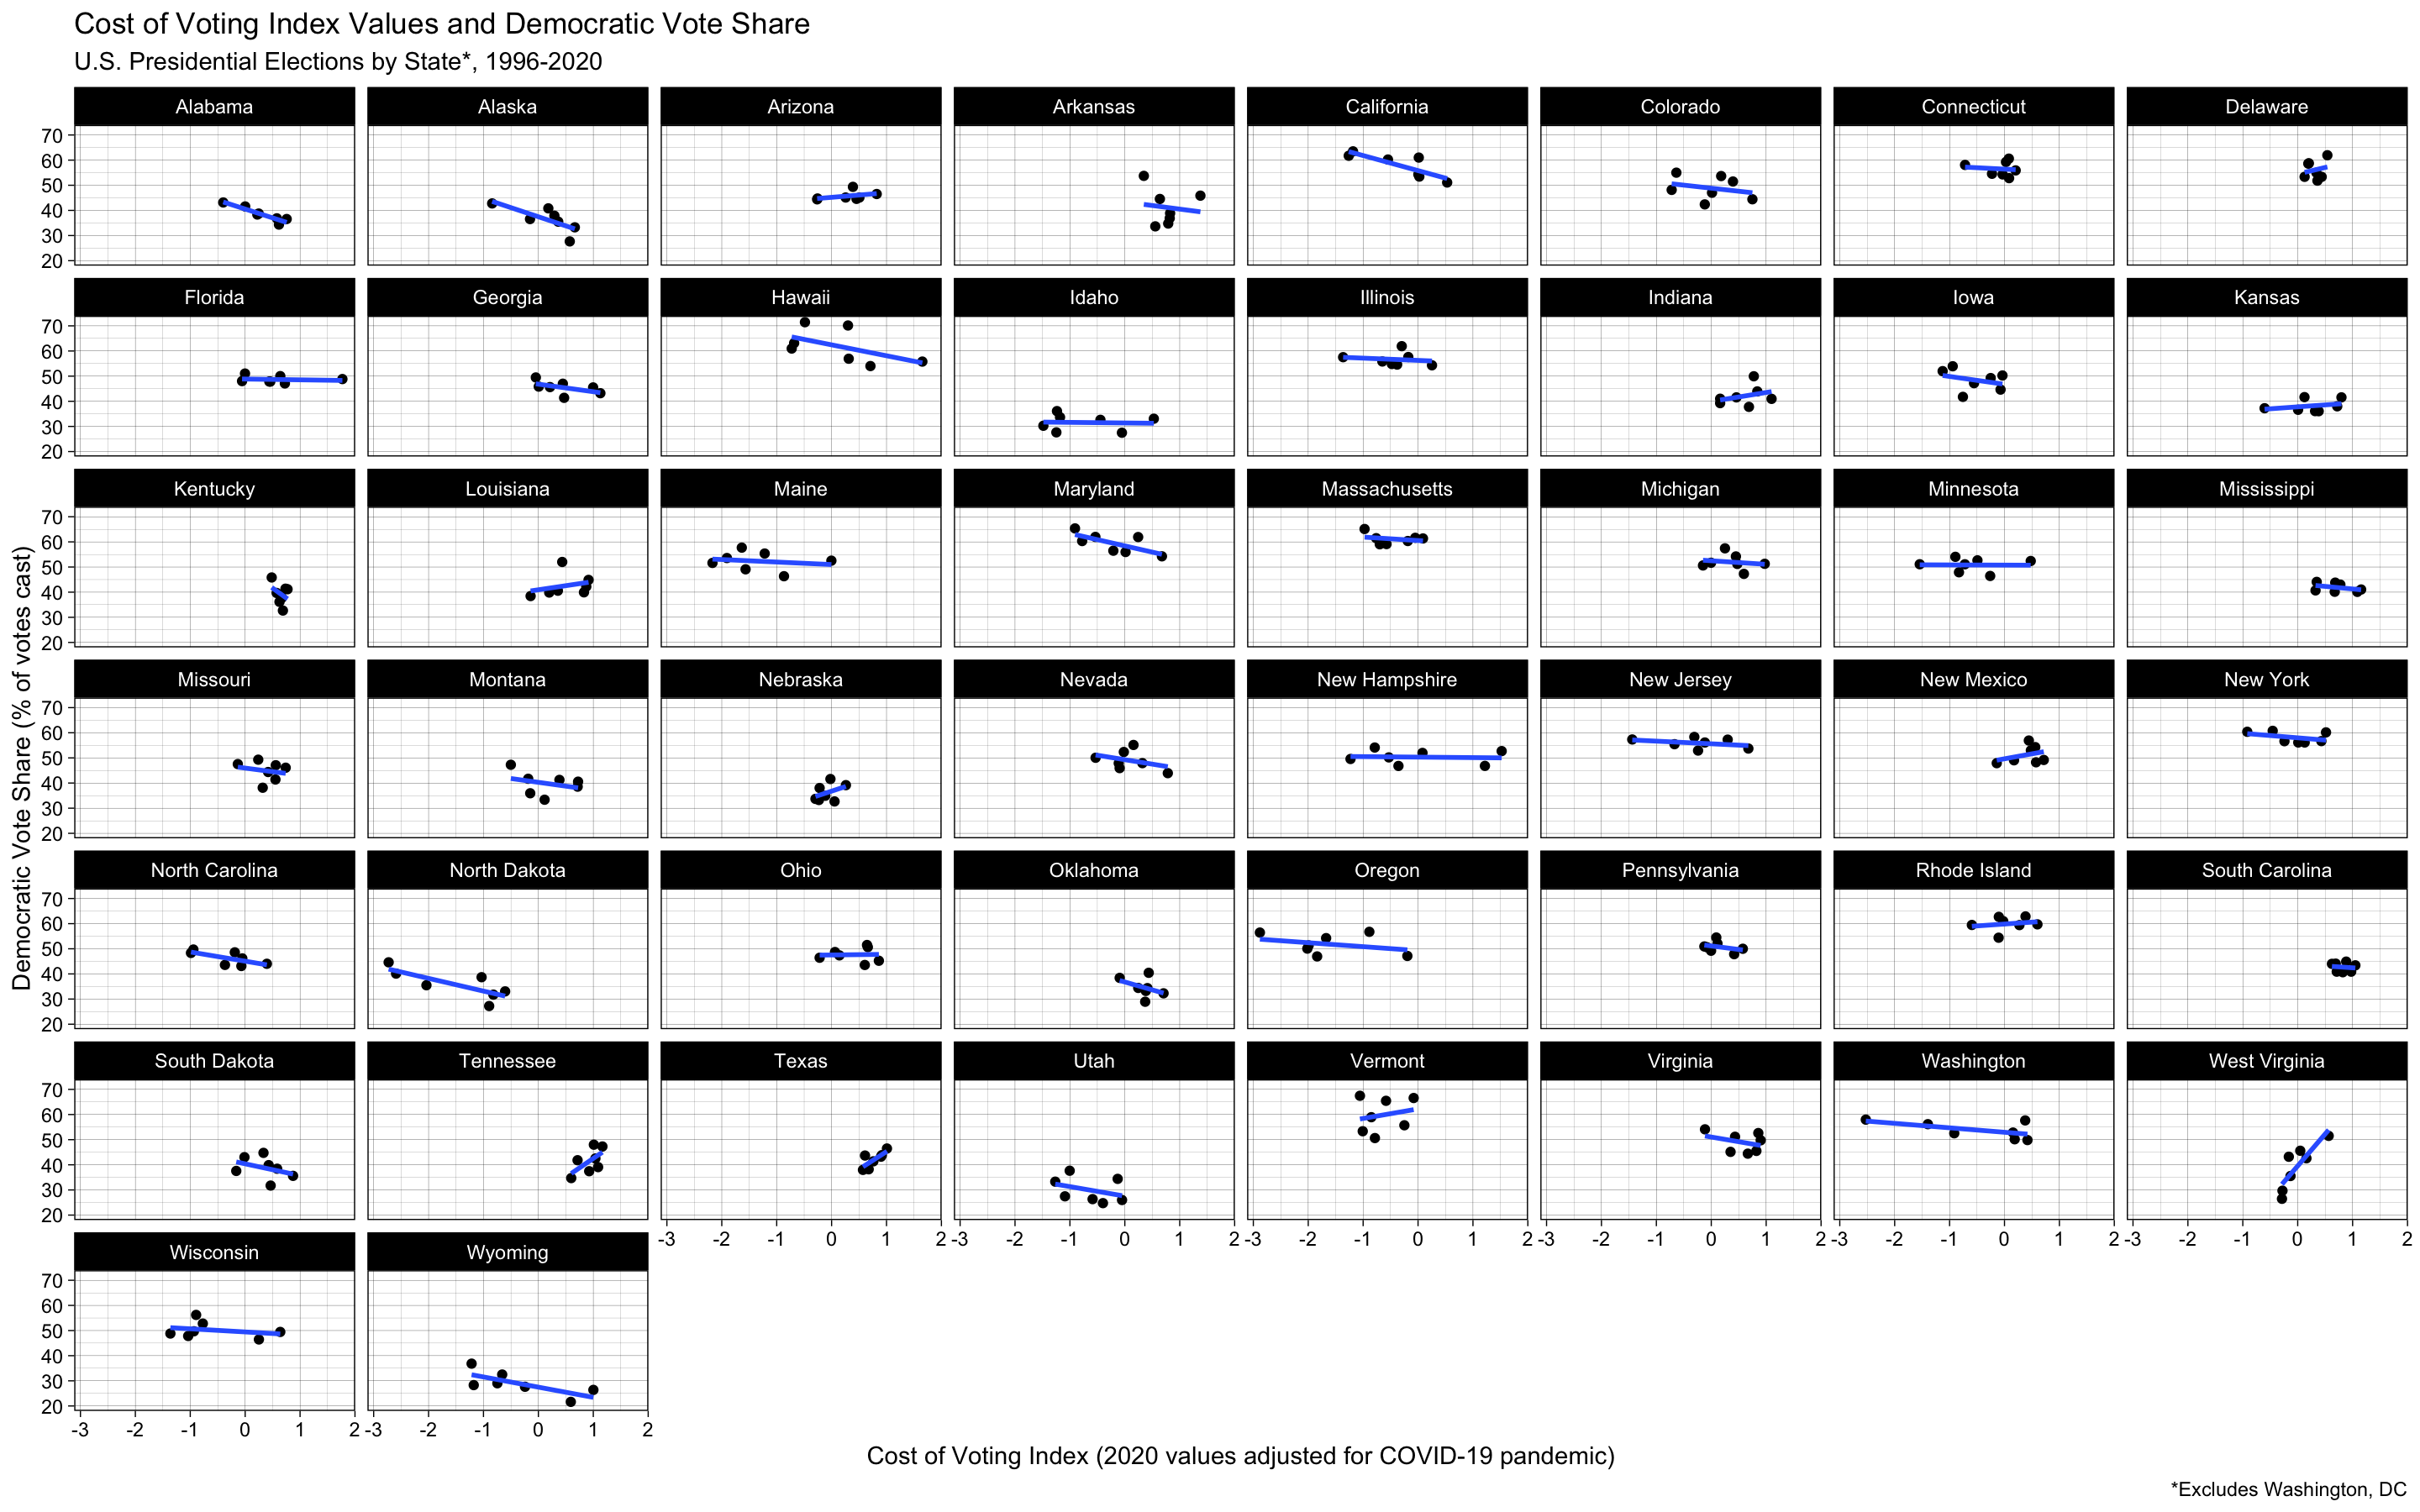
State-by-state plots of Democratic vote share against Cost of Voting Index values

Again, while effects vary by state, a trend emerges across a number of states of a negative correlation between COVI and Democratic vote share – suggesting that Democratic vote share decreases as the cost of voting increases. This effect would also lend credence to the study’s hypothesis and underlying theories about ballot access.

Statistical Analysis

Code
plm1_vap <- plm(
  dem_rate ~
    highestoff_vap_rate,
  index = c("state","year"),
  data = elections,
  model = "within",
  effect = "twoway"
)
Error in plm(dem_rate ~ highestoff_vap_rate, index = c("state", "year"), : could not find function "plm"
Code
plm1_vap_clustered <- coeftest(plm1_vap, vcov. = vcovHC, type = "HC1")
Error in coeftest(plm1_vap, vcov. = vcovHC, type = "HC1"): could not find function "coeftest"
Code
plm1_vep <- plm(
  dem_rate ~
    highestoff_vep_rate,
  index = c("state","year"),
  data = elections,
  model = "within",
  effect = "twoway"
)
Error in plm(dem_rate ~ highestoff_vep_rate, index = c("state", "year"), : could not find function "plm"
Code
plm1_vep_clustered <- coeftest(plm1_vep, vcov. = vcovHC, type = "HC1")
Error in coeftest(plm1_vep, vcov. = vcovHC, type = "HC1"): could not find function "coeftest"
Code
plm3_vap <- plm(
  dem_rate ~ 
    highestoff_vap_rate + covi_covid +
    totfelon_vap_rate + noncitizen_vap_rate + log(vap_count),
  index = c("state","year"),
  data = elections,
  model = "within",
  effect = "twoway"
)
Error in plm(dem_rate ~ highestoff_vap_rate + covi_covid + totfelon_vap_rate + : could not find function "plm"
Code
plm3_vap_clustered <- coeftest(plm3_vap, vcov. = vcovHC, type = "HC1")
Error in coeftest(plm3_vap, vcov. = vcovHC, type = "HC1"): could not find function "coeftest"
Code
plm3_vep <- plm(
  dem_rate ~ 
    highestoff_vep_rate + covi_covid +
    totfelon_vap_rate + noncitizen_vap_rate + log(vap_count),
  index = c("state","year"),
  data = elections,
  model = "within",
  effect = "twoway"
)
Error in plm(dem_rate ~ highestoff_vep_rate + covi_covid + totfelon_vap_rate + : could not find function "plm"
Code
plm3_vep_clustered <- coeftest(plm3_vep, vcov. = vcovHC, type = "HC1")
Error in coeftest(plm3_vep, vcov. = vcovHC, type = "HC1"): could not find function "coeftest"
Code
plm_models <- list(plm1_vap,plm1_vep,plm3_vap,plm3_vep)
Error in eval(expr, envir, enclos): object 'plm1_vap' not found
Code
plm_models_clustered <- list(plm1_vap_clustered,plm1_vep_clustered,plm3_vap_clustered,plm3_vep_clustered)
Error in eval(expr, envir, enclos): object 'plm1_vap_clustered' not found
Code
stargazer(
  plm_models,
  title = "Turnout Rates and Democratic Vote Share, Two-Way Fixed Effects Linear Models",
  type = "text",
  dep.var.caption = "Democratic Vote Share",
  dep.var.labels.include = F,
  covariate.labels = c("Turnout Rate (%VAP)","Turnout Rate (%VEP)","Cost of Voting Index",
                       "Ineligible Felon Rate (%VAP)","Noncitizen Rate (%VAP)","Voting-Age Population (logged)")
)
Error in stargazer(plm_models, title = "Turnout Rates and Democratic Vote Share, Two-Way Fixed Effects Linear Models", : could not find function "stargazer"
Code
stargazer(
  plm_models_clustered,
  title = "Turnout Rates and Democratic Vote Share, Two-Way Fixed Effects Linear Models w/ Clustered SEs",
  type = "text",
  dep.var.caption = "Democratic Vote Share",
  dep.var.labels.include = F,
  covariate.labels = c("Turnout Rate (%VAP)","Turnout Rate(%VEP)","Cost of Voting Index",
                       "Ineligible Felon Rate (%VAP)","Noncitizen Rate (%VAP)","Voting-Age Population (logged)")
)
Error in stargazer(plm_models_clustered, title = "Turnout Rates and Democratic Vote Share, Two-Way Fixed Effects Linear Models w/ Clustered SEs", : could not find function "stargazer"
Code
demwin_logit_basic_vap <- glm(
  dem_win ~ 
    highestoff_vap_rate + state - 1,
  family = binomial(link="logit"),
  data = elections
)
demwin_logit_basic_vap_cl <- coeftest(demwin_logit_basic_vap, vcov. = vcovHC, type = "HC1")
Error in coeftest(demwin_logit_basic_vap, vcov. = vcovHC, type = "HC1"): could not find function "coeftest"
Code
demwin_logit_basic_vep <- glm(
  dem_win ~ 
    highestoff_vep_rate + state - 1,
  family = binomial(link="logit"),
  data = elections
)
demwin_logit_basic_vep_cl <- coeftest(demwin_logit_basic_vep, vcov. = vcovHC, type = "HC1")
Error in coeftest(demwin_logit_basic_vep, vcov. = vcovHC, type = "HC1"): could not find function "coeftest"
Code
demwin_logit_robust_vap <- glm(
  dem_win ~ 
    highestoff_vap_rate + covi_covid + totfelon_vap_rate + noncitizen_vap_rate + log(vap_count) +
    state - 1,
  family = binomial(link="logit"),
  data = elections
)
demwin_logit_robust_vap_cl <- coeftest(demwin_logit_robust_vap, vcov. = vcovHC, type = "HC1")
Error in coeftest(demwin_logit_robust_vap, vcov. = vcovHC, type = "HC1"): could not find function "coeftest"
Code
demwin_logit_robust_vep <- glm(
  dem_win ~ 
    highestoff_vep_rate + covi_covid + totfelon_vap_rate + noncitizen_vap_rate + log(vap_count) +
    state - 1,
  family = binomial(link="logit"),
  data = elections
)
demwin_logit_robust_vep_cl <- coeftest(demwin_logit_robust_vep, vcov. = vcovHC, type = "HC1")
Error in coeftest(demwin_logit_robust_vep, vcov. = vcovHC, type = "HC1"): could not find function "coeftest"
Code
logit_models <- list(demwin_logit_basic_vap,demwin_logit_basic_vep,demwin_logit_robust_vap,demwin_logit_robust_vep)
logit_models_cl <- list(
  demwin_logit_basic_vap_cl,demwin_logit_basic_vep_cl,demwin_logit_robust_vap_cl,demwin_logit_robust_vep_cl
)
Error in eval(expr, envir, enclos): object 'demwin_logit_basic_vap_cl' not found
Code
stargazer(
  logit_models,
  type = "text",
  omit.stat = "aic",
  omit = c(7:57),
  dep.var.caption = "Democratic State Victory",
  title = "Democratic State Win, State-Level Fixed Effects Logit Models",
  covariate.labels = c("Turnout Rate (%VAP)","Turnout Rate (%VEP)","Cost of Voting Index",
                       "Ineligible Felon Rate (%VAP)","Noncitizen Rate (%VAP)","Voting-Age Population (logged)"),
  dep.var.labels.include = F
)
Error in stargazer(logit_models, type = "text", omit.stat = "aic", omit = c(7:57), : could not find function "stargazer"
Code
stargazer(
  logit_models_cl,
  type = "text",
  omit.stat = "aic",
  omit = c(7:57),
  title = "Democratic State Wins, State-Level Fixed Effects Logit Models w/ Clustered SEs",
  dep.var.caption = "Democratic State Victory",
  covariate.labels = c("Turnout Rate (%VAP)","Turnout Rate (%VEP)","Cost of Voting Index",
                       "Ineligible Felon Rate (%VAP)","Noncitizen Rate (%VAP)","Voting-Age Population (logged)"),
  dep.var.labels.include = F
)
Error in stargazer(logit_models_cl, type = "text", omit.stat = "aic", : could not find function "stargazer"
Code
plm_turnout_vap <- plm(
  highestoff_vap_rate ~
    covi_covid + totfelon_vap_rate + noncitizen_vap_rate + log(vap_count),
  index = c("state","year"),
  data = elections,
  method = "within",
  effect = "twoway"
)
Error in plm(highestoff_vap_rate ~ covi_covid + totfelon_vap_rate + noncitizen_vap_rate + : could not find function "plm"
Code
plm_turnout_vap_cl <- coeftest(plm_turnout_vap, vcov. = vcovHC, type = "HC1")
Error in coeftest(plm_turnout_vap, vcov. = vcovHC, type = "HC1"): could not find function "coeftest"
Code
plm_turnout_vep <- plm(
  highestoff_vep_rate ~
    covi_covid + totfelon_vap_rate + noncitizen_vap_rate + log(vap_count),
  index = c("state","year"),
  data = elections,
  method = "within",
  effect = "twoway"
)
Error in plm(highestoff_vep_rate ~ covi_covid + totfelon_vap_rate + noncitizen_vap_rate + : could not find function "plm"
Code
plm_turnout_vep_cl <- coeftest(plm_turnout_vep, vcov. = vcovHC, type = "HC1")
Error in coeftest(plm_turnout_vep, vcov. = vcovHC, type = "HC1"): could not find function "coeftest"
Code
turnout_models <- list(plm_turnout_vap,plm_turnout_vep)
Error in eval(expr, envir, enclos): object 'plm_turnout_vap' not found
Code
turnout_models_cl <- list(plm_turnout_vap_cl,plm_turnout_vep_cl)
Error in eval(expr, envir, enclos): object 'plm_turnout_vap_cl' not found
Code
stargazer(
  turnout_models,
  type = "text",
  title = "Possible Explanatory Variables for Turnout, Two-Way Fixed Effects Linear Models",
  dep.var.caption = "Turnout",
  dep.var.labels = c("%VAP","%VEP"),
  covariate.labels = c("Cost of Voting Index","Inelgibile Felon Rate (%VAP)","Noncitizen Rate (%VAP)",
                      "Voting-Age Population (logged)")
)
Error in stargazer(turnout_models, type = "text", title = "Possible Explanatory Variables for Turnout, Two-Way Fixed Effects Linear Models", : could not find function "stargazer"
Code
stargazer(
  turnout_models_cl,
  type = "text",
  title = "Possible Explanatory Variables for Turnout, Two-Way Fixed Effects Linear Models w/ Clustered SEs",
  dep.var.caption = "Turnout (%VAP, %VEP)",
  dep.var.labels = NULL,
  covariate.labels = c("Cost of Voting Index","Inelgibile Felon Rate (%VAP)","Noncitizen Rate (%VAP)",
                      "Voting-Age Population (logged)")
)
Error in stargazer(turnout_models_cl, type = "text", title = "Possible Explanatory Variables for Turnout, Two-Way Fixed Effects Linear Models w/ Clustered SEs", : could not find function "stargazer"