Code
library(tidyverse)
library(ggplot2)
library(alr4)
library(smss)
library(GGally)

knitr::opts_chunk$set(echo = FALSE, warning=FALSE, message = FALSE)Dane Shelton
August 2, 2022
We are using UN11 data:
Predictor/Explanatory/IV - ppgdp Per Person GDP
Response/DV - fertility Fertility Rate per 1000
List of 96
 $ line                      :List of 6
  ..$ colour       : chr "black"
  ..$ size         : num 0.5
  ..$ linetype     : num 1
  ..$ lineend      : chr "butt"
  ..$ arrow        : logi FALSE
  ..$ inherit.blank: logi TRUE
  ..- attr(*, "class")= chr [1:2] "element_line" "element"
 $ rect                      :List of 5
  ..$ fill         : chr "white"
  ..$ colour       : chr "black"
  ..$ size         : num 0.5
  ..$ linetype     : num 1
  ..$ inherit.blank: logi TRUE
  ..- attr(*, "class")= chr [1:2] "element_rect" "element"
 $ text                      :List of 11
  ..$ family       : chr ""
  ..$ face         : chr "plain"
  ..$ colour       : chr "black"
  ..$ size         : num 11
  ..$ hjust        : num 0.5
  ..$ vjust        : num 0.5
  ..$ angle        : num 0
  ..$ lineheight   : num 0.9
  ..$ margin       : 'margin' num [1:4] 0points 0points 0points 0points
  .. ..- attr(*, "unit")= int 8
  ..$ debug        : logi FALSE
  ..$ inherit.blank: logi TRUE
  ..- attr(*, "class")= chr [1:2] "element_text" "element"
 $ title                     : chr "Fertility Rate x ppGDP"
 $ aspect.ratio              : NULL
 $ axis.title                : NULL
 $ axis.title.x              :List of 11
  ..$ family       : NULL
  ..$ face         : NULL
  ..$ colour       : NULL
  ..$ size         : NULL
  ..$ hjust        : NULL
  ..$ vjust        : num 1
  ..$ angle        : NULL
  ..$ lineheight   : NULL
  ..$ margin       : 'margin' num [1:4] 2.75points 0points 0points 0points
  .. ..- attr(*, "unit")= int 8
  ..$ debug        : NULL
  ..$ inherit.blank: logi TRUE
  ..- attr(*, "class")= chr [1:2] "element_text" "element"
 $ axis.title.x.top          :List of 11
  ..$ family       : NULL
  ..$ face         : NULL
  ..$ colour       : NULL
  ..$ size         : NULL
  ..$ hjust        : NULL
  ..$ vjust        : num 0
  ..$ angle        : NULL
  ..$ lineheight   : NULL
  ..$ margin       : 'margin' num [1:4] 0points 0points 2.75points 0points
  .. ..- attr(*, "unit")= int 8
  ..$ debug        : NULL
  ..$ inherit.blank: logi TRUE
  ..- attr(*, "class")= chr [1:2] "element_text" "element"
 $ axis.title.x.bottom       : NULL
 $ axis.title.y              :List of 11
  ..$ family       : NULL
  ..$ face         : NULL
  ..$ colour       : NULL
  ..$ size         : NULL
  ..$ hjust        : NULL
  ..$ vjust        : num 1
  ..$ angle        : num 90
  ..$ lineheight   : NULL
  ..$ margin       : 'margin' num [1:4] 0points 2.75points 0points 0points
  .. ..- attr(*, "unit")= int 8
  ..$ debug        : NULL
  ..$ inherit.blank: logi TRUE
  ..- attr(*, "class")= chr [1:2] "element_text" "element"
 $ axis.title.y.left         : NULL
 $ axis.title.y.right        :List of 11
  ..$ family       : NULL
  ..$ face         : NULL
  ..$ colour       : NULL
  ..$ size         : NULL
  ..$ hjust        : NULL
  ..$ vjust        : num 0
  ..$ angle        : num -90
  ..$ lineheight   : NULL
  ..$ margin       : 'margin' num [1:4] 0points 0points 0points 2.75points
  .. ..- attr(*, "unit")= int 8
  ..$ debug        : NULL
  ..$ inherit.blank: logi TRUE
  ..- attr(*, "class")= chr [1:2] "element_text" "element"
 $ axis.text                 :List of 11
  ..$ family       : NULL
  ..$ face         : NULL
  ..$ colour       : chr "grey30"
  ..$ size         : 'rel' num 0.8
  ..$ hjust        : NULL
  ..$ vjust        : NULL
  ..$ angle        : NULL
  ..$ lineheight   : NULL
  ..$ margin       : NULL
  ..$ debug        : NULL
  ..$ inherit.blank: logi TRUE
  ..- attr(*, "class")= chr [1:2] "element_text" "element"
 $ axis.text.x               :List of 11
  ..$ family       : NULL
  ..$ face         : NULL
  ..$ colour       : NULL
  ..$ size         : NULL
  ..$ hjust        : NULL
  ..$ vjust        : num 1
  ..$ angle        : NULL
  ..$ lineheight   : NULL
  ..$ margin       : 'margin' num [1:4] 2.2points 0points 0points 0points
  .. ..- attr(*, "unit")= int 8
  ..$ debug        : NULL
  ..$ inherit.blank: logi TRUE
  ..- attr(*, "class")= chr [1:2] "element_text" "element"
 $ axis.text.x.top           :List of 11
  ..$ family       : NULL
  ..$ face         : NULL
  ..$ colour       : NULL
  ..$ size         : NULL
  ..$ hjust        : NULL
  ..$ vjust        : num 0
  ..$ angle        : NULL
  ..$ lineheight   : NULL
  ..$ margin       : 'margin' num [1:4] 0points 0points 2.2points 0points
  .. ..- attr(*, "unit")= int 8
  ..$ debug        : NULL
  ..$ inherit.blank: logi TRUE
  ..- attr(*, "class")= chr [1:2] "element_text" "element"
 $ axis.text.x.bottom        : NULL
 $ axis.text.y               :List of 11
  ..$ family       : NULL
  ..$ face         : NULL
  ..$ colour       : NULL
  ..$ size         : NULL
  ..$ hjust        : num 1
  ..$ vjust        : NULL
  ..$ angle        : NULL
  ..$ lineheight   : NULL
  ..$ margin       : 'margin' num [1:4] 0points 2.2points 0points 0points
  .. ..- attr(*, "unit")= int 8
  ..$ debug        : NULL
  ..$ inherit.blank: logi TRUE
  ..- attr(*, "class")= chr [1:2] "element_text" "element"
 $ axis.text.y.left          : NULL
 $ axis.text.y.right         :List of 11
  ..$ family       : NULL
  ..$ face         : NULL
  ..$ colour       : NULL
  ..$ size         : NULL
  ..$ hjust        : num 0
  ..$ vjust        : NULL
  ..$ angle        : NULL
  ..$ lineheight   : NULL
  ..$ margin       : 'margin' num [1:4] 0points 0points 0points 2.2points
  .. ..- attr(*, "unit")= int 8
  ..$ debug        : NULL
  ..$ inherit.blank: logi TRUE
  ..- attr(*, "class")= chr [1:2] "element_text" "element"
 $ axis.ticks                : list()
  ..- attr(*, "class")= chr [1:2] "element_blank" "element"
 $ axis.ticks.x              : NULL
 $ axis.ticks.x.top          : NULL
 $ axis.ticks.x.bottom       : NULL
 $ axis.ticks.y              : NULL
 $ axis.ticks.y.left         : NULL
 $ axis.ticks.y.right        : NULL
 $ axis.ticks.length         : 'simpleUnit' num 2.75points
  ..- attr(*, "unit")= int 8
 $ axis.ticks.length.x       : NULL
 $ axis.ticks.length.x.top   : NULL
 $ axis.ticks.length.x.bottom: NULL
 $ axis.ticks.length.y       : NULL
 $ axis.ticks.length.y.left  : NULL
 $ axis.ticks.length.y.right : NULL
 $ axis.line                 : list()
  ..- attr(*, "class")= chr [1:2] "element_blank" "element"
 $ axis.line.x               : NULL
 $ axis.line.x.top           : NULL
 $ axis.line.x.bottom        : NULL
 $ axis.line.y               : NULL
 $ axis.line.y.left          : NULL
 $ axis.line.y.right         : NULL
 $ legend.background         : list()
  ..- attr(*, "class")= chr [1:2] "element_blank" "element"
 $ legend.margin             : 'margin' num [1:4] 5.5points 5.5points 5.5points 5.5points
  ..- attr(*, "unit")= int 8
 $ legend.spacing            : 'simpleUnit' num 11points
  ..- attr(*, "unit")= int 8
 $ legend.spacing.x          : NULL
 $ legend.spacing.y          : NULL
 $ legend.key                : list()
  ..- attr(*, "class")= chr [1:2] "element_blank" "element"
 $ legend.key.size           : 'simpleUnit' num 1.2lines
  ..- attr(*, "unit")= int 3
 $ legend.key.height         : NULL
 $ legend.key.width          : NULL
 $ legend.text               :List of 11
  ..$ family       : NULL
  ..$ face         : NULL
  ..$ colour       : NULL
  ..$ size         : 'rel' num 0.8
  ..$ hjust        : NULL
  ..$ vjust        : NULL
  ..$ angle        : NULL
  ..$ lineheight   : NULL
  ..$ margin       : NULL
  ..$ debug        : NULL
  ..$ inherit.blank: logi TRUE
  ..- attr(*, "class")= chr [1:2] "element_text" "element"
 $ legend.text.align         : NULL
 $ legend.title              :List of 11
  ..$ family       : NULL
  ..$ face         : NULL
  ..$ colour       : NULL
  ..$ size         : NULL
  ..$ hjust        : num 0
  ..$ vjust        : NULL
  ..$ angle        : NULL
  ..$ lineheight   : NULL
  ..$ margin       : NULL
  ..$ debug        : NULL
  ..$ inherit.blank: logi TRUE
  ..- attr(*, "class")= chr [1:2] "element_text" "element"
 $ legend.title.align        : NULL
 $ legend.position           : chr "right"
 $ legend.direction          : NULL
 $ legend.justification      : chr "center"
 $ legend.box                : NULL
 $ legend.box.just           : NULL
 $ legend.box.margin         : 'margin' num [1:4] 0cm 0cm 0cm 0cm
  ..- attr(*, "unit")= int 1
 $ legend.box.background     : list()
  ..- attr(*, "class")= chr [1:2] "element_blank" "element"
 $ legend.box.spacing        : 'simpleUnit' num 11points
  ..- attr(*, "unit")= int 8
 $ panel.background          : list()
  ..- attr(*, "class")= chr [1:2] "element_blank" "element"
 $ panel.border              : list()
  ..- attr(*, "class")= chr [1:2] "element_blank" "element"
 $ panel.spacing             : 'simpleUnit' num 5.5points
  ..- attr(*, "unit")= int 8
 $ panel.spacing.x           : NULL
 $ panel.spacing.y           : NULL
 $ panel.grid                :List of 6
  ..$ colour       : chr "grey92"
  ..$ size         : NULL
  ..$ linetype     : NULL
  ..$ lineend      : NULL
  ..$ arrow        : logi FALSE
  ..$ inherit.blank: logi TRUE
  ..- attr(*, "class")= chr [1:2] "element_line" "element"
 $ panel.grid.major          : NULL
 $ panel.grid.minor          :List of 6
  ..$ colour       : NULL
  ..$ size         : 'rel' num 0.5
  ..$ linetype     : NULL
  ..$ lineend      : NULL
  ..$ arrow        : logi FALSE
  ..$ inherit.blank: logi TRUE
  ..- attr(*, "class")= chr [1:2] "element_line" "element"
 $ panel.grid.major.x        : NULL
 $ panel.grid.major.y        : NULL
 $ panel.grid.minor.x        : NULL
 $ panel.grid.minor.y        : NULL
 $ panel.ontop               : logi FALSE
 $ plot.background           : list()
  ..- attr(*, "class")= chr [1:2] "element_blank" "element"
 $ plot.title                :List of 11
  ..$ family       : NULL
  ..$ face         : NULL
  ..$ colour       : NULL
  ..$ size         : 'rel' num 1.2
  ..$ hjust        : num 0
  ..$ vjust        : num 1
  ..$ angle        : NULL
  ..$ lineheight   : NULL
  ..$ margin       : 'margin' num [1:4] 0points 0points 5.5points 0points
  .. ..- attr(*, "unit")= int 8
  ..$ debug        : NULL
  ..$ inherit.blank: logi TRUE
  ..- attr(*, "class")= chr [1:2] "element_text" "element"
 $ plot.title.position       : chr "panel"
 $ plot.subtitle             :List of 11
  ..$ family       : NULL
  ..$ face         : NULL
  ..$ colour       : NULL
  ..$ size         : NULL
  ..$ hjust        : num 0
  ..$ vjust        : num 1
  ..$ angle        : NULL
  ..$ lineheight   : NULL
  ..$ margin       : 'margin' num [1:4] 0points 0points 5.5points 0points
  .. ..- attr(*, "unit")= int 8
  ..$ debug        : NULL
  ..$ inherit.blank: logi TRUE
  ..- attr(*, "class")= chr [1:2] "element_text" "element"
 $ plot.caption              :List of 11
  ..$ family       : NULL
  ..$ face         : NULL
  ..$ colour       : NULL
  ..$ size         : 'rel' num 0.8
  ..$ hjust        : num 1
  ..$ vjust        : num 1
  ..$ angle        : NULL
  ..$ lineheight   : NULL
  ..$ margin       : 'margin' num [1:4] 5.5points 0points 0points 0points
  .. ..- attr(*, "unit")= int 8
  ..$ debug        : NULL
  ..$ inherit.blank: logi TRUE
  ..- attr(*, "class")= chr [1:2] "element_text" "element"
 $ plot.caption.position     : chr "panel"
 $ plot.tag                  :List of 11
  ..$ family       : NULL
  ..$ face         : NULL
  ..$ colour       : NULL
  ..$ size         : 'rel' num 1.2
  ..$ hjust        : num 0.5
  ..$ vjust        : num 0.5
  ..$ angle        : NULL
  ..$ lineheight   : NULL
  ..$ margin       : NULL
  ..$ debug        : NULL
  ..$ inherit.blank: logi TRUE
  ..- attr(*, "class")= chr [1:2] "element_text" "element"
 $ plot.tag.position         : chr "topleft"
 $ plot.margin               : 'margin' num [1:4] 5.5points 5.5points 5.5points 5.5points
  ..- attr(*, "unit")= int 8
 $ strip.background          : list()
  ..- attr(*, "class")= chr [1:2] "element_blank" "element"
 $ strip.background.x        : NULL
 $ strip.background.y        : NULL
 $ strip.placement           : chr "inside"
 $ strip.text                :List of 11
  ..$ family       : NULL
  ..$ face         : NULL
  ..$ colour       : chr "grey10"
  ..$ size         : 'rel' num 0.8
  ..$ hjust        : NULL
  ..$ vjust        : NULL
  ..$ angle        : NULL
  ..$ lineheight   : NULL
  ..$ margin       : 'margin' num [1:4] 4.4points 4.4points 4.4points 4.4points
  .. ..- attr(*, "unit")= int 8
  ..$ debug        : NULL
  ..$ inherit.blank: logi TRUE
  ..- attr(*, "class")= chr [1:2] "element_text" "element"
 $ strip.text.x              : NULL
 $ strip.text.y              :List of 11
  ..$ family       : NULL
  ..$ face         : NULL
  ..$ colour       : NULL
  ..$ size         : NULL
  ..$ hjust        : NULL
  ..$ vjust        : NULL
  ..$ angle        : num -90
  ..$ lineheight   : NULL
  ..$ margin       : NULL
  ..$ debug        : NULL
  ..$ inherit.blank: logi TRUE
  ..- attr(*, "class")= chr [1:2] "element_text" "element"
 $ strip.switch.pad.grid     : 'simpleUnit' num 2.75points
  ..- attr(*, "unit")= int 8
 $ strip.switch.pad.wrap     : 'simpleUnit' num 2.75points
  ..- attr(*, "unit")= int 8
 $ strip.text.y.left         :List of 11
  ..$ family       : NULL
  ..$ face         : NULL
  ..$ colour       : NULL
  ..$ size         : NULL
  ..$ hjust        : NULL
  ..$ vjust        : NULL
  ..$ angle        : num 90
  ..$ lineheight   : NULL
  ..$ margin       : NULL
  ..$ debug        : NULL
  ..$ inherit.blank: logi TRUE
  ..- attr(*, "class")= chr [1:2] "element_text" "element"
 $ x                         : chr "Per Person GDP (USD)"
 $ y                         : chr "Fertility   Rate per 1000"
 $ caption                   : chr "Fig 1.1.2"
 - attr(*, "class")= chr [1:2] "theme" "gg"
 - attr(*, "complete")= logi TRUE
 - attr(*, "validate")= logi TRUE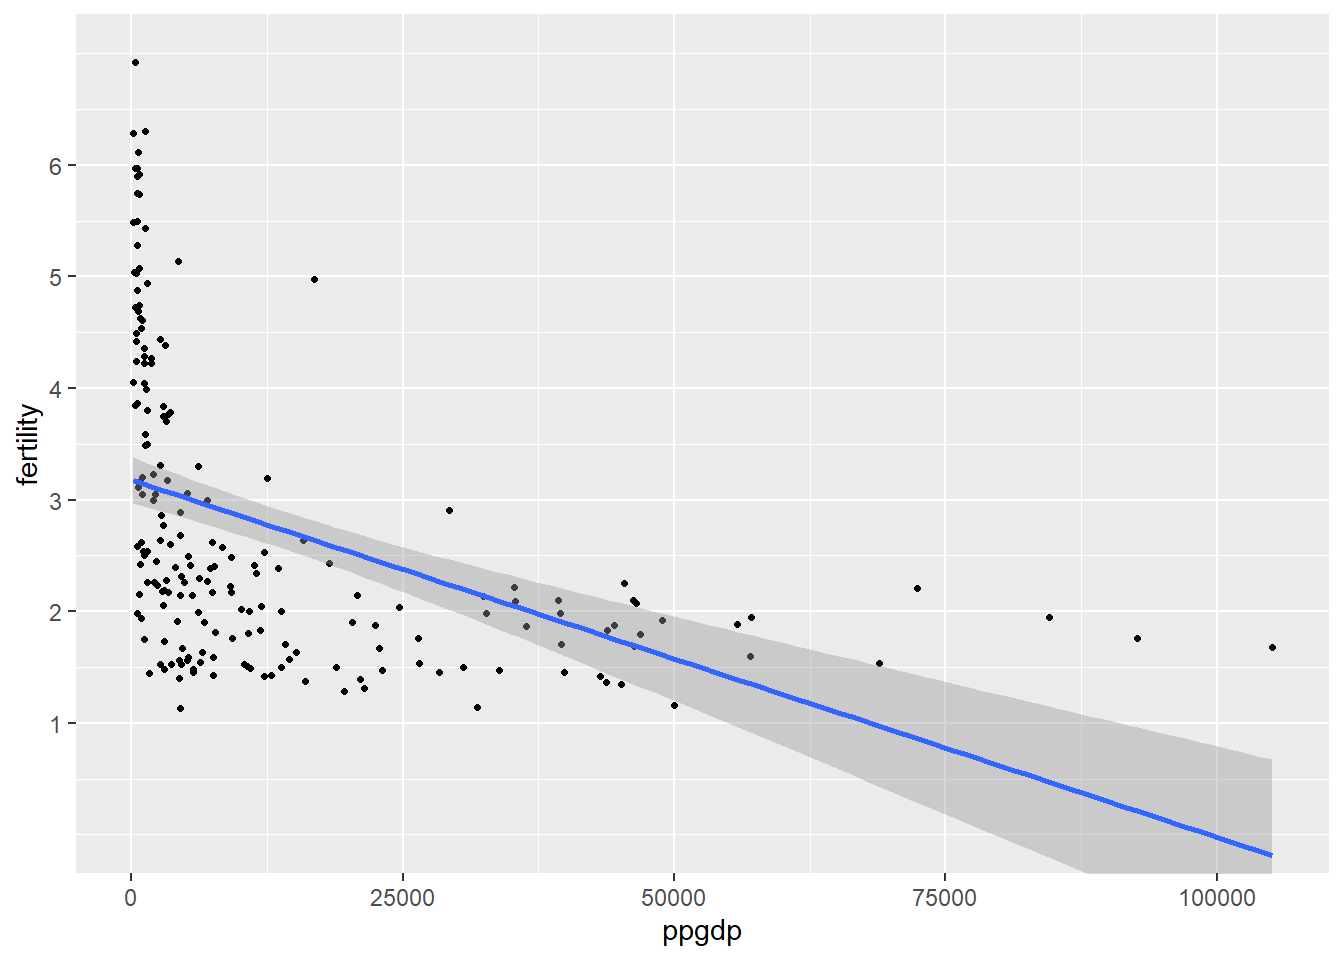
No, our scatter plot appears to have a negative exponential relationship; as ppgdp increase, fertility decreases at a nonlinear rate.
NOTE: If anyone knows why it is printing the above output as well as the graph please send a comment on Google Classroom or Piazza!
 x log(gdp)-1.png)
Now, after using a log transformation on both x and y, our scatter plot appears to have a negative linear relationship; as ppgdp increase, fertility decreases at a linear rate. This transformation makes these variabels appropriate for linear regression.
a) The slope of the regression line will be divided by 1.33 to represent the adjustment to GBP. \(1 USD * (1 GBP/1.33 USD)\) leaves us with just GBP. The slope is reduced by approximately 25 percent.
b) The correlation between the explanatory variable and the response will not change.
Water Scatterplot Matrix
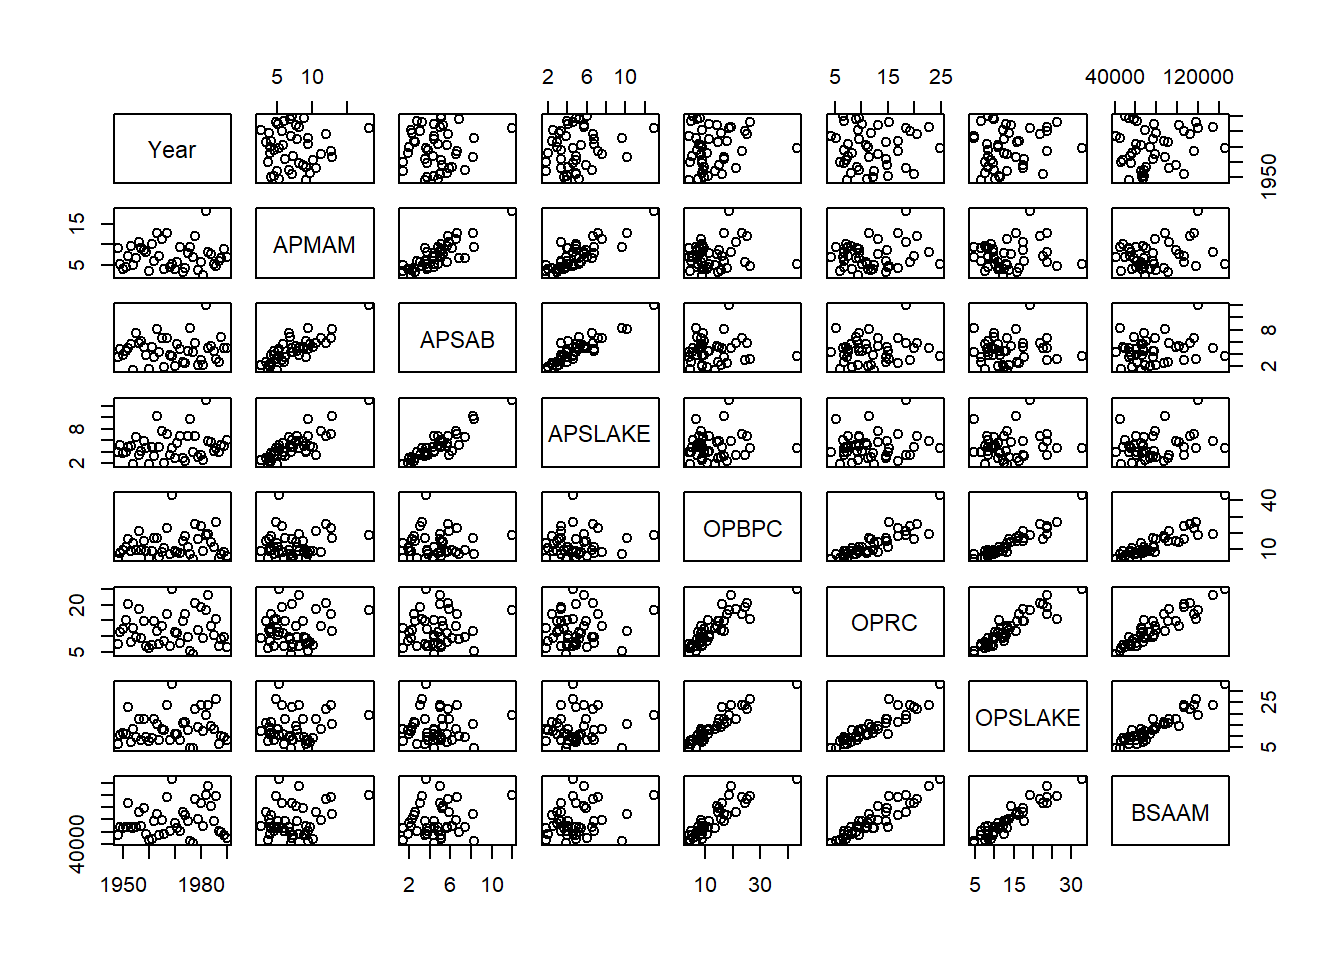
The rightmost column uses BSAAM as a response variable to the preciptation values at the various sites over the years 1948-1990. Inspecting the plots on this column closer, we can see that BSAAM has a strong positive correlation with OPSLAKE, OPRC, and OBPBC. There is a much weaker positive relationship between BSAAM and APSLAKE, APSAB, and APSMAM. If we were attempting to predict stream runoff volume, it would be best to observe and use the values of OPSLAKE, OPRC, and OBPBC to create our model. These locations’ precipitation values are highly correlated with stream runoff volume each year.
Rateprof
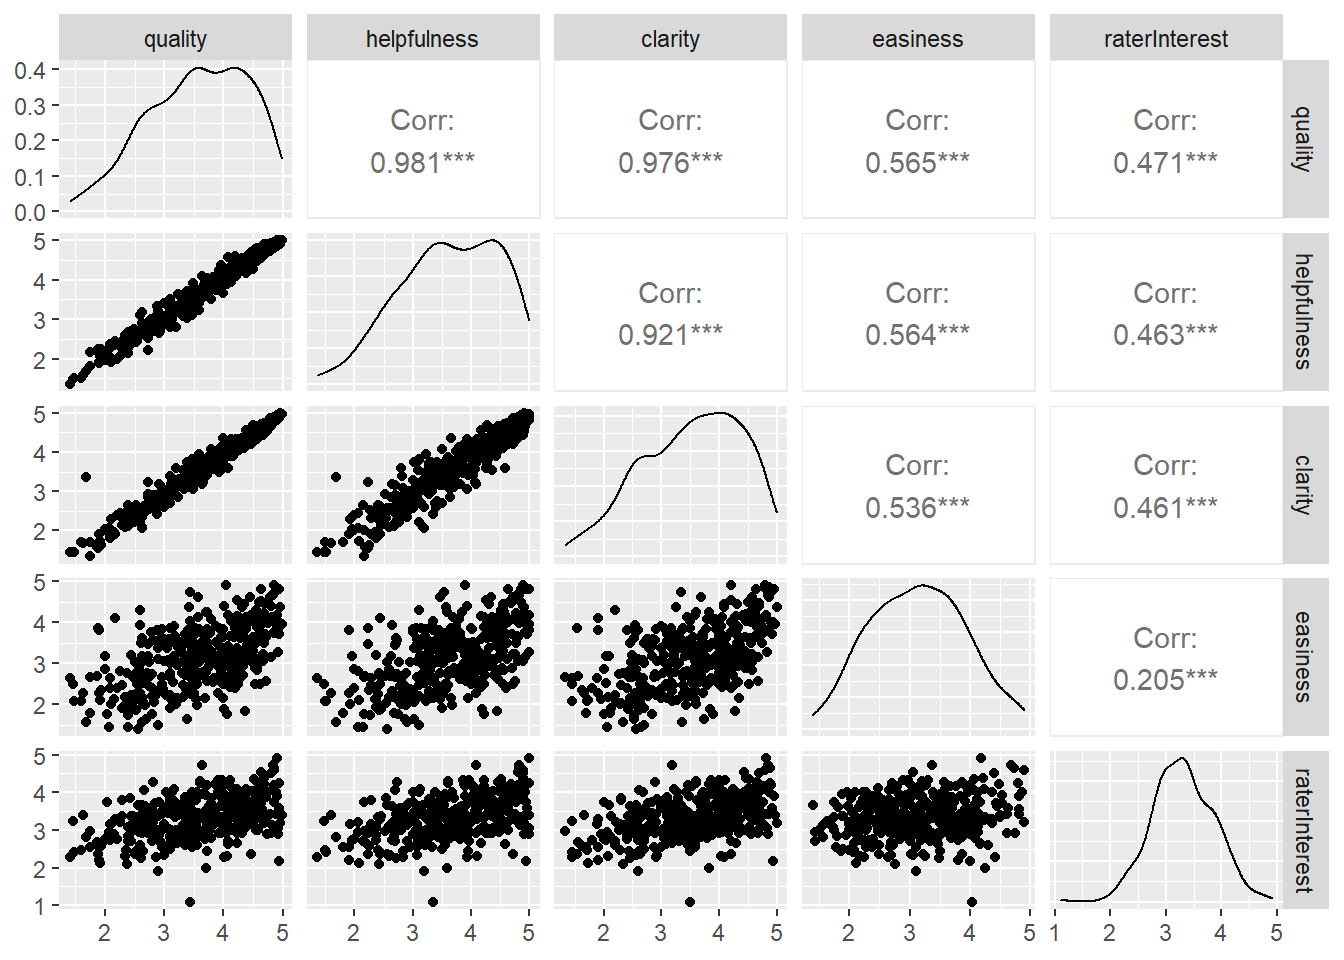
Using ggpairs of the GGally package, we can see the variables that correlate the highest with quality are helpfulness and clarity. Clarity and helpfulness have the third highest correlation with each other. If we were attempting to predict the quality rating of a course, we would strongly consider both clarity and helpfulness ratings.
Call:
lm(formula = pi_num ~ re_no, data = student.survey)

Residuals:
    Min      1Q  Median      3Q     Max
-2.8889 -0.5172 -0.2667  1.2040  2.7333

Coefficients:
                  Estimate Std. Error t value Pr(>|t|)
(Intercept)         2.2667     0.3394   6.678 1.18e-08 ***
re_nooccasionally   0.2506     0.4181   0.599 0.551374
re_nomost weeks     2.1619     0.6017   3.593 0.000691 ***
re_noevery week     2.6222     0.5543   4.731 1.56e-05 ***
---
Signif. codes:  0 '***' 0.001 '**' 0.01 '*' 0.05 '.' 0.1 ' ' 1

Residual standard error: 1.315 on 56 degrees of freedom
Multiple R-squared:  0.3872,    Adjusted R-squared:  0.3544
F-statistic:  11.8 on 3 and 56 DF,  p-value: 4.282e-06
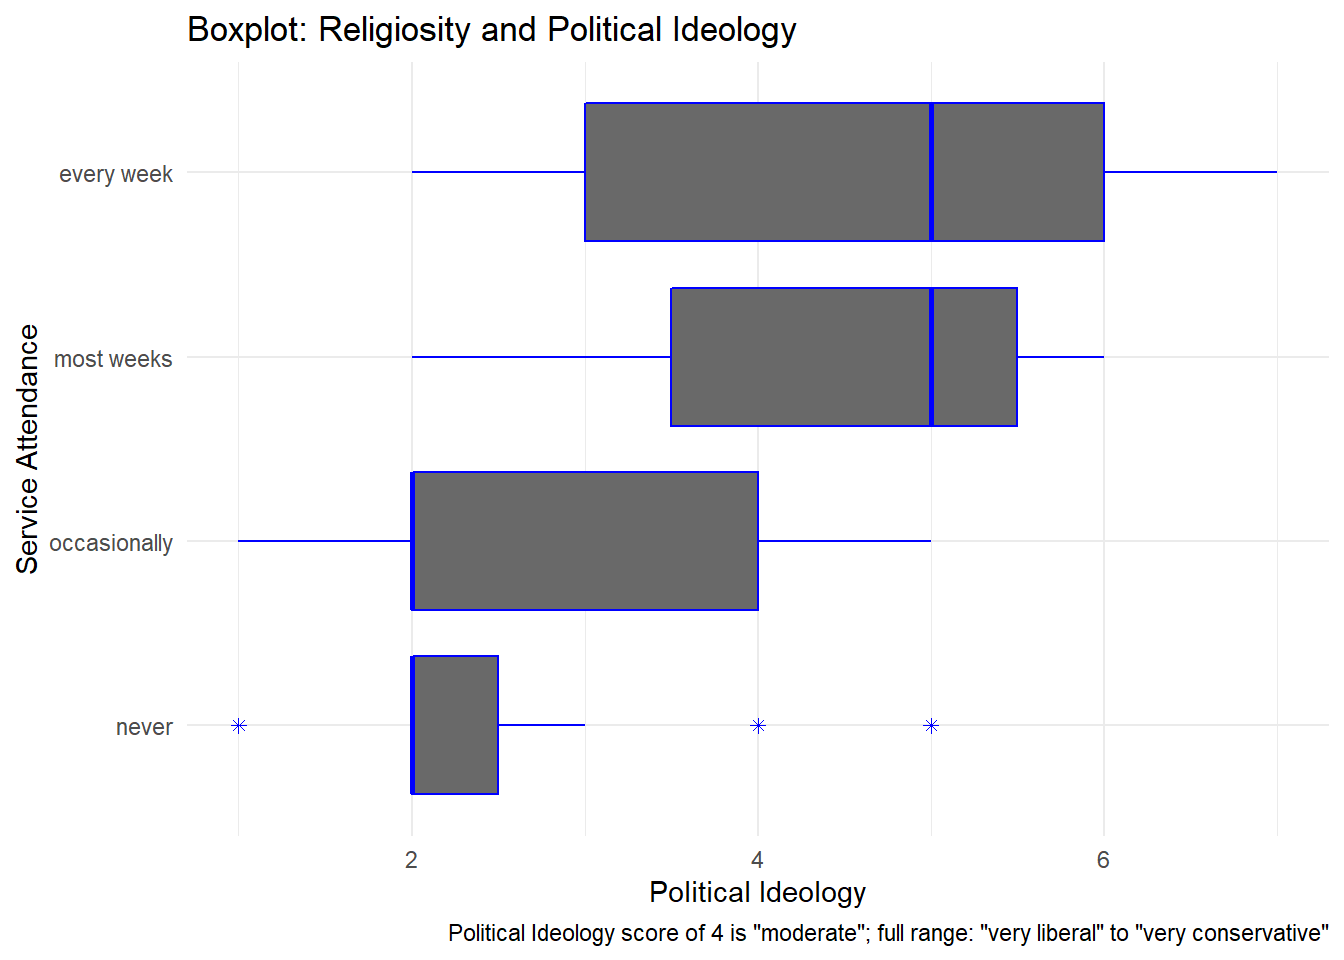
First using a box plot to visualize the relationship between a numeric and a nominal variable, it’s clear the distributions of those that attend church more frequently skew towards conservative values on the 7-point scale provided by the data. This is confirmed by inspecting the summary of the linear regression model relating Political Ideology to Religiosity. Both group means’ coefficients (scores) for those attending church “most weeks” and “weekly” are approximately 2 times greater that the intercept value that respresents those that attend “never”.
Call:
lm(formula = hi ~ tv, data = student.survey)

Residuals:
    Min      1Q  Median      3Q     Max
-1.2583 -0.2456  0.0417  0.3368  0.7051

Coefficients:
             Estimate Std. Error t value Pr(>|t|)
(Intercept)  3.441353   0.085345  40.323   <2e-16 ***
tv          -0.018305   0.008658  -2.114   0.0388 *
---
Signif. codes:  0 '***' 0.001 '**' 0.01 '*' 0.05 '.' 0.1 ' ' 1

Residual standard error: 0.4467 on 58 degrees of freedom
Multiple R-squared:  0.07156,   Adjusted R-squared:  0.05555
F-statistic: 4.471 on 1 and 58 DF,  p-value: 0.03879
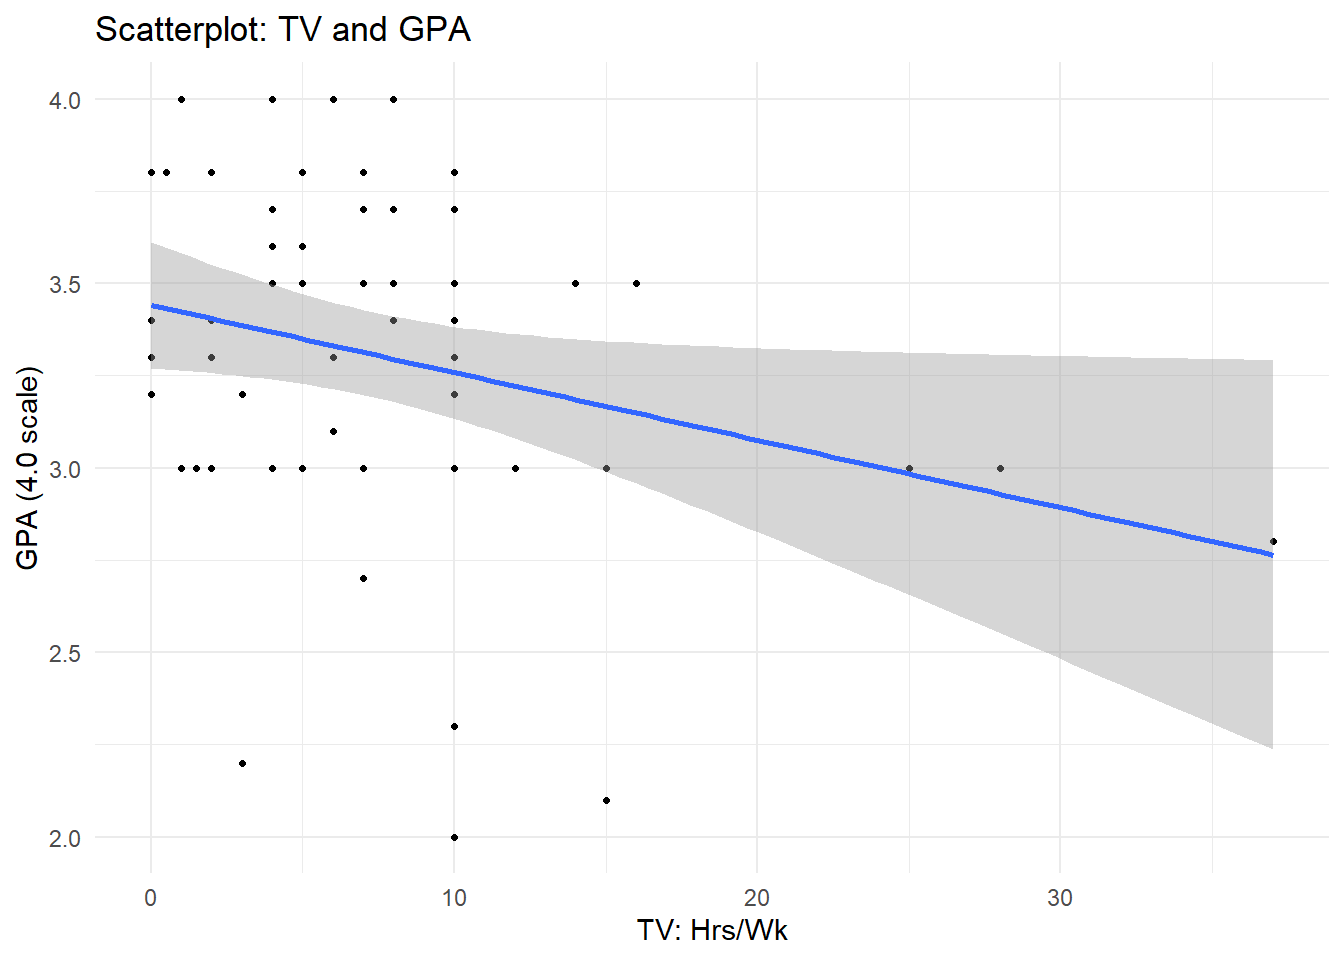
Observing the results of the linear regression model relating high-school GPA to hours spent watching TV, we see that for every one hour increase in hours of TV/wk, our model predicts high-school GPA to decrease by 0.018305 points. We see the weak negative linear relationship using both geom_point and geom_smooth to depict the regression line and the original data points.
---
title: "HW 3 Solution"
author: "Dane Shelton"
desription: "Linear Regression"
date: "08/02/2022"
format:
  html:
    df-print: paged
    callout-appearance: simple
    callout-icon: false
    toc: true
    code-fold: true
    code-copy: true
    code-tools: true
categories:
  - hw3
  - shelton
  - ggplot2
---

```{r}
#| label: setup
#| warning: false

library(tidyverse)
library(ggplot2)
library(alr4)
library(smss)
library(GGally)

knitr::opts_chunk$set(echo = FALSE, warning=FALSE, message = FALSE)
```

## Homework 3

::: panel-tabset
## Q1

We are using `UN11` data:

::: {.callout-note collapse="\"true'"}
## UN11

```{r}
#| label: load-in UN11
#| output: true

data("UN11")

head(UN11, n=5)
```
:::

::: callout-note
## 1.1.1

**Predictor/Explanatory/IV -** `ppgdp` Per Person GDP

**Response/DV -** `fertility` Fertility Rate per 1000
:::

::: {.callout-note collapse="true"}
## 1.1.2

```{r}
#| label: scatter fertility x gdp
#| output: true

scatter <- UN11 %>% ggplot(aes(x=ppgdp, y=fertility))+
              geom_point(shape=20)+
                geom_smooth(method='lm', se=TRUE)+
                scale_y_continuous(breaks=seq(1,6,by=1))+
                  scale_x_continuous(breaks=seq(0,100000,by=25000))+
                    coord_cartesian(ylim=c(0,7))
                theme_minimal()+
                  labs(title='Fertility Rate x ppGDP', x = 'Per Person GDP (USD)', y='Fertility   Rate per 1000', caption='Fig 1.1.2')

scatter
```

No, our scatter plot appears to have a negative exponential relationship; as `ppgdp` increase, `fertility` decreases at a nonlinear rate.

**NOTE:** If anyone knows why it is printing the above output as well as the graph please send a comment on Google Classroom or Piazza!
:::

::: {.callout-note collapse="true"}
## 1.1.3

```{r}
#| label: scatter log(fertility) x log(gdp)
#| output: true

scatter_log <- UN11 %>%
                  mutate(ppgdp=log(ppgdp), fertility=log(fertility))%>%
                    ggplot(aes(x=ppgdp, y=fertility))+
                      geom_point(shape=20)+
                         geom_smooth(method='lm', se=TRUE)+
                                 theme_minimal()+
                                   labs(title='Log Fertility Rate x Log ppGDP', x = 'Log Per Person GDP (USD)', y='Fertility   Rate per 1000', caption='Fig 1.1.3')

scatter_log
```

Now, after using a log transformation on both x and y, our scatter plot appears to have a negative linear relationship; as `ppgdp` increase, `fertility` decreases at a linear rate. This transformation makes these variabels appropriate for linear regression.
:::

## Q2

::: callout-note
## USD to GBP

**a)** The slope of the regression line will be divided by 1.33 to represent the adjustment to GBP. $1 USD * (1 GBP/1.33 USD)$ leaves us with just GBP. The slope is reduced by approximately 25 percent.

**b)** The correlation between the explanatory variable and the response will not change.
:::

## Q3

::: {.callout-note collapse="true"}
## `Water` Scatterplot Matrix

```{r}
#| label: Q3
#| output: true

water <- alr4::water

head(water, n=5)

pairs(water)
```
:::

The rightmost column uses `BSAAM` as a response variable to the preciptation values at the various sites over the years 1948-1990. Inspecting the plots on this column closer, we can see that `BSAAM` has a strong positive correlation with `OPSLAKE`, `OPRC`, and `OBPBC`. There is a much weaker positive relationship between `BSAAM` and `APSLAKE`, `APSAB`, and `APSMAM`. If we were attempting to predict stream runoff volume, it would be best to observe and use the values of `OPSLAKE`, `OPRC`, and `OBPBC` to create our model. These locations' precipitation values are highly correlated with stream runoff volume each year.

## Q4

::: {.callout-note collapse="true"}
## Scatterplot Matrix `Rateprof`

```{r}
#| label: q4
#| output: true

prof <- alr4::Rateprof

head(prof)
prof %>% GGally::ggpairs(columns = 8:12)

```
:::

Using `ggpairs` of the `GGally` package, we can see the variables that correlate the highest with `quality` are `helpfulness` and `clarity`. `Clarity` and `helpfulness` have the third highest correlation with each other. If we were attempting to predict the `quality` rating of a course, we would strongly consider both `clarity` and `helpfulness` ratings.

## Q5

```{r}
#| label: q5
#| output: true

data("student.survey")

# 5i
# Cannot run lm() with categorical response & ordered expl
pi_num <- as.numeric(student.survey$pi)
re_no <- factor(student.survey$re, ordered=F)

no_pi_ren <-  lm(data=student.survey, pi_num ~ re_no)


# 5ii
gpa_tv <- lm(data=student.survey, hi~tv)
```

::: {.callout-note collapse="true"}
## Political Ideology x Religiosity

```{r}
#| label: q5 pi_re
#| output: true
box_pire <- student.survey%>% ggplot(aes(x=pi_num, y=re_no))+
              geom_boxplot(fill='dimgrey', color='blue', outlier.shape = 8)+
                theme_minimal()+
                  labs(title = 'Boxplot: Religiosity and Political Ideology', x='Political Ideology', y='Service Attendance', caption='Political Ideology score of 4 is "moderate"; full range: "very liberal" to "very conservative"')

box_pire

summary(no_pi_ren)
```

First using a box plot to visualize the relationship between a numeric and a nominal variable, it's clear the distributions of those that attend church more frequently skew towards conservative values on the 7-point scale provided by the data. This is confirmed by inspecting the summary of the linear regression model relating Political Ideology to Religiosity. Both group means' coefficients (scores) for those attending church "most weeks" and "weekly" are approximately 2 times greater that the intercept value that respresents those that attend "never".
:::

::: {.callout-note collapse="true"}
## High School GPA x TV

```{r}
#| label: q5 gpa_tv
#| output: true
scatter_gpatv <- student.survey%>% ggplot(aes(x=tv, y=hi))+
              geom_point(shape=20)+
                geom_smooth(method='lm',se=TRUE)+
                    theme_minimal()+
                  labs(title = 'Scatterplot: TV and GPA', x='TV: Hrs/Wk', y='GPA (4.0 scale)')

scatter_gpatv

summary(gpa_tv)

```

Observing the results of the linear regression model relating high-school GPA to hours spent watching TV, we see that for every one hour increase in hours of TV/wk, our model predicts high-school GPA to decrease by 0.018305 points. We see the weak negative linear relationship using both `geom_point` and `geom_smooth` to depict the regression line and the original data points.
:::
:::