This is an R Markdown document. Markdown is a simple formatting syntax for authoring HTML, PDF, and MS Word documents. For more details on using R Markdown see http://rmarkdown.rstudio.com.
When you click the Knit button a document will be generated that includes both content as well as the output of any embedded R code chunks within the document. You can embed an R code chunk like this:
abc_poll <-read_csv("_data/abc_poll_2021.csv")
Rows: 527 Columns: 31
── Column specification ────────────────────────────────────────────────────────
Delimiter: ","
chr (28): xspanish, complete_status, ppeduc5, ppeducat, ppgender, ppethm, pp...
dbl  (3): id, ppage, weights_pid

ℹ Use `spec()` to retrieve the full column specification for this data.
ℹ Specify the column types or set `show_col_types = FALSE` to quiet this message.
Brief Description of data
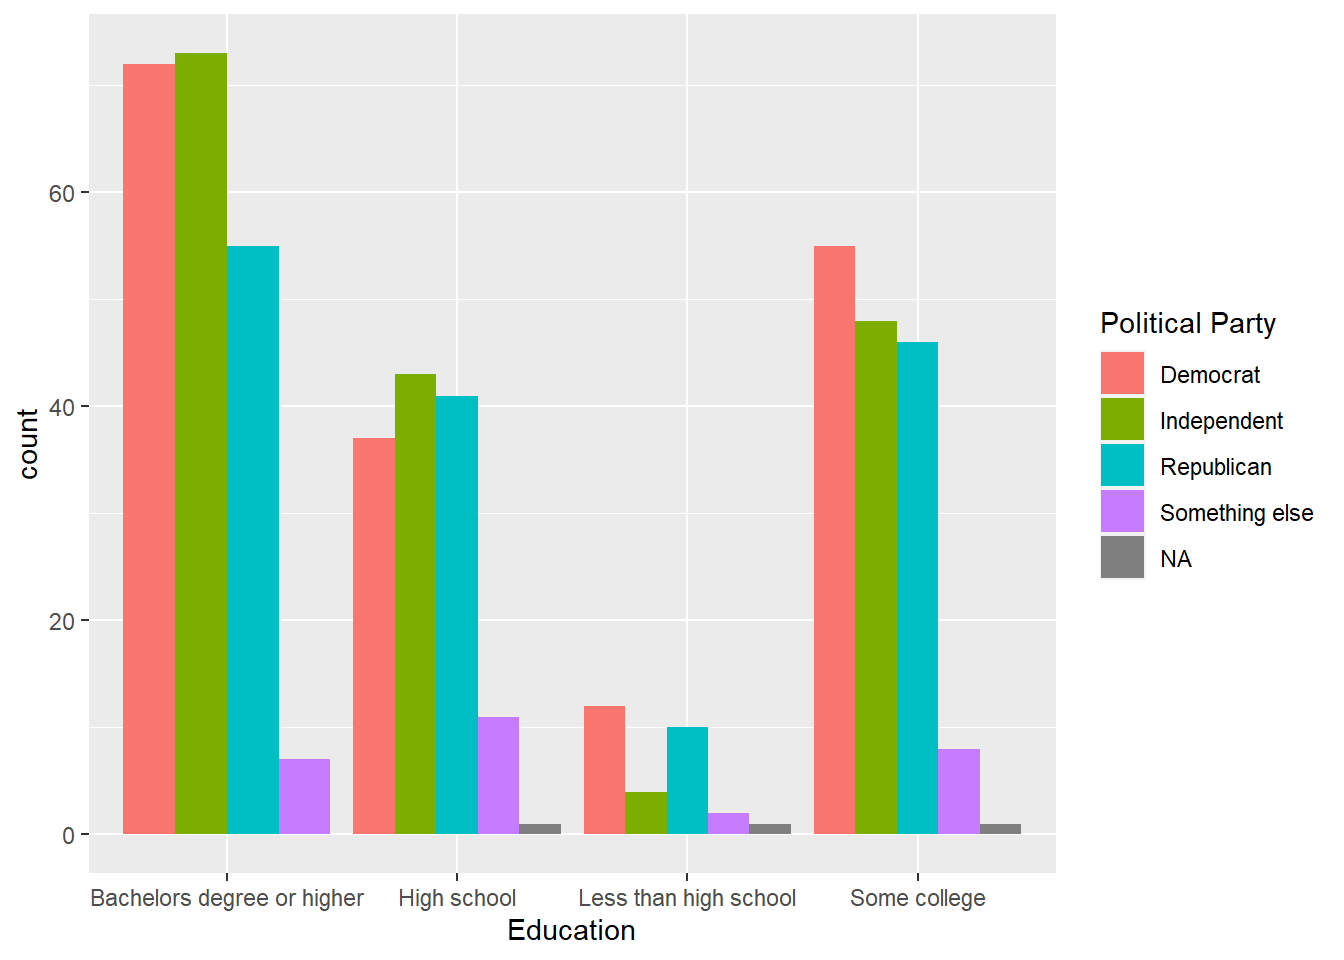
The variable $ppeducat looks at Education level of Survery Respondents and QPID looks at political party afflication. I need to clean the Data first and remove all skipped responses.
You can also embed plots, for example:
table(abc_poll$ppeducat,abc_poll$QPID)
                             A Democrat A Republican An Independent Skipped
  Bachelors degree or higher         72           55             73       0
  High school                        37           41             43       1
  Less than high school              12           10              4       1
  Some college                       55           46             48       1

                             Something else
  Bachelors degree or higher              7
  High school                            11
  Less than high school                   2
  Some college                            8
Removing all Skipped Responses and removed the word An.