------------------------------------------------------------------------------
You have loaded plyr after dplyr - this is likely to cause problems.
If you need functions from both plyr and dplyr, please load plyr first, then dplyr:
library(plyr); library(dplyr)
------------------------------------------------------------------------------

Attaching package: 'plyr'

The following object is masked from 'package:purrr':

    compact

The following objects are masked from 'package:dplyr':

    arrange, count, desc, failwith, id, mutate, rename, summarise,
    summarize
library(tidyr)library(scales)
Attaching package: 'scales'

The following object is masked from 'package:purrr':

    discard

The following object is masked from 'package:readr':

    col_factor
library(poliscidata)
Registered S3 method overwritten by 'gdata':
  method         from
  reorder.factor gplots

Attaching package: 'poliscidata'

The following object is masked from 'package:plyr':

    ddply
Introduction
I will be using the poliscidata package in R, and I will then use the ‘world’ data set. It’s relatively large so I will not describe in depth, but it has a difference in statistics and information in almost every country. Some of these variables include “confidence in government institutions” (designated confidence interval), “ethnic and linguistic factionalization” (frac_eth3), and “is this state’s government a democracy?” (democ_regime08).
Based on my undergrad thesis, which focused on ethno-religious violence in the Polish-Ukrainian borderlands, I’m going to focus on the following variables:
country,
regionun (UN region)
frac_eth3 (level of ethnic factionalization)
durable (# of years since last regime transition)
dem_level14 (regime type)
dem_score14 (democracy score, Economist 2014)
pr_sys (proportional representation in government, yes or no)
Some of the commonalities I found between incidents of ethno-religious violence in an ethnic borderland are as follows: (a) history of political suppression against one of the two dominant ethnicities/religions in the area, (b) each group has intense feelings of “rivalry,” jealousy, and resentment against the other, (c) although language and culture in ethnic borderlands can be similar (such as with Poles and Ukrainians), their social, religious, and political traditions/aspirations are more often than not incredibly different, (d) the victorious group restarts the cycle and enacts harsh and repressive policies against the loser. And in situations where groups need to compete for survival (such as in times of war or general political instability), these trends combine and result in the eruption of violence.
NOTE: If I had more time, I would love to transform this into a larger project in which I would use the info gathered here and see if ethno-religious violence actually erupted in the places that match my criteria on paper.
In the interest of time, I’m not going to go through all 167 countries included in this data set and randomly pick locations. In this case, I have chosen Asia, which in this data set, includes the Middle East, Central Asia (former Soviet states), the Caucasus, and Eastern/Southern Asia. Since there were quite a few ‘NA’ entries, I removed them.
data("gss")eth_rel_components <- world %>%select(country,regionun,frac_eth3,durable,dem_level4,dem_score14,pr_sys) %>%na.omit() %>%filter(regionun =="Asia") %>%print()
        country regionun frac_eth3 durable    dem_level4 dem_score14 pr_sys
1   Afghanistan     Asia      High       4 Authoritarian        2.77     No
2       Armenia     Asia       Low       2        Hybrid        4.13     No
3    Azerbaijan     Asia       Low       5 Authoritarian        2.83     No
4       Bahrain     Asia    Medium      25 Authoritarian        2.87     No
5    Bangladesh     Asia       Low       9        Hybrid        5.78     No
6        Bhutan     Asia      High      93        Hybrid        4.87     No
7      Cambodia     Asia       Low       2        Hybrid        4.78    Yes
8         China     Asia       Low      51 Authoritarian        3.00     No
9        Cyprus     Asia       Low      26    Part Democ        7.40    Yes
10      Georgia     Asia    Medium       0        Hybrid        5.82     No
11        India     Asia    Medium      50    Part Democ        7.92     No
12    Indonesia     Asia      High       1    Part Democ        6.95    Yes
13         Iran     Asia      High       3 Authoritarian        1.98     No
14         Iraq     Asia    Medium      76        Hybrid        4.23    Yes
15       Israel     Asia    Medium      52    Part Democ        7.63    Yes
16        Japan     Asia       Low      48    Full Democ        8.08     No
17       Jordan     Asia    Medium      11 Authoritarian        3.76     No
18   Kazakhstan     Asia      High       9 Authoritarian        3.17     No
19       Kuwait     Asia      High       8 Authoritarian        3.78     No
20   Kyrgyzstan     Asia      High       9        Hybrid        5.24     No
21         Laos     Asia    Medium      25 Authoritarian        2.21     No
22      Lebanon     Asia       Low       0        Hybrid        5.12     No
23     Malaysia     Asia      High      29    Part Democ        6.49     No
24     Mongolia     Asia    Medium       8    Part Democ        6.62     No
25        Nepal     Asia      High      10        Hybrid        4.77     No
26         Oman     Asia    Medium      43 Authoritarian        3.15     No
27     Pakistan     Asia      High       1        Hybrid        4.64     No
28  Philippines     Asia       Low      13    Part Democ        6.77     No
29        Qatar     Asia      High      29 Authoritarian        3.18     No
30 Saudi Arabia     Asia       Low      74 Authoritarian        1.82     No
31    Singapore     Asia    Medium      35    Part Democ        6.03     No
32    Sri Lanka     Asia    Medium      52        Hybrid        5.69    Yes
33        Syria     Asia    Medium      37 Authoritarian        1.74     No
34       Taiwan     Asia    Medium       8    Part Democ        7.65     No
35   Tajikistan     Asia    Medium       2 Authoritarian        2.37     No
36     Thailand     Asia      High       8        Hybrid        5.39     No
37       Turkey     Asia    Medium      17        Hybrid        5.12    Yes
38 Turkmenistan     Asia    Medium       9 Authoritarian        1.83     No
39   Uzbekistan     Asia    Medium       9 Authoritarian        2.45     No
40      Vietnam     Asia       Low      46 Authoritarian        3.41     No
Background Info and Data
Now I’m going to tidy the data in the following variables: frac_eth3 (level of ethnic factionalism), dem_score14 (democratic score via The Economist), and pr_sys (proportionally representative government). My goal is to narrow this information down so that I can see what countries fit the criteria I laid out in the intro: (1) High levels of ethnic factionalism/inter-ethnic competition and rivalry (2) Artificial democratic government or a hybrid/authoritarian regime (3) Relatively short time-span between regime changes (4) Whichever group is in power will ensure that the “rival” group does not have governmental representation according to their population numbers.
       country regionun frac_eth3 durable    dem_level4 dem_score14 pr_sys
1  Afghanistan     Asia      High       4 Authoritarian        2.77     No
2       Bhutan     Asia      High      93        Hybrid        4.87     No
3         Iran     Asia      High       3 Authoritarian        1.98     No
4   Kazakhstan     Asia      High       9 Authoritarian        3.17     No
5       Kuwait     Asia      High       8 Authoritarian        3.78     No
6   Kyrgyzstan     Asia      High       9        Hybrid        5.24     No
7     Malaysia     Asia      High      29    Part Democ        6.49     No
8        Nepal     Asia      High      10        Hybrid        4.77     No
9     Pakistan     Asia      High       1        Hybrid        4.64     No
10       Qatar     Asia      High      29 Authoritarian        3.18     No
11    Thailand     Asia      High       8        Hybrid        5.39     No
Now that the data set has been filtered down by design, I’m going to present some visuals to showcase different variables (both individual and in combination).
Visuals and Explanation
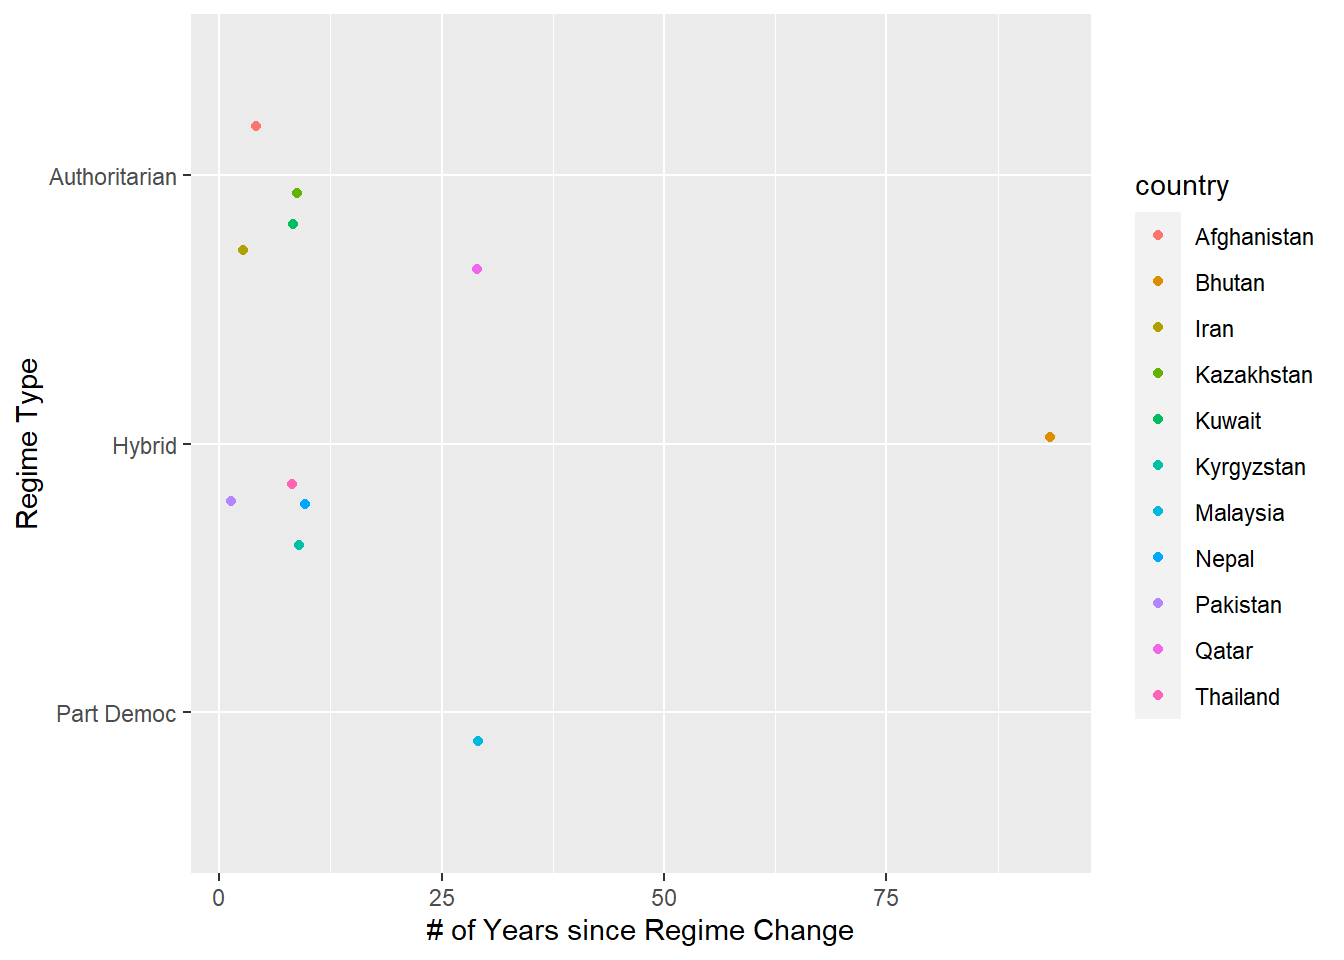
ggplot(eth_rel_components, aes(x=durable, y=dem_level4, color=country)) +geom_jitter() +xlab("# of Years since Regime Change") +ylab("Regime Type") %>%print()
$y
[1] "Regime Type"

attr(,"class")
[1] "labels"
Based on the information presented in this graph, it’s noteworthy that all except for 3 countries (Qatar, Malaysia, and Bhutan) have experienced a regime change in the past 10 years. Most of these countries (including Qatar, but excluding Kyrgyzstan, Thailand, Malaysia, and Bhutan) have authoritarian regimes. The only country that’s close to democracy is Malaysia and it’s a decent bit above “Part Democ” (Part Democracy). None of the countries included here - which have high ethnic factionalism, low democracy scores, and no proportional representation in government - are fully democratic. This graph, however, can be improved. I don’t think it needs the distinction of individual countries, and I think it’d be more succinct and clear if point color was determined by regime type instead.
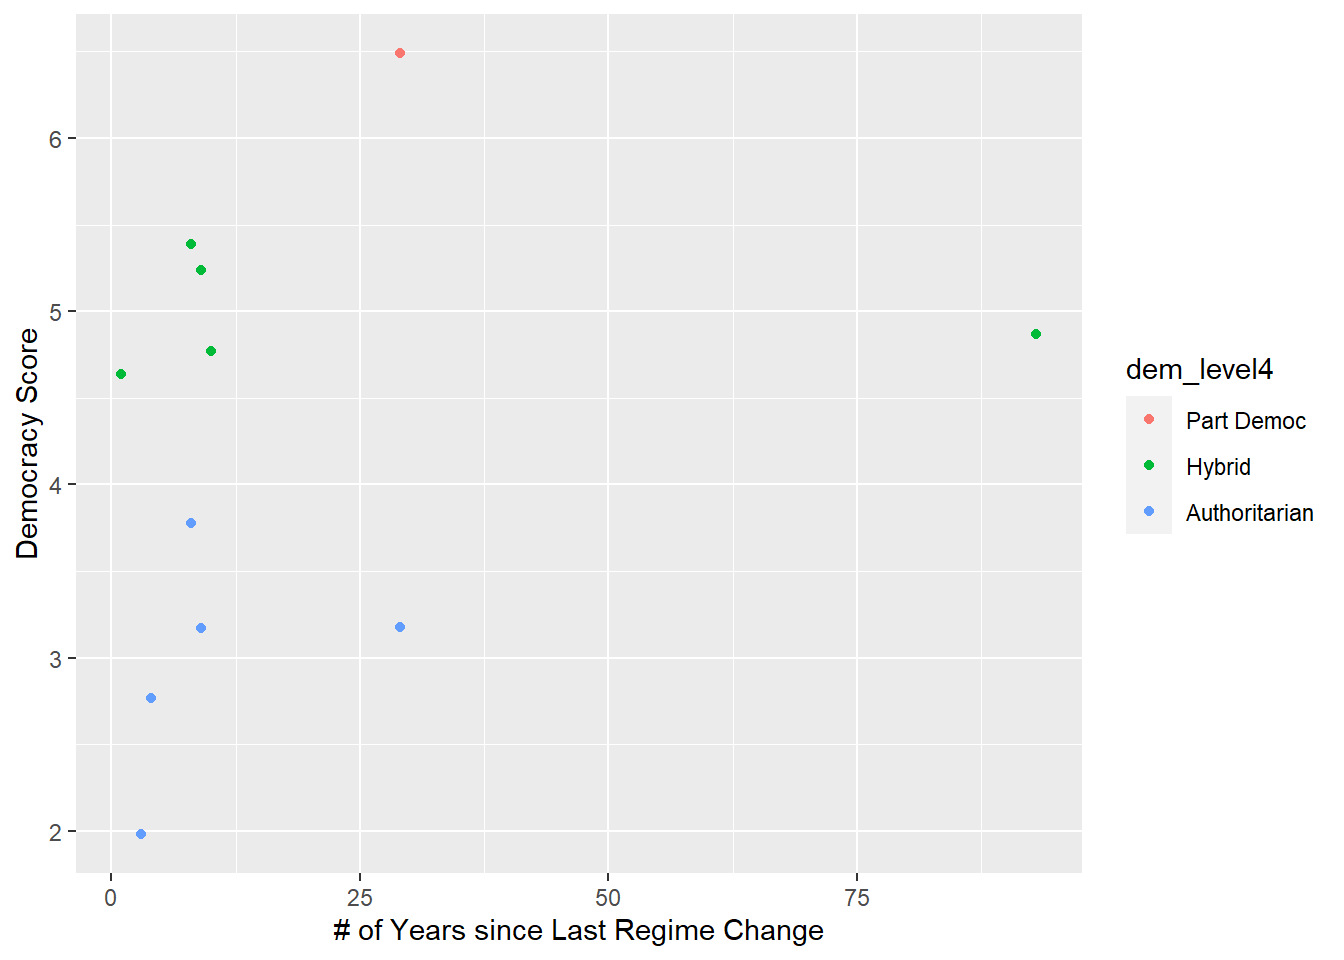
ggplot(eth_rel_components, aes(x=durable, y=dem_score14, color=dem_level4)) +geom_point() +xlab("# of Years since Last Regime Change") +ylab("Democracy Score") %>%print()
Unlike the previous visualization, this one has a much wider distribution. However, this graph shows democracy score based on regime type. While the democracy score might be accurate - though it’s hard to find each country’s exact democracy score with the graph in this format - I do not believe the alignment of countries based so strictly on regime type is helpful at all. I would even go so far as to say the format of the y-axis is misleading. There isn’t a set framework for how regimes govern. Authoritarianism, for instance, is very much a spectrum rather than a set value. For example, there are heavily authoritarian states like Belarus and Russia, but then there are authoritarian-leaning countries like Poland and Hungary. They can all be classified as “authoritarian”, but they’re not equally so.
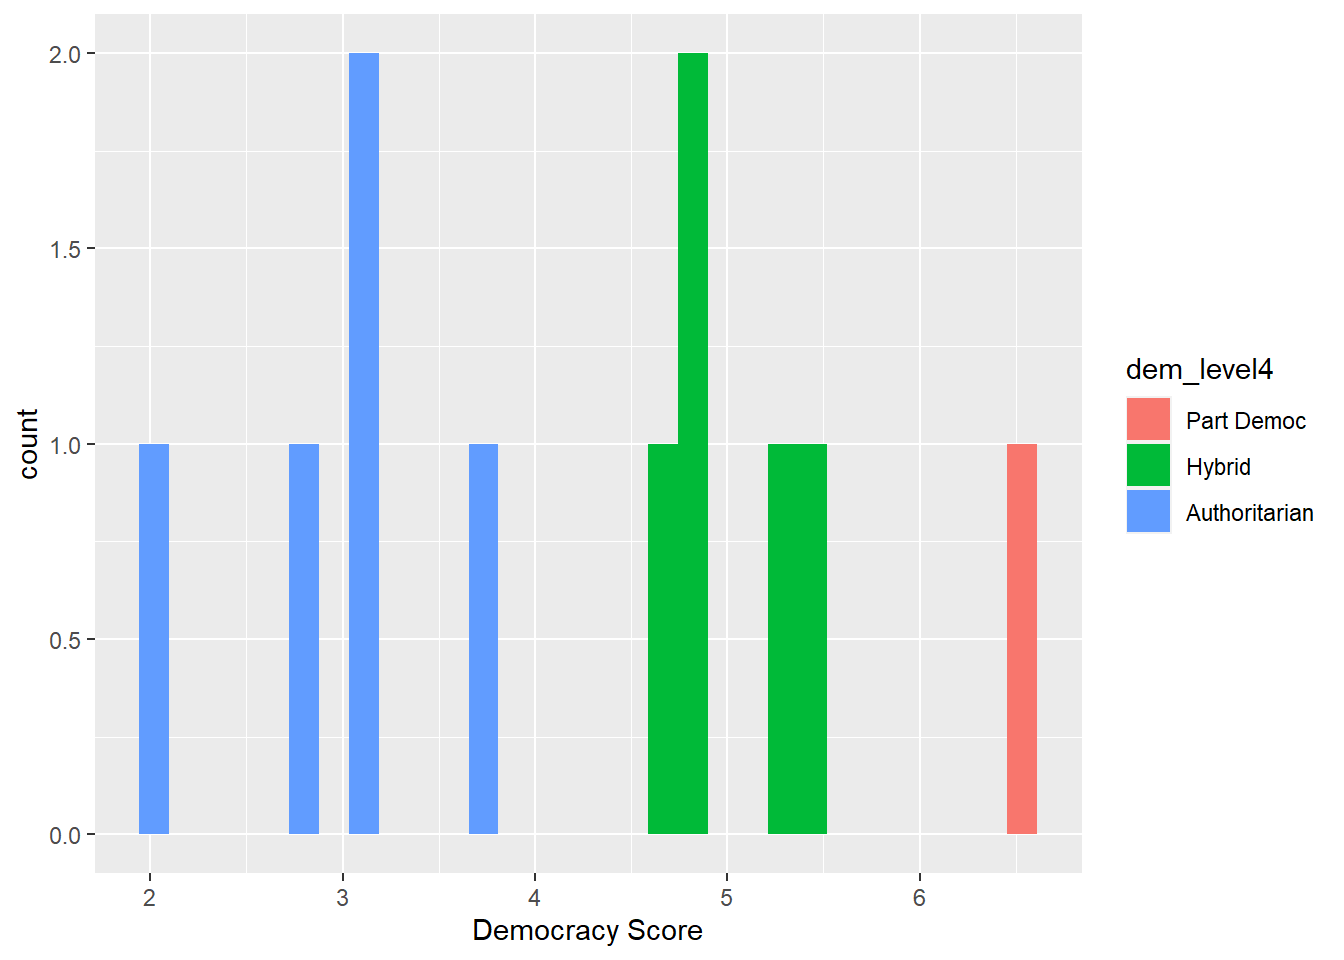
`stat_bin()` using `bins = 30`. Pick better value with `binwidth`.
This graph, admittedly, isn’t the best. I wanted each entry to have it’s own bar next to the previous, but it stacked the ones with the same democracy score on top of each other. It’s not the biggest deal since the y-axis is ‘count’ and that just represents the number of countries with a given democracy score rather than the score itself.
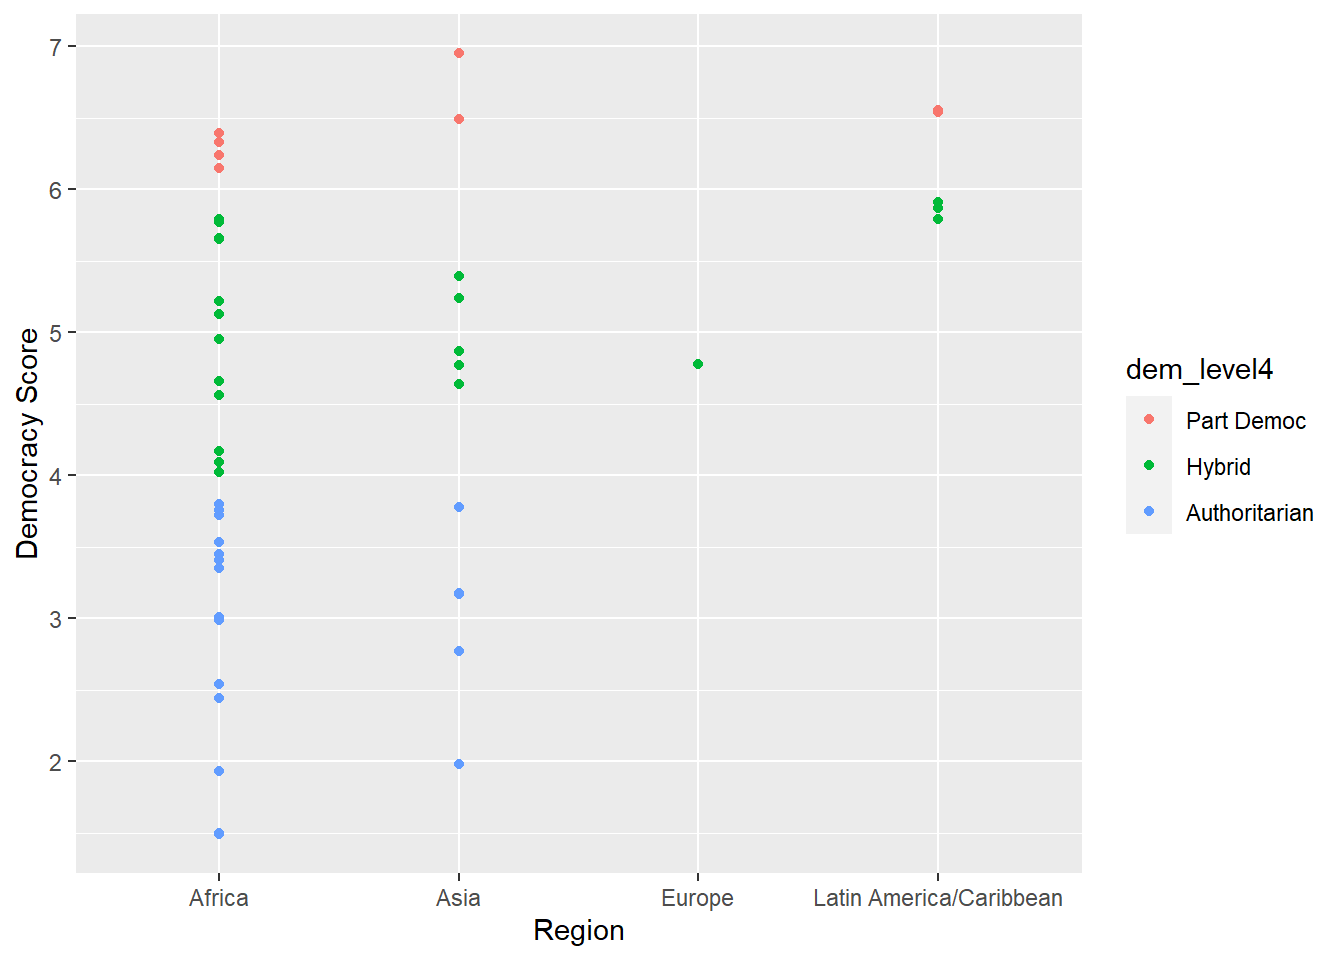
Just for comparison, I’m going to take out the geographic filter but keep the one where it filters out all entries with a ‘dem_score14’ value higher than 7 (the point at which regimes enter “democratic” territory).
eth_rel_general <- world %>%select(country,regionun,frac_eth3,durable,dem_level4,dem_score14,pr_sys) %>%na.omit() %>%filter(frac_eth3 =="High"& dem_score14 <7) %>%print()
                    country                regionun frac_eth3 durable
1               Afghanistan                    Asia      High       4
2                    Angola                  Africa      High       3
3                     Benin                  Africa      High       9
4                    Bhutan                    Asia      High      93
5                   Bolivia Latin America/Caribbean      High      18
6    Bosnia and Herzegovina                  Europe      High       0
7              Burkina Faso                  Africa      High      20
8                  Cameroon                  Africa      High       8
9  Central African Republic                  Africa      High       7
10                     Chad                  Africa      High       8
11                 Colombia Latin America/Caribbean      High      43
12            Cote d'Ivoire                  Africa      High       0
13                 Djibouti                  Africa      High       1
14                  Ecuador Latin America/Caribbean      High       0
15                  Eritrea                  Africa      High       7
16                 Ethiopia                  Africa      High       5
17                    Gabon                  Africa      High       9
18                    Ghana                  Africa      High       4
19                   Guinea                  Africa      High       5
20            Guinea-Bissau                  Africa      High       0
21                   Guyana Latin America/Caribbean      High       8
22                Indonesia                    Asia      High       1
23                     Iran                    Asia      High       3
24               Kazakhstan                    Asia      High       9
25                    Kenya                  Africa      High       3
26                   Kuwait                    Asia      High       8
27               Kyrgyzstan                    Asia      High       9
28                  Liberia                  Africa      High       3
29                    Libya                  Africa      High      49
30                   Malawi                  Africa      High       6
31                 Malaysia                    Asia      High      29
32                     Mali                  Africa      High       8
33               Mauritania                  Africa      High      38
34               Mozambique                  Africa      High       6
35                  Namibia                  Africa      High      10
36                    Nepal                    Asia      High      10
37                    Niger                  Africa      High       1
38                  Nigeria                  Africa      High       1
39                 Pakistan                    Asia      High       1
40                     Peru Latin America/Caribbean      High       0
41                    Qatar                    Asia      High      29
42                  Senegal                  Africa      High       0
43             Sierra Leone                  Africa      High       0
44                    Sudan                  Africa      High      11
45                 Tanzania                  Africa      High       0
46                 Thailand                    Asia      High       8
47                     Togo                  Africa      High       7
48                   Uganda                  Africa      High       7
49                   Zambia                  Africa      High       4
      dem_level4 dem_score14 pr_sys
1  Authoritarian        2.77     No
2  Authoritarian        3.35    Yes
3         Hybrid        5.65    Yes
4         Hybrid        4.87     No
5         Hybrid        5.79     No
6         Hybrid        4.78    Yes
7         Hybrid        4.09    Yes
8  Authoritarian        3.41     No
9  Authoritarian        1.49     No
10 Authoritarian        1.50     No
11    Part Democ        6.55    Yes
12 Authoritarian        3.53     No
13 Authoritarian        2.99     No
14        Hybrid        5.87    Yes
15 Authoritarian        2.44     No
16 Authoritarian        3.72     No
17 Authoritarian        3.76     No
18    Part Democ        6.33     No
19 Authoritarian        3.01     No
20 Authoritarian        1.93    Yes
21        Hybrid        5.91    Yes
22    Part Democ        6.95    Yes
23 Authoritarian        1.98     No
24 Authoritarian        3.17     No
25        Hybrid        5.13     No
26 Authoritarian        3.78     No
27        Hybrid        5.24     No
28        Hybrid        4.95     No
29 Authoritarian        3.80     No
30        Hybrid        5.66     No
31    Part Democ        6.49     No
32        Hybrid        5.79     No
33        Hybrid        4.17     No
34        Hybrid        4.66    Yes
35    Part Democ        6.24    Yes
36        Hybrid        4.77     No
37        Hybrid        4.02     No
38 Authoritarian        3.76     No
39        Hybrid        4.64     No
40    Part Democ        6.54    Yes
41 Authoritarian        3.18     No
42    Part Democ        6.15     No
43        Hybrid        4.56    Yes
44 Authoritarian        2.54     No
45        Hybrid        5.77     No
46        Hybrid        5.39     No
47 Authoritarian        3.45     No
48        Hybrid        5.22     No
49    Part Democ        6.39     No
I’m going to provide summary statistics for the original data set I used ‘eth_rel_components’, which is geographically specific to Asia (and has a filter to only include countries without proportional representation), and then the last one, ‘eth_rel_general’, which applies to all nations in all regions with proportional and non-proportional representation. Then I will discuss and compare them.
There is a sizable difference between the ‘durable_mean’ figures for ‘eth_rel_components’ and ‘eth_rel_general’; it’s a difference of 7.98516. However, the mean figures for ‘dem_score14_mean’ only have a 0.24436 difference. What does this mean? Well, for starters, it means that Asia in particular has longer lasting regimes/longer periods of time in between regime changes than the world overall. And the small difference between the mean figures for dem_score14 means that the global average democratic score is about the same as Asia specifically.
Furthermore, if you compare the minimum and maximum dem_score14 values for each data set, they only differ from each other by about 0.5.
min(eth_rel_general$dem_score14)
[1] 1.49
max(eth_rel_general$dem_score14)
[1] 6.95
min(eth_rel_components$durable)
[1] 1
max(eth_rel_components$durable)
[1] 93
The min and max values for ‘durable’, which kind of contradict the original mean calculations, are almost the exact same, except the min values are 1 off.
min(eth_rel_general$durable)
[1] 0
max(eth_rel_general$durable)
[1] 93
Conclusion
I started this project with the intention of measuring the criteria of ethno-religious violence that I picked up on while writing my thesis. I found the criteria and measured, but kind of as expected, I need more information to actually measure whether the countries that matched my criteria actually experience(d) eruptions of ethno-religious violence. I know certain countries in the data set have experienced ethnic/religious violence (Bangladesh, Bosnia, Cambodia, Kazakhstan, Uzbekistan, Ukraine, Vietnam) but this data set unfortunately doesn’t have a category for “experienced ethnic violence.” I would definitely be interested in pursuing this further and finding or making a dataset with the necessary information, I’m just not there yet skill-wise.
Bibliography
The Economist, The Intelligence Unit, “Democracy Index Report, 2014.” http://www.eiu.com/public/thankyou_download.aspx?activity=download&campaignid=Democracy0115