Code
library(tidyverse)
library(summarytools)

knitr::opts_chunk$set(echo = TRUE, warning=FALSE, message=FALSE)library(tidyverse)
library(summarytools)
knitr::opts_chunk$set(echo = TRUE, warning=FALSE, message=FALSE)Loaded the Fed Funds Dataset
library(readr)
fedfunds <- read_csv("_data/FedFundsRate.csv")
Add any comments or documentation as needed. More challenging data may require additional code chunks and documentation.
Doing a Head of the Dataset to get a view of what the Data Looks like.
head(fedfunds)# A tibble: 6 × 10
Year Month Day Federal Fu…¹ Feder…² Feder…³ Effec…⁴ Real …⁵ Unemp…⁶ Infla…⁷
<dbl> <dbl> <dbl> <dbl> <dbl> <dbl> <dbl> <dbl> <dbl> <dbl>
1 1954 7 1 NA NA NA 0.8 4.6 5.8 NA
2 1954 8 1 NA NA NA 1.22 NA 6 NA
3 1954 9 1 NA NA NA 1.06 NA 6.1 NA
4 1954 10 1 NA NA NA 0.85 8 5.7 NA
5 1954 11 1 NA NA NA 0.83 NA 5.3 NA
6 1954 12 1 NA NA NA 1.28 NA 5 NA
# … with abbreviated variable names ¹`Federal Funds Target Rate`,
# ²`Federal Funds Upper Target`, ³`Federal Funds Lower Target`,
# ⁴`Effective Federal Funds Rate`, ⁵`Real GDP (Percent Change)`,
# ⁶`Unemployment Rate`, ⁷`Inflation Rate`Getting the column names
colnames(fedfunds) [1] "Year" "Month"
[3] "Day" "Federal Funds Target Rate"
[5] "Federal Funds Upper Target" "Federal Funds Lower Target"
[7] "Effective Federal Funds Rate" "Real GDP (Percent Change)"
[9] "Unemployment Rate" "Inflation Rate" Renaming columns as I had difficulty invoking the column name in code.
names(fedfunds)[names(fedfunds) == "Real GDP (Percent Change)"] <- "Real GDP"
colnames(fedfunds)
[1] "Year" "Month"
[3] "Day" "Federal Funds Target Rate"
[5] "Federal Funds Upper Target" "Federal Funds Lower Target"
[7] "Effective Federal Funds Rate" "Real GDP"
[9] "Unemployment Rate" "Inflation Rate" Summary of the Datset and found a lot of NAs to clean up.
summary(fedfunds) Year Month Day Federal Funds Target Rate
Min. :1954 Min. : 1.000 Min. : 1.000 Min. : 1.000
1st Qu.:1973 1st Qu.: 4.000 1st Qu.: 1.000 1st Qu.: 3.750
Median :1988 Median : 7.000 Median : 1.000 Median : 5.500
Mean :1987 Mean : 6.598 Mean : 3.598 Mean : 5.658
3rd Qu.:2001 3rd Qu.:10.000 3rd Qu.: 1.000 3rd Qu.: 7.750
Max. :2017 Max. :12.000 Max. :31.000 Max. :11.500
NA's :442
Federal Funds Upper Target Federal Funds Lower Target
Min. :0.2500 Min. :0.0000
1st Qu.:0.2500 1st Qu.:0.0000
Median :0.2500 Median :0.0000
Mean :0.3083 Mean :0.0583
3rd Qu.:0.2500 3rd Qu.:0.0000
Max. :1.0000 Max. :0.7500
NA's :801 NA's :801
Effective Federal Funds Rate Real GDP Unemployment Rate
Min. : 0.070 Min. :-10.000 Min. : 3.400
1st Qu.: 2.428 1st Qu.: 1.400 1st Qu.: 4.900
Median : 4.700 Median : 3.100 Median : 5.700
Mean : 4.911 Mean : 3.138 Mean : 5.979
3rd Qu.: 6.580 3rd Qu.: 4.875 3rd Qu.: 7.000
Max. :19.100 Max. : 16.500 Max. :10.800
NA's :152 NA's :654 NA's :152
Inflation Rate
Min. : 0.600
1st Qu.: 2.000
Median : 2.800
Mean : 3.733
3rd Qu.: 4.700
Max. :13.600
NA's :194 Dropping all NAs
year_metrics <- fedfunds %>%
  drop_na(Year,`Real GDP`,`Inflation Rate`,`Unemployment Rate`,`Effective Federal Funds Rate`)
year_metrics
# A tibble: 236 × 10
Year Month Day Federal F…¹ Feder…² Feder…³ Effec…⁴ Real …⁵ Unemp…⁶ Infla…⁷
<dbl> <dbl> <dbl> <dbl> <dbl> <dbl> <dbl> <dbl> <dbl> <dbl>
1 1958 1 1 NA NA NA 2.72 -10 5.8 3.2
2 1958 4 1 NA NA NA 1.26 2.6 7.4 2.4
3 1958 7 1 NA NA NA 0.68 9.6 7.5 2.4
4 1958 10 1 NA NA NA 1.8 9.7 6.7 1.7
5 1959 1 1 NA NA NA 2.48 7.7 6 1.7
6 1959 4 1 NA NA NA 2.96 10.1 5.2 1.7
7 1959 7 1 NA NA NA 3.47 -0.8 5.1 2
8 1959 10 1 NA NA NA 3.98 1.6 5.7 2.7
9 1960 1 1 NA NA NA 3.99 9.2 5.2 2
10 1960 4 1 NA NA NA 3.92 -1.5 5.2 2
# … with 226 more rows, and abbreviated variable names
# ¹`Federal Funds Target Rate`, ²`Federal Funds Upper Target`,
# ³`Federal Funds Lower Target`, ⁴`Effective Federal Funds Rate`,
# ⁵`Real GDP`, ⁶`Unemployment Rate`, ⁷`Inflation Rate`
# ℹ Use `print(n = ...)` to see more rowssummary(year_metrics) Year Month Day Federal Funds Target Rate
Min. :1958 Min. : 1.00 Min. :1 Min. : 1.000
1st Qu.:1972 1st Qu.: 3.25 1st Qu.:1 1st Qu.: 3.750
Median :1987 Median : 5.50 Median :1 Median : 5.250
Mean :1987 Mean : 5.50 Mean :1 Mean : 5.407
3rd Qu.:2002 3rd Qu.: 7.75 3rd Qu.:1 3rd Qu.: 7.000
Max. :2016 Max. :10.00 Max. :1 Max. :11.000
NA's :131
Federal Funds Upper Target Federal Funds Lower Target
Min. :0.2500 Min. :0.00000
1st Qu.:0.2500 1st Qu.:0.00000
Median :0.2500 Median :0.00000
Mean :0.2812 Mean :0.03125
3rd Qu.:0.2500 3rd Qu.:0.00000
Max. :0.5000 Max. :0.25000
NA's :204 NA's :204
Effective Federal Funds Rate Real GDP Unemployment Rate
Min. : 0.070 Min. :-10.000 Min. : 3.400
1st Qu.: 2.655 1st Qu.: 1.400 1st Qu.: 5.000
Median : 4.845 Median : 3.100 Median : 5.700
Mean : 5.084 Mean : 3.116 Mean : 6.074
3rd Qu.: 6.875 3rd Qu.: 4.800 3rd Qu.: 7.100
Max. :19.080 Max. : 16.500 Max. :10.400
Inflation Rate
Min. : 0.600
1st Qu.: 2.000
Median : 2.800
Mean : 3.740
3rd Qu.: 4.725
Max. :13.000
I tried to use a line graph but it looks messy.
library(ggplot2)
ggplot(data=year_metrics, aes(x=`Year`, y=`Real GDP`))+
  geom_line()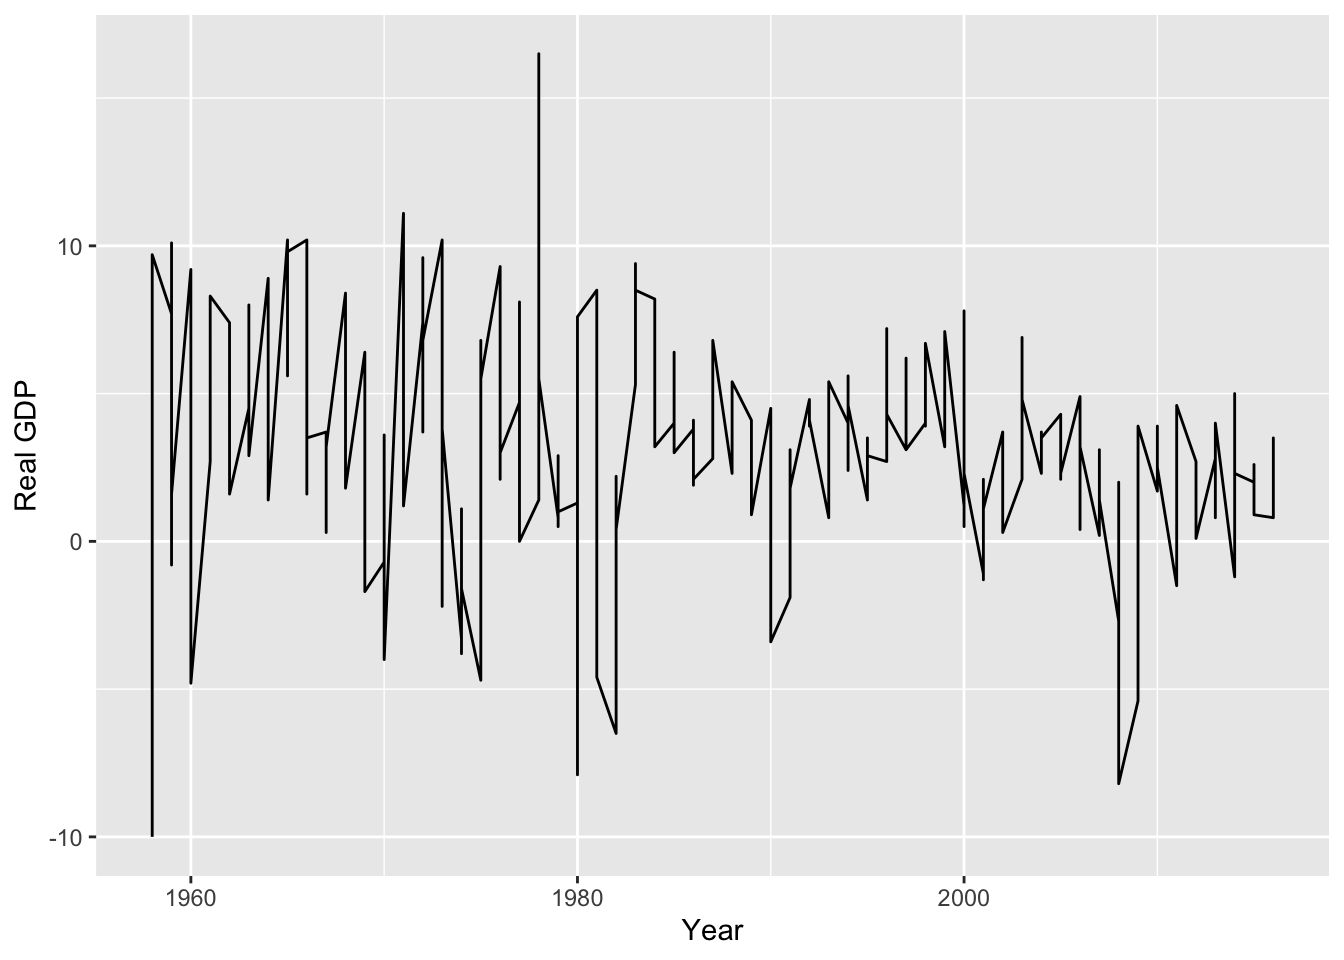
This Bar Graph came out much cleaner looking.
perctgdp<-ggplot(year_metrics, aes(x =`Year`, y =`Real GDP`,fill=`Real GDP`)) + geom_bar(stat = "identity")
perctgdp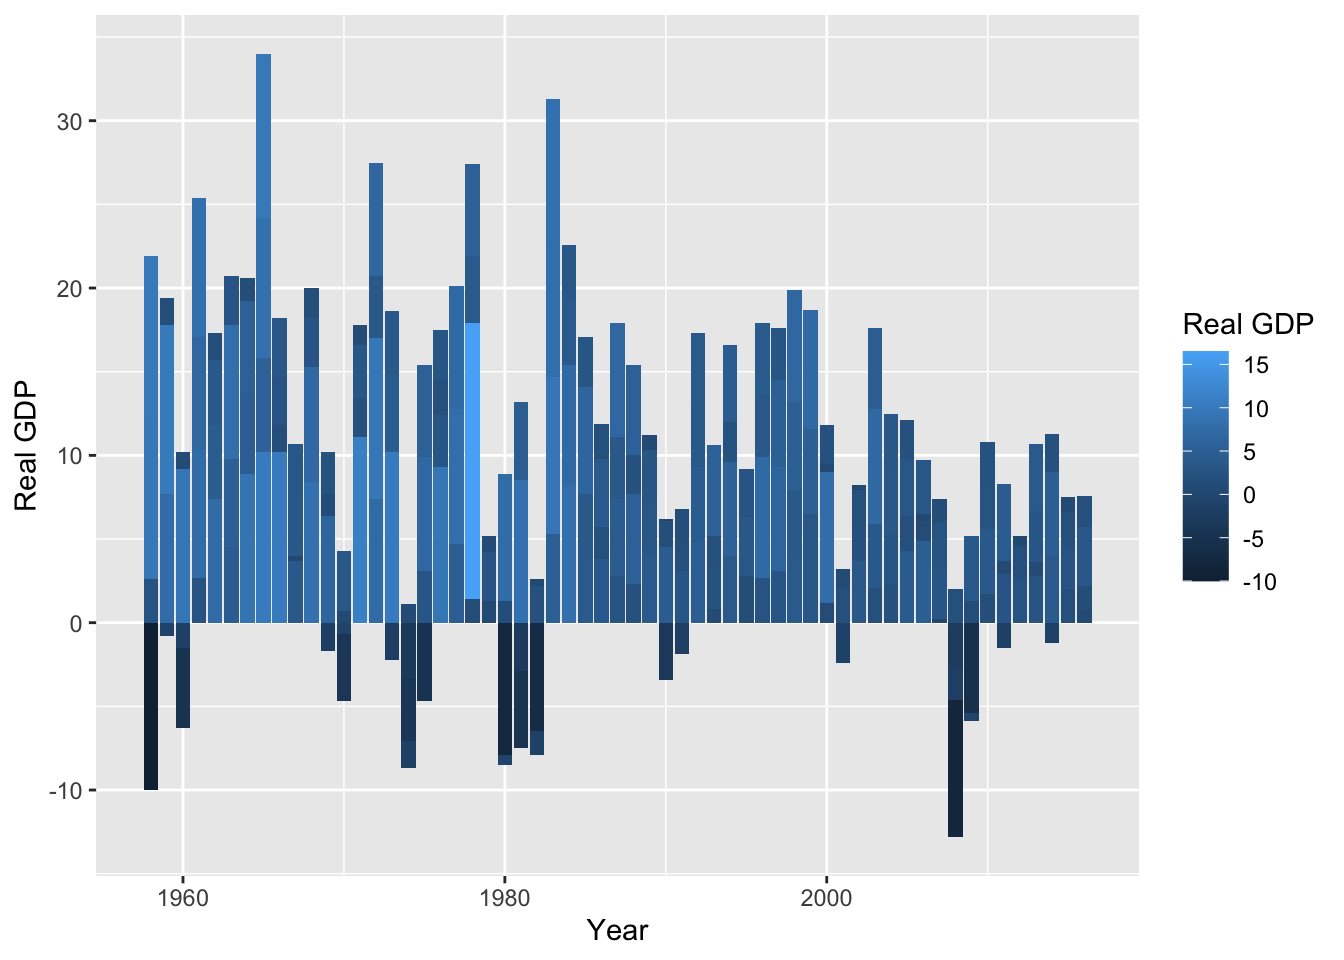
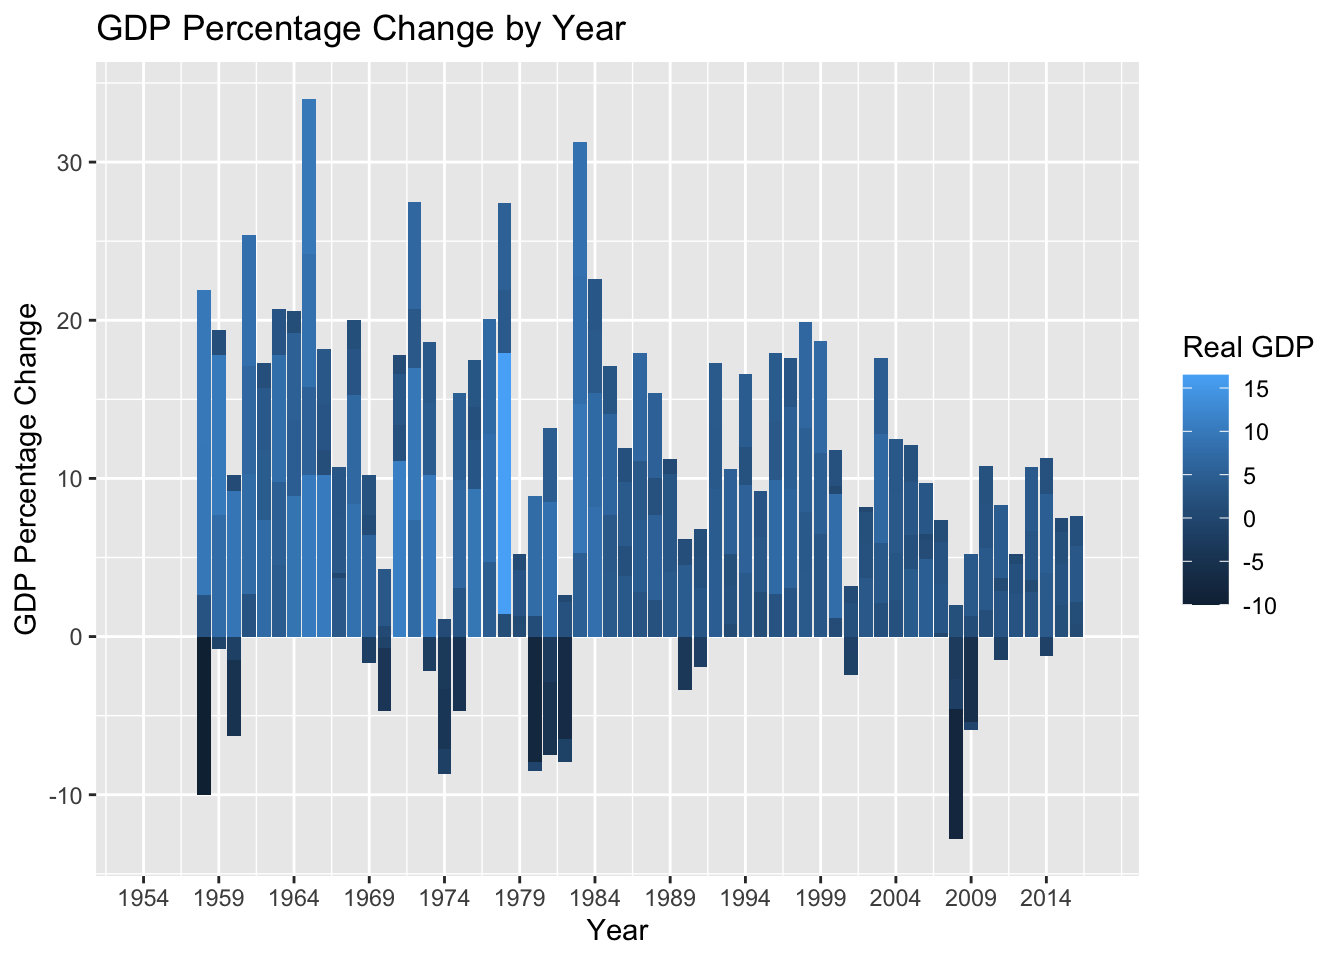
I added limits and breaks to see the most recent year 2017.
perctgdp<-perctgdp+scale_x_continuous(limits=c(1954,2017),breaks=seq(1954,2017,5))Relabeled the Y axis to make to clear this not that actual GDP rate but the Percentage change of the GDP
print(perctgdp + labs(
  title = "GDP Percentage Change by Year",
  y = "GDP Percentage Change", x = "Year"
))
ggplot(year_metrics) +
  aes(x = `Unemployment Rate`, y = `Inflation Rate`) +
  geom_point(colour = "#0c4c8a") +
  theme_minimal()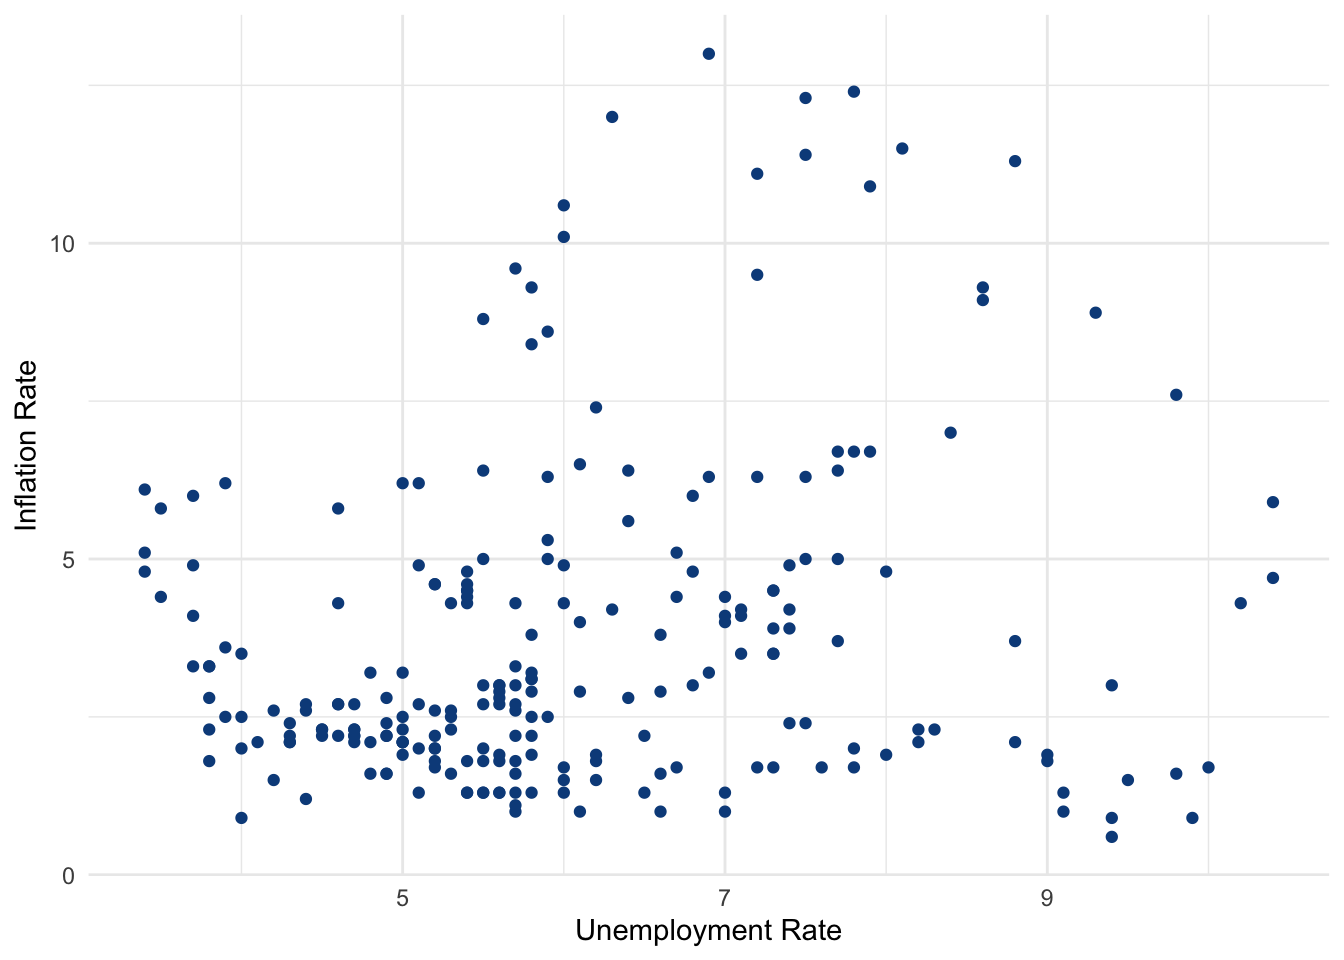
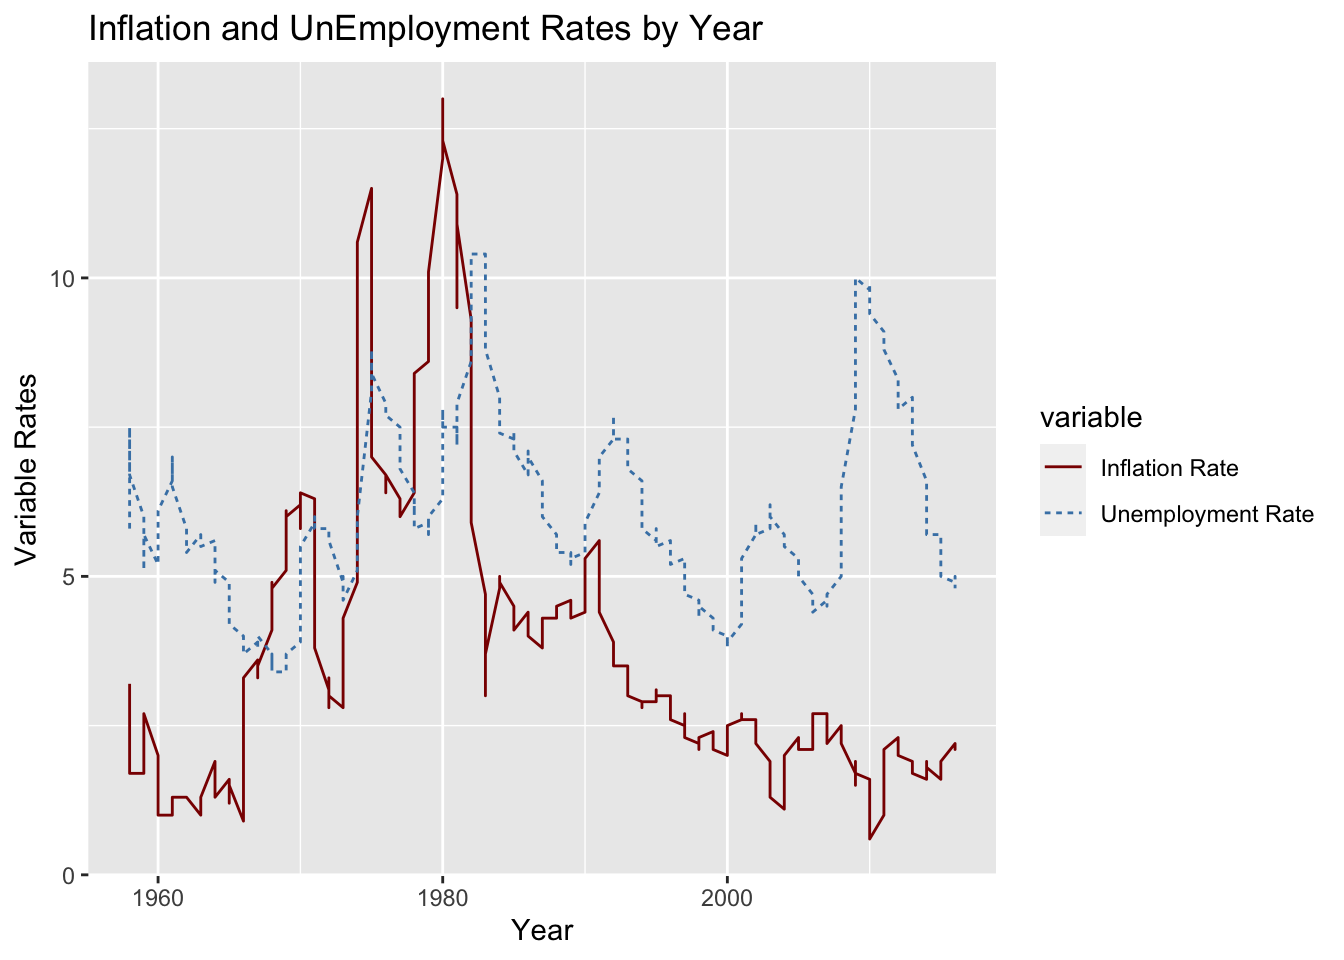
I did a Correlation test of Unemployment rate and the Inflation rate. It got only a moderate Correlation.
cor(year_metrics$`Unemployment Rate`,year_metrics$`Inflation Rate`)[1] 0.2095474Trying to Graph both the Unemployment Rate and Inflation Rate by Year
df <- year_metrics %>%
  select(Year, `Unemployment Rate`, `Inflation Rate`) %>%
  gather(key = "variable", value = "value", -Year)
Graph that shows inflation rate vs Unemployment Rate by Year
As shown here, there can be periods of High Inflation and low unemployment which is why there isn’t a strong correlation.
ggplot(df, aes(x =`Year`, y = value)) +
  geom_line(aes(color = variable, linetype = variable)) +
  scale_color_manual(values = c("darkred", "steelblue"))+labs(
  title = "Inflation and UnEmployment Rates by Year",
  y = "Variable Rates", x = "Year")