Code
library(tidyverse)
library(readr)
library(dplyr)

knitr::opts_chunk$set(echo = TRUE, warning=FALSE, message=FALSE)library(tidyverse)
library(readr)
library(dplyr)
knitr::opts_chunk$set(echo = TRUE, warning=FALSE, message=FALSE)Today’s challenge is to
read in a dataset, and
describe the dataset using both words and any supporting information (e.g., tables, etc)
Read in one (or more) of the following data sets, using the correct R package and command.
Find the _data folder, located inside the posts folder. Then you can read in the data, using either one of the readr standard tidy read commands, or a specialized package such as readxl.
birds_data <- read_csv("_data/birds.csv",show_col_types = FALSE)
#spec(birds_data) -> full column specification
After importing the csv file, and I notice that out of the 14 columns, 8 of them are of character type and 6 columns are double. Total rows -> 30977!
Using a combination of words and results of R commands, can you provide a high level description of the data? Describe as efficiently as possible where/how the data was (likely) gathered, indicate the cases and variables (both the interpretation and any details you deem useful to the reader to fully understand your chosen data).
names(birds_data) [1] "Domain Code" "Domain" "Area Code" "Area"
[5] "Element Code" "Element" "Item Code" "Item"
[9] "Year Code" "Year" "Unit" "Value"
[13] "Flag" "Flag Description"Column names at a glance
head(birds_data)# A tibble: 6 × 14
Domai…¹ Domain Area …² Area Eleme…³ Element Item …⁴ Item Year …⁵ Year Unit
<chr> <chr> <dbl> <chr> <dbl> <chr> <dbl> <chr> <dbl> <dbl> <chr>
1 QA Live … 2 Afgh… 5112 Stocks 1057 Chic… 1961 1961 1000…
2 QA Live … 2 Afgh… 5112 Stocks 1057 Chic… 1962 1962 1000…
3 QA Live … 2 Afgh… 5112 Stocks 1057 Chic… 1963 1963 1000…
4 QA Live … 2 Afgh… 5112 Stocks 1057 Chic… 1964 1964 1000…
5 QA Live … 2 Afgh… 5112 Stocks 1057 Chic… 1965 1965 1000…
6 QA Live … 2 Afgh… 5112 Stocks 1057 Chic… 1966 1966 1000…
# … with 3 more variables: Value <dbl>, Flag <chr>, `Flag Description` <chr>,
# and abbreviated variable names ¹`Domain Code`, ²`Area Code`,
# ³`Element Code`, ⁴`Item Code`, ⁵`Year Code`
# ℹ Use `colnames()` to see all variable namesstr(birds_data)spec_tbl_df [30,977 × 14] (S3: spec_tbl_df/tbl_df/tbl/data.frame)
$ Domain Code : chr [1:30977] "QA" "QA" "QA" "QA" ...
$ Domain : chr [1:30977] "Live Animals" "Live Animals" "Live Animals" "Live Animals" ...
$ Area Code : num [1:30977] 2 2 2 2 2 2 2 2 2 2 ...
$ Area : chr [1:30977] "Afghanistan" "Afghanistan" "Afghanistan" "Afghanistan" ...
$ Element Code : num [1:30977] 5112 5112 5112 5112 5112 ...
$ Element : chr [1:30977] "Stocks" "Stocks" "Stocks" "Stocks" ...
$ Item Code : num [1:30977] 1057 1057 1057 1057 1057 ...
$ Item : chr [1:30977] "Chickens" "Chickens" "Chickens" "Chickens" ...
$ Year Code : num [1:30977] 1961 1962 1963 1964 1965 ...
$ Year : num [1:30977] 1961 1962 1963 1964 1965 ...
$ Unit : chr [1:30977] "1000 Head" "1000 Head" "1000 Head" "1000 Head" ...
$ Value : num [1:30977] 4700 4900 5000 5300 5500 5800 6600 6290 6300 6000 ...
$ Flag : chr [1:30977] "F" "F" "F" "F" ...
$ Flag Description: chr [1:30977] "FAO estimate" "FAO estimate" "FAO estimate" "FAO estimate" ...
- attr(*, "spec")=
.. cols(
.. `Domain Code` = col_character(),
.. Domain = col_character(),
.. `Area Code` = col_double(),
.. Area = col_character(),
.. `Element Code` = col_double(),
.. Element = col_character(),
.. `Item Code` = col_double(),
.. Item = col_character(),
.. `Year Code` = col_double(),
.. Year = col_double(),
.. Unit = col_character(),
.. Value = col_double(),
.. Flag = col_character(),
.. `Flag Description` = col_character()
.. )
- attr(*, "problems")=<externalptr> We get to see a get a high level view of the column names and its entries.
hist(birds_data$`Item Code`)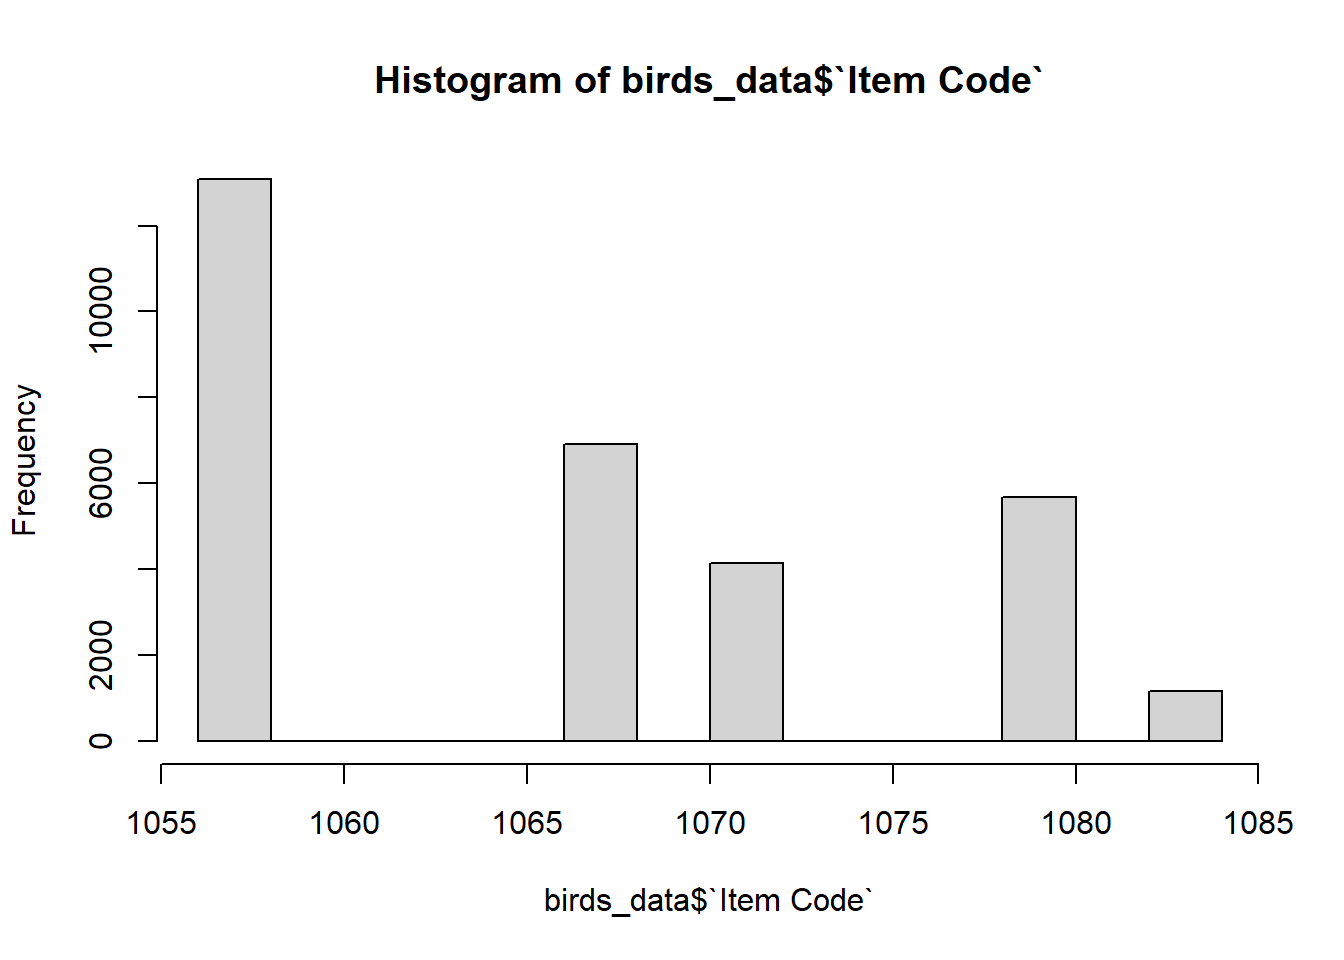
hist(birds_data$`Area Code`)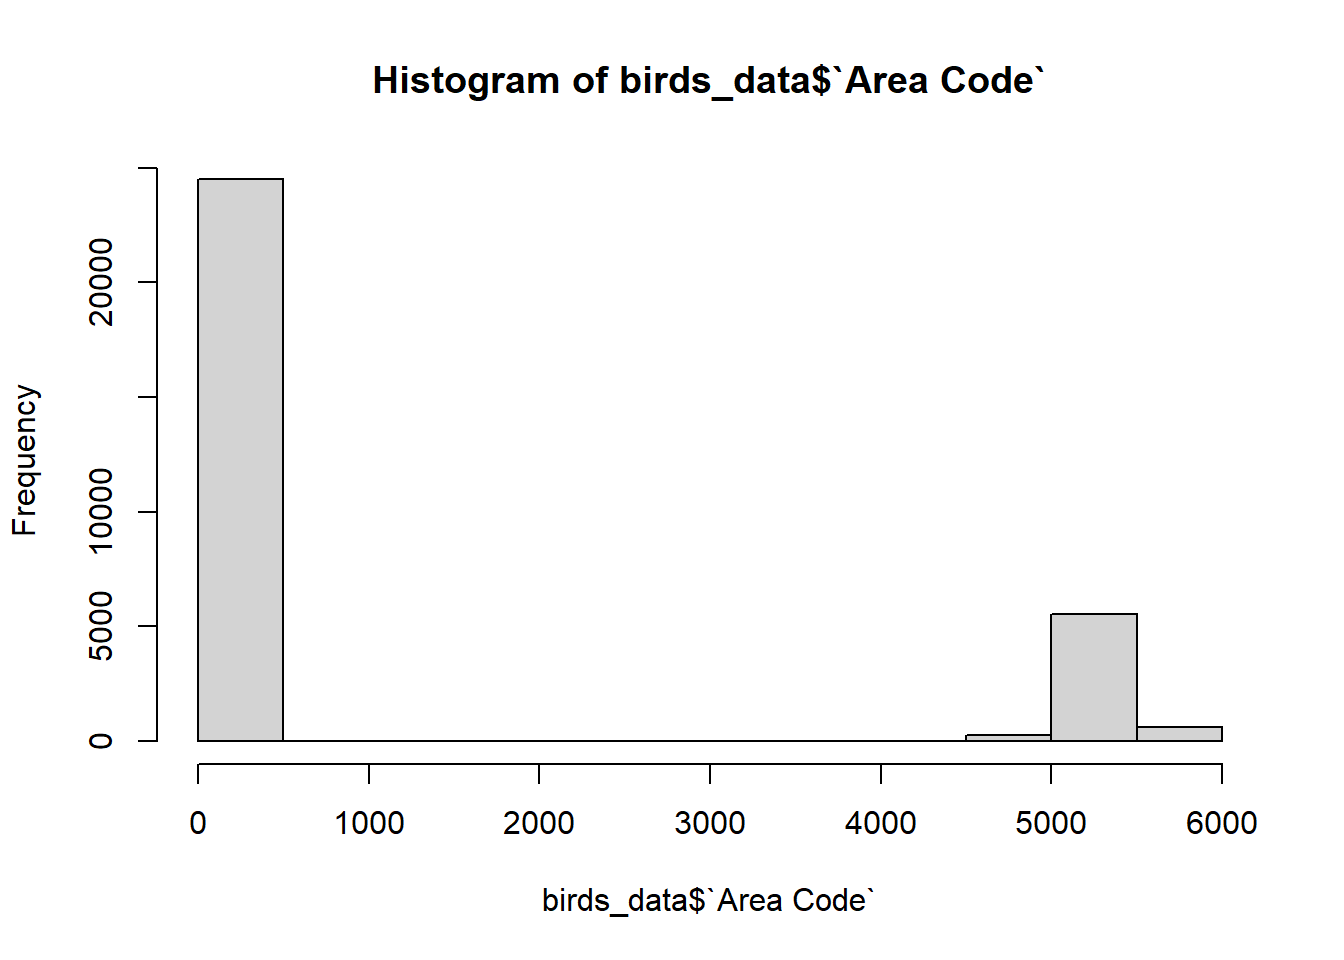
Using the histogram functions, observed that the frequency for item code and area codes respectively.