Read in a dataset and describe it with words and visuals
#For my purposes I'll be reading in the birds.csv dataset. The data appears to record the number of various birds (ducks, geese, chickens, etc.) in different countries during the mid 20th-early 21st century. library(readr)library(tidyverse)
  Domain.Code       Domain Area.Code        Area Element.Code Element Item.Code
1          QA Live Animals         2 Afghanistan         5112  Stocks      1057
2          QA Live Animals         2 Afghanistan         5112  Stocks      1057
3          QA Live Animals         2 Afghanistan         5112  Stocks      1057
4          QA Live Animals         2 Afghanistan         5112  Stocks      1057
5          QA Live Animals         2 Afghanistan         5112  Stocks      1057
6          QA Live Animals         2 Afghanistan         5112  Stocks      1057
      Item Year.Code Year      Unit Value Flag Flag.Description
1 Chickens      1961 1961 1000 Head  4700    F     FAO estimate
2 Chickens      1962 1962 1000 Head  4900    F     FAO estimate
3 Chickens      1963 1963 1000 Head  5000    F     FAO estimate
4 Chickens      1964 1964 1000 Head  5300    F     FAO estimate
5 Chickens      1965 1965 1000 Head  5500    F     FAO estimate
6 Chickens      1966 1966 1000 Head  5800    F     FAO estimate
#Below is the head of the dataset. At first glance it looks ok, but the dimensions, as I will show, require the data to be trimmed down.
dim(birds_1)
[1] 30977 14
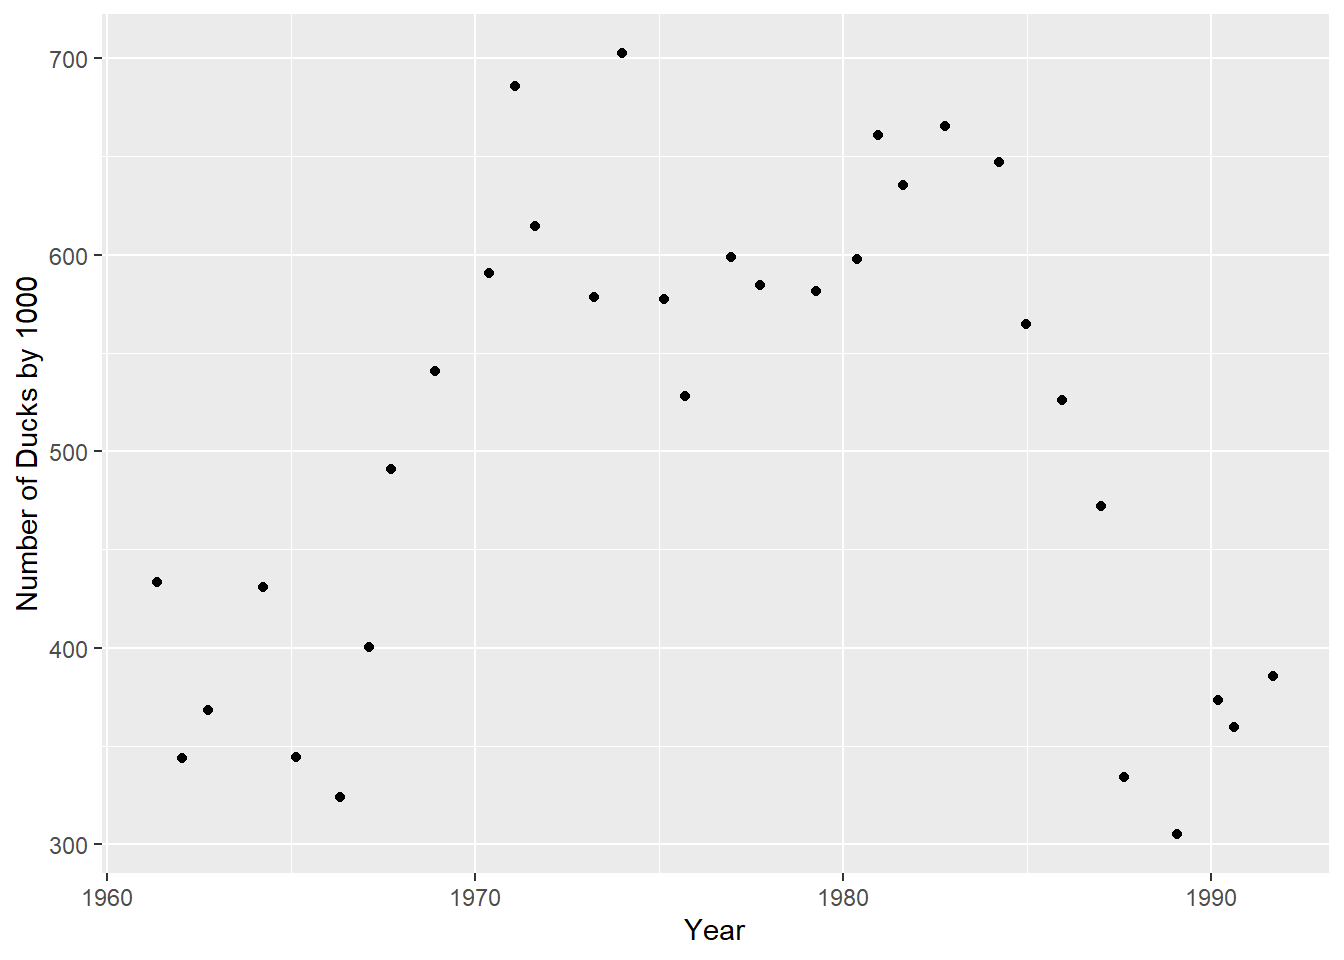
#There are 30,977 rows and 14 columns in this dataset (too many), so I will use the select function(s) to isolate specific variables; I want to look at the record of duck numbers in Czechoslovakia.
#The recorded number of ducks in Czechoslovakia fluctuates between being in the 300,000s and the 700,000s. Lets visualize it!ggplot(birds_ref2, aes(x=Year,y=Value)) +geom_jitter() +labs(y="Number of Ducks by 1000")