Code
library(tidyverse)

knitr::opts_chunk$set(echo = TRUE, warning=FALSE, message=FALSE)Mekhala Kumar
August 15, 2022
Two datasets have been used: Railroad_2012_clean_county and birds.
The first dataset is about the number of employees in each company. There are 3 variables as can be seen using the colnames command- state, county, number of employees. The number of employees is a continuous variable. The data was gathered from several states as seen in the table.
The second dataset has 14 columns and 30977 observations. From colnames, we get to know that the dataset gives us the values of the dietary energy intake for different countries across different years. Data types of the columns, value could actually be converted into double type. There were around 11000 missing values found and removed from the data. Many countries were included in this dataset and there are 6 types of birds but only one domain of animals present.
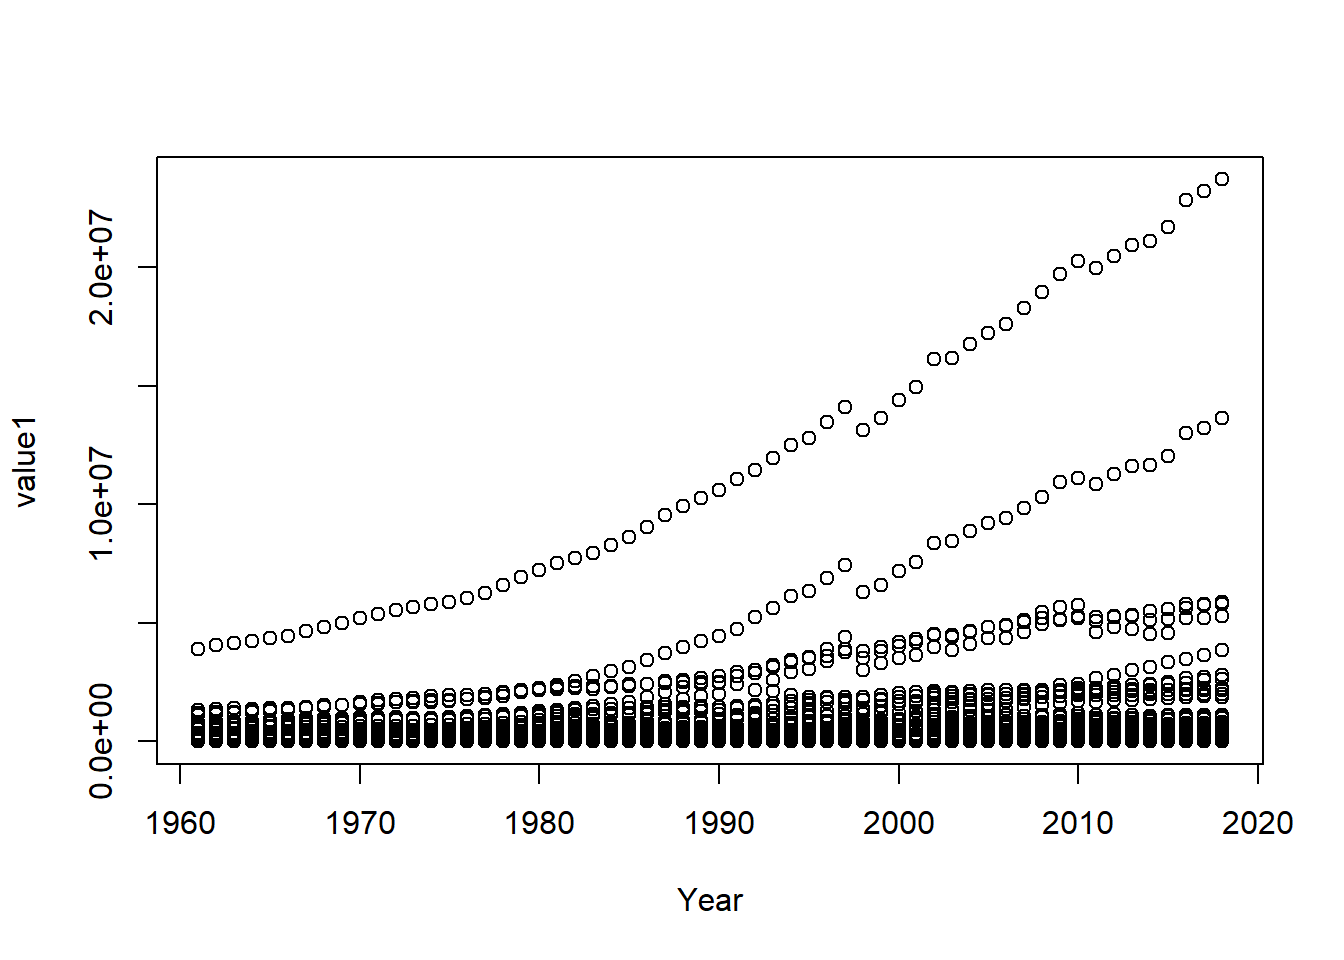
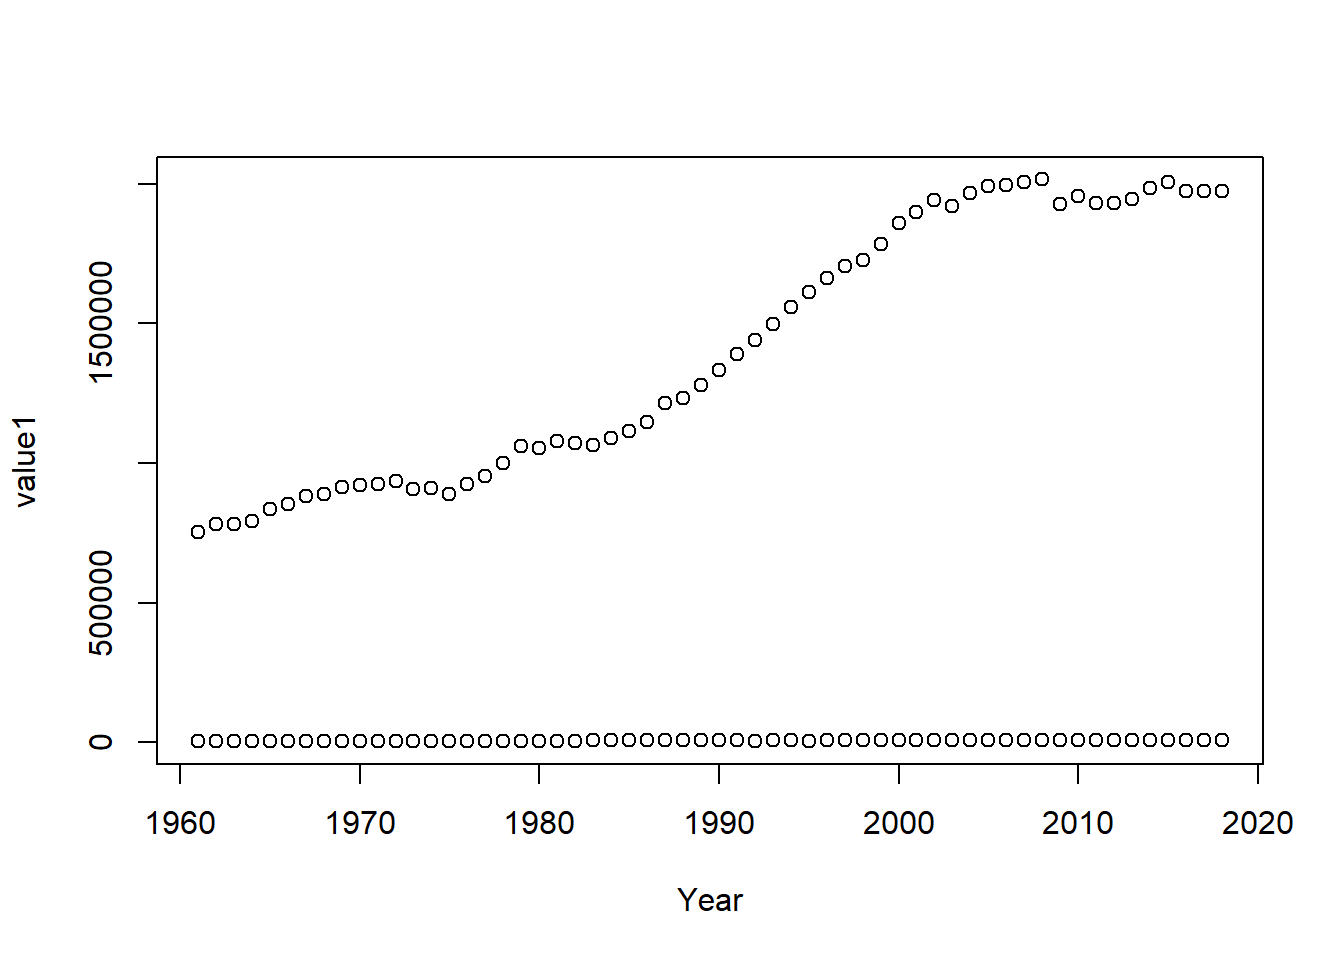
A plot was created to visualise the changes in the Value across the years.It can be seen that the values have increased over time. A plot was also created to visualise the changes in a specific country, in this case, the USA.
[1] "state" "county" "total_employees"state
AE AK AL AP AR AZ CA CO CT DC DE FL GA HI IA ID IL IN KS KY
1 6 67 1 72 15 55 57 8 1 3 67 152 3 99 36 103 92 95 119
LA MA MD ME MI MN MO MS MT NC ND NE NH NJ NM NV NY OH OK OR
63 12 24 16 78 86 115 78 53 94 49 89 10 21 29 12 61 88 73 33
PA RI SC SD TN TX UT VA VT WA WI WV WY
65 5 46 52 91 221 25 92 14 39 69 53 22 state
AE AK AL AP AR AZ
0.0003412969 0.0020477816 0.0228668942 0.0003412969 0.0245733788 0.0051194539
CA CO CT DC DE FL
0.0187713311 0.0194539249 0.0027303754 0.0003412969 0.0010238908 0.0228668942
GA HI IA ID IL IN
0.0518771331 0.0010238908 0.0337883959 0.0122866894 0.0351535836 0.0313993174
KS KY LA MA MD ME
0.0324232082 0.0406143345 0.0215017065 0.0040955631 0.0081911263 0.0054607509
MI MN MO MS MT NC
0.0266211604 0.0293515358 0.0392491468 0.0266211604 0.0180887372 0.0320819113
ND NE NH NJ NM NV
0.0167235495 0.0303754266 0.0034129693 0.0071672355 0.0098976109 0.0040955631
NY OH OK OR PA RI
0.0208191126 0.0300341297 0.0249146758 0.0112627986 0.0221843003 0.0017064846
SC SD TN TX UT VA
0.0156996587 0.0177474403 0.0310580205 0.0754266212 0.0085324232 0.0313993174
VT WA WI WV WY
0.0047781570 0.0133105802 0.0235494881 0.0180887372 0.0075085324 [1] 30977 14 [1] "Domain Code" "Domain" "Area Code" "Area"
[5] "Element Code" "Element" "Item Code" "Item"
[9] "Year Code" "Year" "Unit" "Value"
[13] "Flag" "Flag Description"spec_tbl_df [30,977 × 14] (S3: spec_tbl_df/tbl_df/tbl/data.frame)
$ Domain Code : chr [1:30977] "QA" "QA" "QA" "QA" ...
$ Domain : chr [1:30977] "Live Animals" "Live Animals" "Live Animals" "Live Animals" ...
$ Area Code : num [1:30977] 2 2 2 2 2 2 2 2 2 2 ...
$ Area : chr [1:30977] "Afghanistan" "Afghanistan" "Afghanistan" "Afghanistan" ...
$ Element Code : num [1:30977] 5112 5112 5112 5112 5112 ...
$ Element : chr [1:30977] "Stocks" "Stocks" "Stocks" "Stocks" ...
$ Item Code : num [1:30977] 1057 1057 1057 1057 1057 ...
$ Item : chr [1:30977] "Chickens" "Chickens" "Chickens" "Chickens" ...
$ Year Code : num [1:30977] 1961 1962 1963 1964 1965 ...
$ Year : num [1:30977] 1961 1962 1963 1964 1965 ...
$ Unit : chr [1:30977] "1000 Head" "1000 Head" "1000 Head" "1000 Head" ...
$ Value : num [1:30977] 4700 4900 5000 5300 5500 5800 6600 6290 6300 6000 ...
$ Flag : chr [1:30977] "F" "F" "F" "F" ...
$ Flag Description: chr [1:30977] "FAO estimate" "FAO estimate" "FAO estimate" "FAO estimate" ...
- attr(*, "spec")=
.. cols(
.. `Domain Code` = col_character(),
.. Domain = col_character(),
.. `Area Code` = col_double(),
.. Area = col_character(),
.. `Element Code` = col_double(),
.. Element = col_character(),
.. `Item Code` = col_double(),
.. Item = col_character(),
.. `Year Code` = col_double(),
.. Year = col_double(),
.. Unit = col_character(),
.. Value = col_double(),
.. Flag = col_character(),
.. `Flag Description` = col_character()
.. )
- attr(*, "problems")=<externalptr> [1] 12845[1] 19168 15Area
Afghanistan
31
Africa
290
Albania
62
Algeria
208
American Samoa
53
Americas
232
Angola
49
Antigua and Barbuda
53
Argentina
132
Armenia
39
Asia
290
Australia
47
Australia and New Zealand
232
Austria
63
Azerbaijan
46
Bahamas
57
Bahrain
48
Bangladesh
46
Barbados
79
Belarus
68
Belgium
36
Belize
151
Benin
24
Bermuda
44
Bhutan
29
Bolivia (Plurinational State of)
125
Bosnia and Herzegovina
80
Botswana
29
Brazil
94
Brunei Darussalam
35
Bulgaria
59
Burkina Faso
40
Burundi
45
Cabo Verde
38
Cambodia
65
Cameroon
31
Canada
146
Caribbean
232
Cayman Islands
31
Central African Republic
69
Central America
174
Central Asia
108
Chad
58
Chile
53
China, Hong Kong SAR
124
China, Macao SAR
58
China, mainland
168
Colombia
45
Comoros
58
Congo
41
Cook Islands
55
Costa Rica
43
Côte d'Ivoire
28
Croatia
27
Cuba
3
Cyprus
196
Czechia
1
Czechoslovakia
1
Democratic People's Republic of Korea
60
Democratic Republic of the Congo
17
Denmark
2
Dominica
58
Dominican Republic
41
Eastern Africa
232
Eastern Asia
290
Eastern Europe
232
Ecuador
147
Egypt
92
El Salvador
31
Equatorial Guinea
112
Eritrea
23
Estonia
90
Eswatini
22
Ethiopia
8
Ethiopia PDR
16
Europe
290
Falkland Islands (Malvinas)
25
Fiji
171
Finland
16
France
74
French Guyana
80
French Polynesia
115
Gabon
49
Gambia
30
Georgia
43
Germany
40
Ghana
17
Greece
25
Grenada
51
Guadeloupe
140
Guam
48
Guatemala
29
Guinea
26
Guinea-Bissau
44
Guyana
48
Haiti
218
Honduras
33
India
79
Indonesia
13
Iran (Islamic Republic of)
214
Iraq
48
Ireland
108
Israel
94
Italy
103
Jamaica
56
Japan
60
Jordan
137
Kazakhstan
41
Kenya
22
Kiribati
56
Kuwait
13
Kyrgyzstan
51
Lao People's Democratic Republic
117
Latvia
13
Lebanon
46
Lesotho
39
Liberia
116
Libya
37
Lithuania
24
Madagascar
218
Malawi
50
Malaysia
50
Mali
30
Malta
76
Martinique
65
Mauritania
53
Mauritius
193
Melanesia
174
Mexico
68
Micronesia
111
Micronesia (Federated States of)
48
Middle Africa
174
Mongolia
2
Montenegro
3
Montserrat
53
Morocco
70
Mozambique
98
Myanmar
112
Namibia
70
Nauru
58
Nepal
48
Netherlands
10
Netherlands Antilles (former)
58
New Caledonia
48
New Zealand
161
Nicaragua
45
Niger
17
Nigeria
13
Niue
47
North Macedonia
2
Northern Africa
290
Northern America
232
Northern Europe
232
Norway
17
Oceania
232
Oman
52
Pacific Islands Trust Territory
28
Pakistan
94
Palestine
19
Panama
106
Papua New Guinea
140
Paraguay
87
Philippines
108
Polynesia
116
Portugal
92
Puerto Rico
15
Qatar
32
Republic of Korea
12
Republic of Moldova
52
Réunion
107
Romania
156
Russian Federation
45
Rwanda
73
Saint Helena, Ascension and Tristan da Cunha
30
Saint Kitts and Nevis
55
Saint Lucia
40
Saint Pierre and Miquelon
41
Saint Vincent and the Grenadines
44
Samoa
50
Sao Tome and Principe
168
Saudi Arabia
88
Senegal
5
Serbia and Montenegro
53
Seychelles
100
Sierra Leone
78
Singapore
73
Slovakia
2
Slovenia
36
Solomon Islands
57
Somalia
58
South-eastern Asia
290
South Africa
193
South America
232
South Sudan
7
Southern Africa
261
Southern Asia
232
Southern Europe
290
Spain
91
Sri Lanka
10
Sudan (former)
30
Suriname
47
Sweden
49
Switzerland
20
Syrian Arab Republic
32
Thailand
17
Timor-Leste
46
Togo
11
Tokelau
56
Tonga
32
Trinidad and Tobago
47
Tunisia
50
Turkey
56
Turkmenistan
49
Tuvalu
45
Uganda
24
United Arab Emirates
49
United Kingdom of Great Britain and Northern Ireland
28
United Republic of Tanzania
97
United States of America
116
United States Virgin Islands
41
Uruguay
211
USSR
12
Uzbekistan
54
Vanuatu
51
Venezuela (Bolivarian Republic of)
29
Viet Nam
79
Wallis and Futuna Islands
54
Western Africa
116
Western Asia
290
Western Europe
290
World
290
Yemen
52
Yugoslav SFR
4
Zambia
49
Zimbabwe
158 Item
Chickens Ducks Geese and guinea fowls
7698 4357 2599
Pigeons, other birds Turkeys
903 3611 Domain
Live Animals
19168 

---
title: "Challenge 1"
author: "Mekhala Kumar"
desription: "Reading in data and creating a post"
date: "08/15/2022"
format:
html:
toc: true
code-fold: true
code-copy: true
code-tools: true
categories:
- challenge_1
---
```{r}
#| label: setup
#| warning: false
#| message: false
library(tidyverse)
knitr::opts_chunk$set(echo = TRUE, warning=FALSE, message=FALSE)
```
## Datasets used
Two datasets have been used: Railroad_2012_clean_county and birds.
```{r}
#1st Dataset Railroad_2012_clean_county
library(readr)
railroad_2012_clean_county <- read_csv("_data/railroad_2012_clean_county.csv")
view(railroad_2012_clean_county)
#2nd Dataset birds
birds <- read_csv("_data/birds.csv")
View(birds)
```
## Description of Datasets
The first dataset is about the number of employees in each company. There are 3 variables as can be seen using the colnames command- state, county, number of employees. The number of employees is a continuous variable. The data was gathered from several states as seen in the table.\
The second dataset has 14 columns and 30977 observations. From colnames, we get to know that the dataset gives us the values of the dietary energy intake for different countries across different years. Data types of the columns, value could actually be converted into double type. There were around 11000 missing values found and removed from the data. Many countries were included in this dataset and there are 6 types of birds but only one domain of animals present.\
A plot was created to visualise the changes in the Value across the years.It can be seen that the values have increased over time. A plot was also created to visualise the changes in a specific country, in this case, the USA.
```{r}
#| label: summary
#1st dataset Railroad_2012_clean_county

colnames(railroad_2012_clean_county)
states<-select(railroad_2012_clean_county,state)
table(states)
prop.table(table(states))
#2nd dataset birds

dim(birds)
colnames(birds)
str(birds)
birds <- transform(birds,value1 = as.numeric(Value))
sum(is.na(birds))
birds<-na.omit(birds)
dim(birds)
area<-select(birds,Area)
table(area)
item<-select(birds,Item)
table(item)
domain<-select(birds,Domain)
table(domain)
plot(value1~Year,birds)
birds_USA<-birds%>% filter(`Area`=='United States of America')
plot(value1~Year,birds_USA)
```