#This data set shows hotel booking data between 2015 and 2017. A few of the variables it includes are: # of nights stayed (weekday and weekend), the type of hotel, # of people (adults, children, babies), and whether the reservation was canceled or kept. There are way too many variables in the data set to easily read it, so I'm going to filter it down and try to collapse some columns using pivot)longer().
#Upon first glance, I see that arrival dates are broken up into at least 4 different columns. I'm going to use pivot_longer() to combine them. I'm going to filter out some of the columns as well, focusing on arrival date and how long each stay was (weekday and weekend).
Code
hotel_bookings1 <- hotel_bookings %>%select("arrival_date_month","arrival_date_year","stays_in_week_nights","stays_in_weekend_nights","reservation_status") %>%filter(`arrival_date_month`=="November") %>%arrange(stays_in_week_nights,stays_in_weekend_nights) %>%view()#I tried my best to use pivot_longer() and mutate, but I couldn't figure out how to get it to work. Google was no help either.
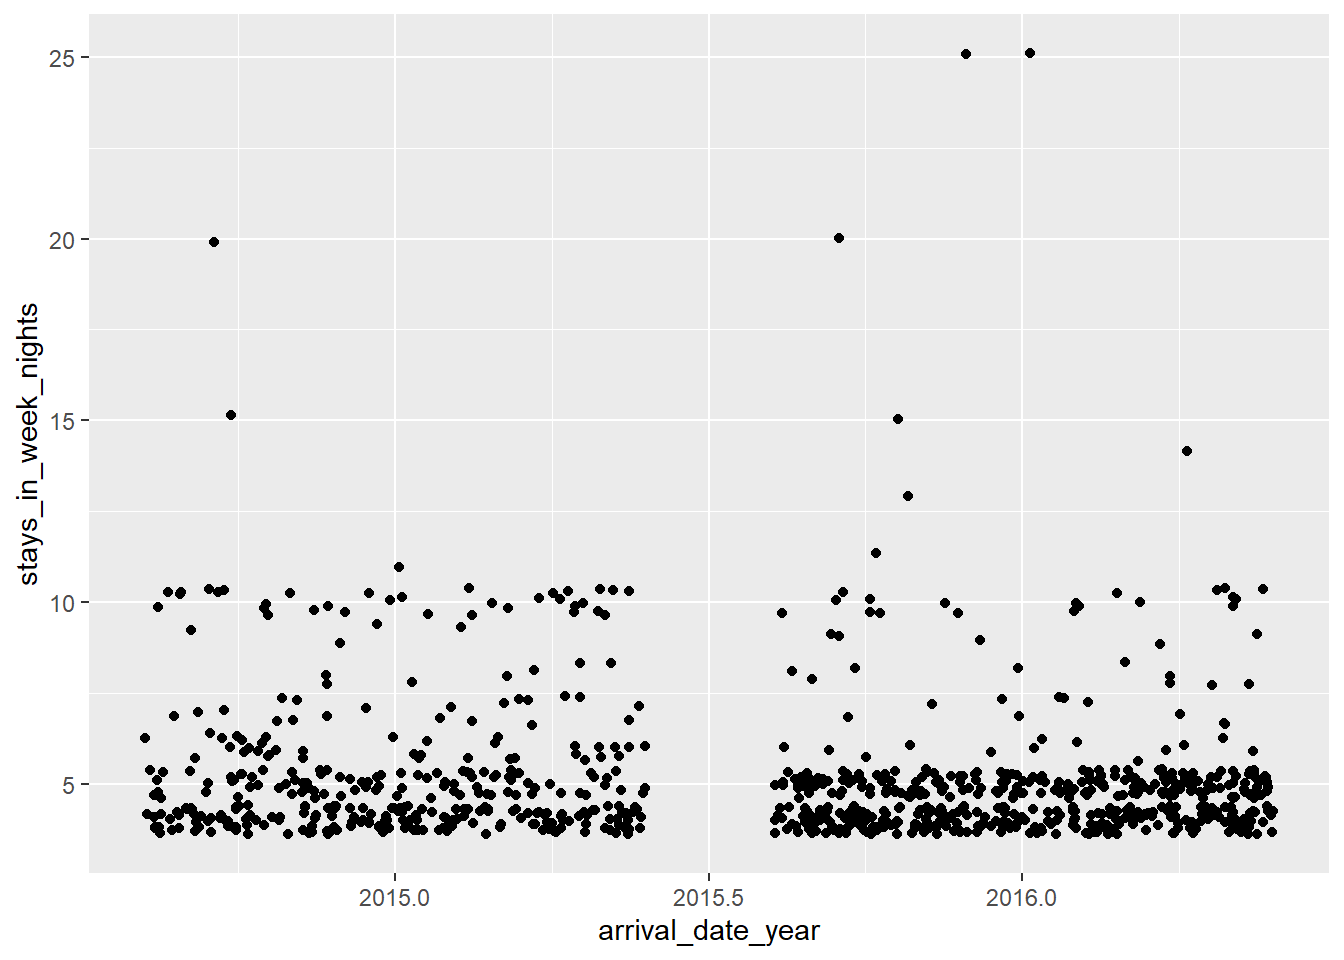
ggplot(hotel_bookings1, mapping =aes(x = arrival_date_year, y = stays_in_week_nights)) +geom_jitter()
Code
#I tried my best here and the best geometry function i could find for this was (also geom_jitter). I wanted to compare how many people stayed at their hotel for more than 3 weeknights in 2015 and 2016
Source Code
---title: "Challenge4_KatiePopiela"editor: visualdescription: "More data wrangling: pivoting"date: "08/18/2022"format: html: toc: true code-fold: true code-copy: true code-tools: true---```{r}#| label: setup#| warning: false#| message: falselibrary(tidyverse)knitr::opts_chunk$set(echo =TRUE, warning=FALSE, message=FALSE)```### 1) read in a data set, and describe the data set using both words and any supporting information (e.g., tables, etc)### 2) tidy data (as needed, including sanity checks)### 3) identify variables that need to be mutated### 4) mutate variables and sanity check all mutations```{r}library(dplyr)library(tidyverse)library(tidyr)library(ggplot2)library(readr)hotel_bookings <-read.csv("_data/hotel_bookings.csv")``````{r}#This data set shows hotel booking data between 2015 and 2017. A few of the variables it includes are: # of nights stayed (weekday and weekend), the type of hotel, # of people (adults, children, babies), and whether the reservation was canceled or kept. There are way too many variables in the data set to easily read it, so I'm going to filter it down and try to collapse some columns using pivot)longer().``````{r}colnames(hotel_bookings)#Upon first glance, I see that arrival dates are broken up into at least 4 different columns. I'm going to use pivot_longer() to combine them. I'm going to filter out some of the columns as well, focusing on arrival date and how long each stay was (weekday and weekend).``````{r}hotel_bookings1 <- hotel_bookings %>%select("arrival_date_month","arrival_date_year","stays_in_week_nights","stays_in_weekend_nights","reservation_status") %>%filter(`arrival_date_month`=="November") %>%arrange(stays_in_week_nights,stays_in_weekend_nights) %>%view()#I tried my best to use pivot_longer() and mutate, but I couldn't figure out how to get it to work. Google was no help either.``````{r}hotel_bookings1 <- hotel_bookings1 %>%filter(`reservation_status`=="Check-Out")hotel_bookings1 <- hotel_bookings1 %>%filter(`stays_in_week_nights`>3)``````{r}ggplot(hotel_bookings1, mapping =aes(x = arrival_date_year, y = stays_in_week_nights)) +geom_jitter()``````{r}#I tried my best here and the best geometry function i could find for this was (also geom_jitter). I wanted to compare how many people stayed at their hotel for more than 3 weeknights in 2015 and 2016```