Generated by summarytools 1.0.1 (R version 4.2.1) 2022-08-28
Code
airbnb <- airbnb %>%drop_na()
Time Dependent Visualization
Code
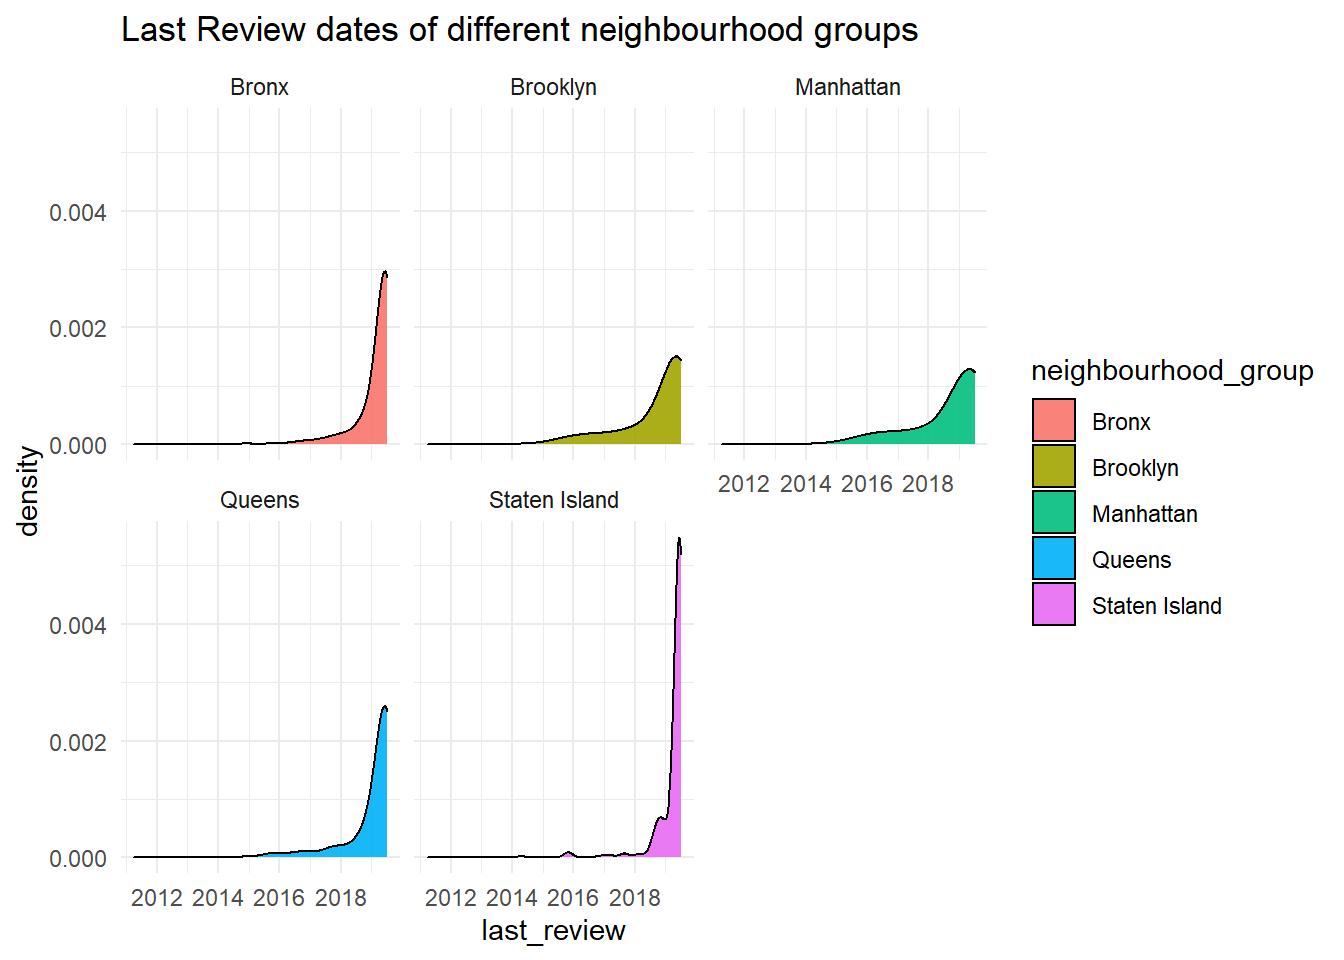
airbnb %>%ggplot(aes(last_review, fill = neighbourhood_group)) +geom_density(alpha =0.9, adjust =5) +facet_wrap(vars(neighbourhood_group)) +theme_minimal() +labs(title ="Last Review dates of different neighbourhood groups")
Code
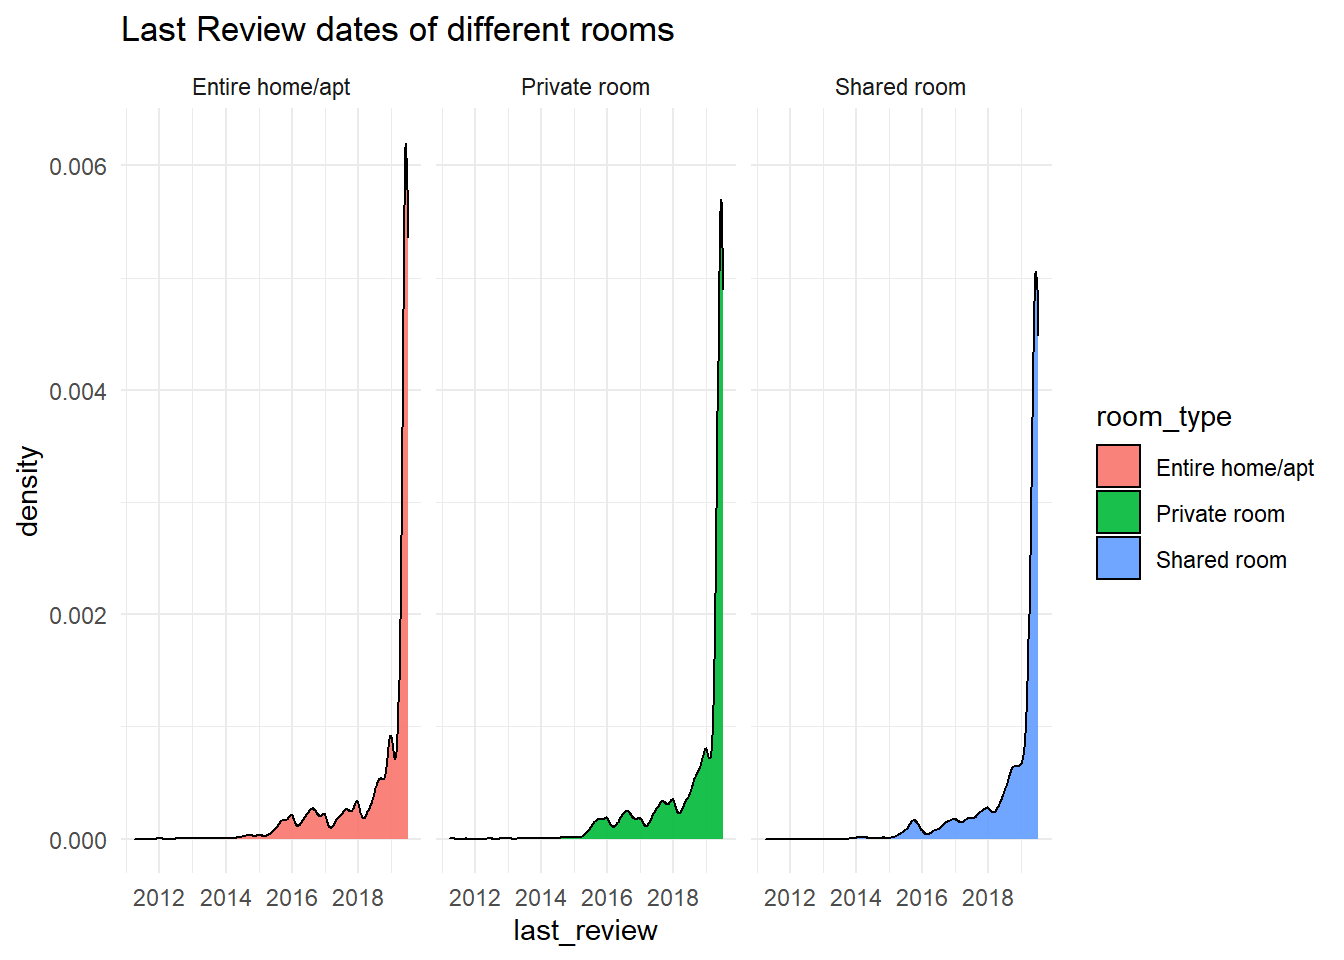
airbnb %>%ggplot(aes(last_review, fill = room_type)) +geom_density(alpha=0.9) +facet_wrap(vars(room_type)) +theme_minimal() +labs(title ="Last Review dates of different rooms")
Code
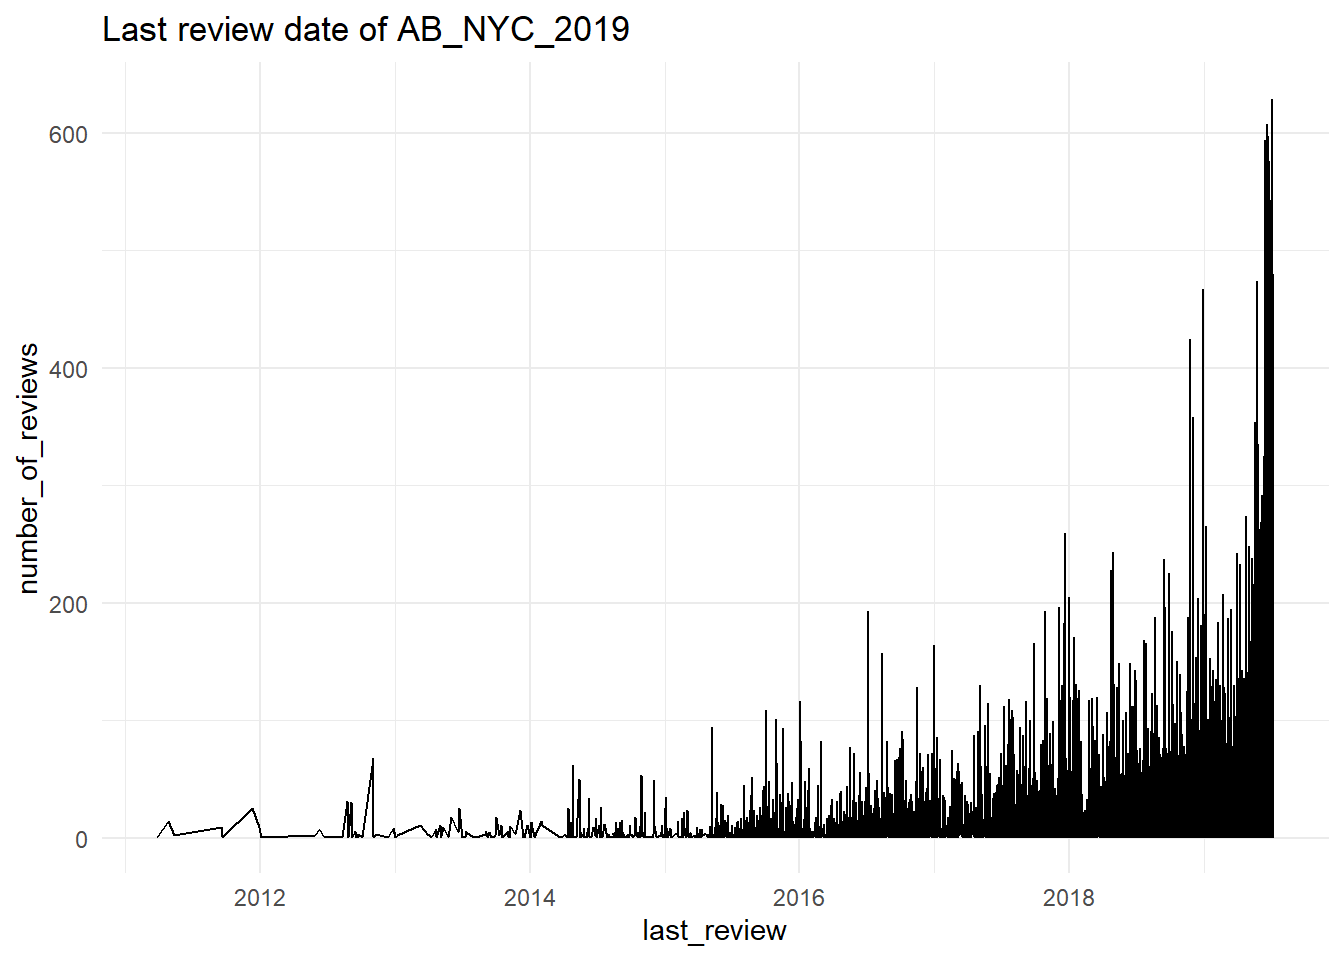
airbnb %>%ggplot(aes(last_review, number_of_reviews)) +geom_line() +theme_minimal() +labs(title ="Last review date of AB_NYC_2019")
Visualizing Part-Whole Relationships
Code
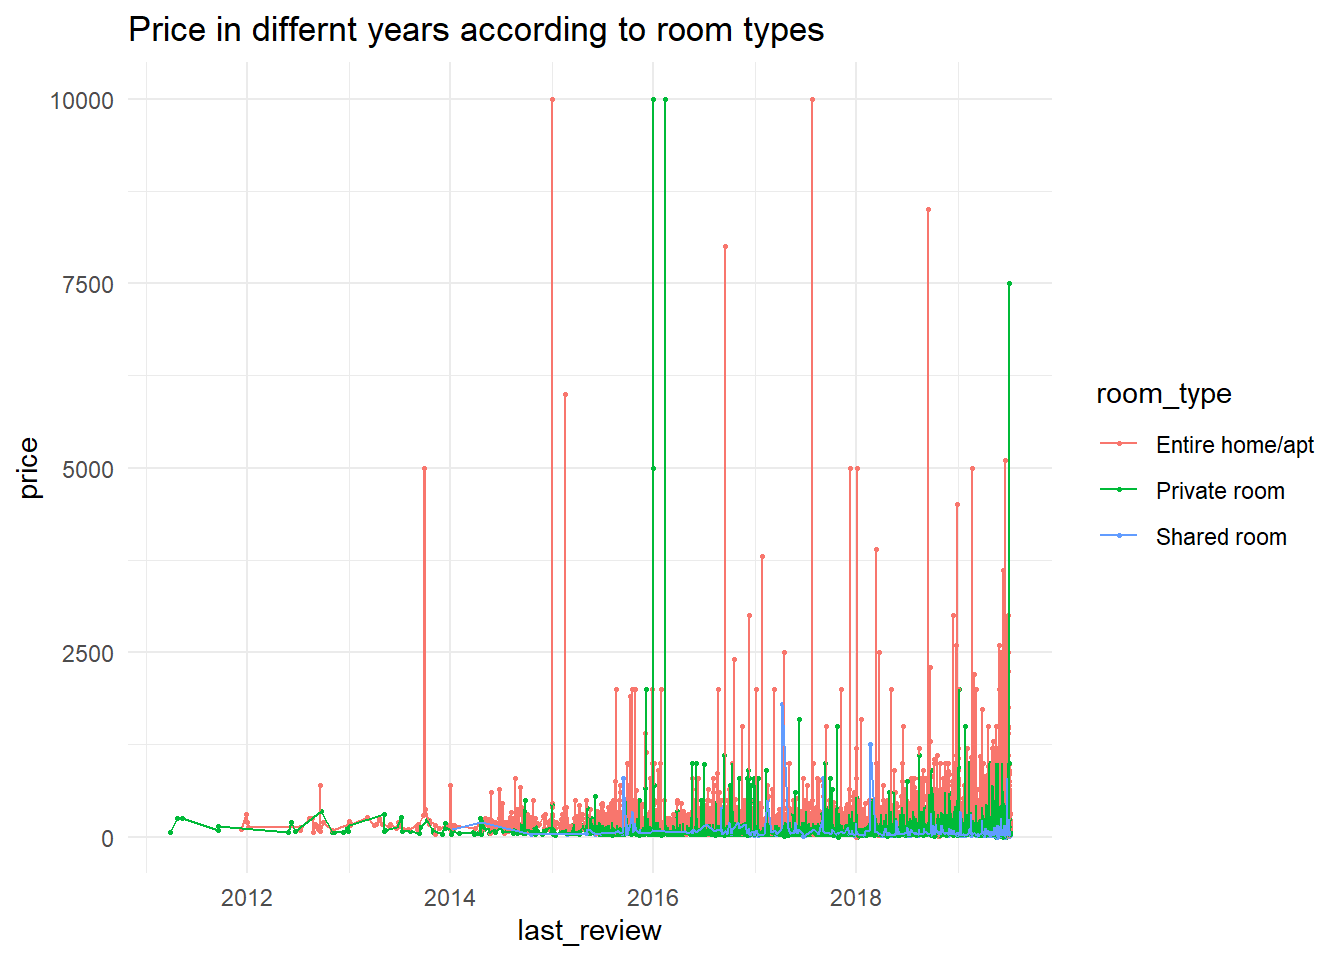
airbnb %>%ggplot(aes(last_review, price, color = room_type)) +geom_point(size = .5) +geom_line() +theme_minimal() +labs(title ="Price in differnt years according to room types")
Code
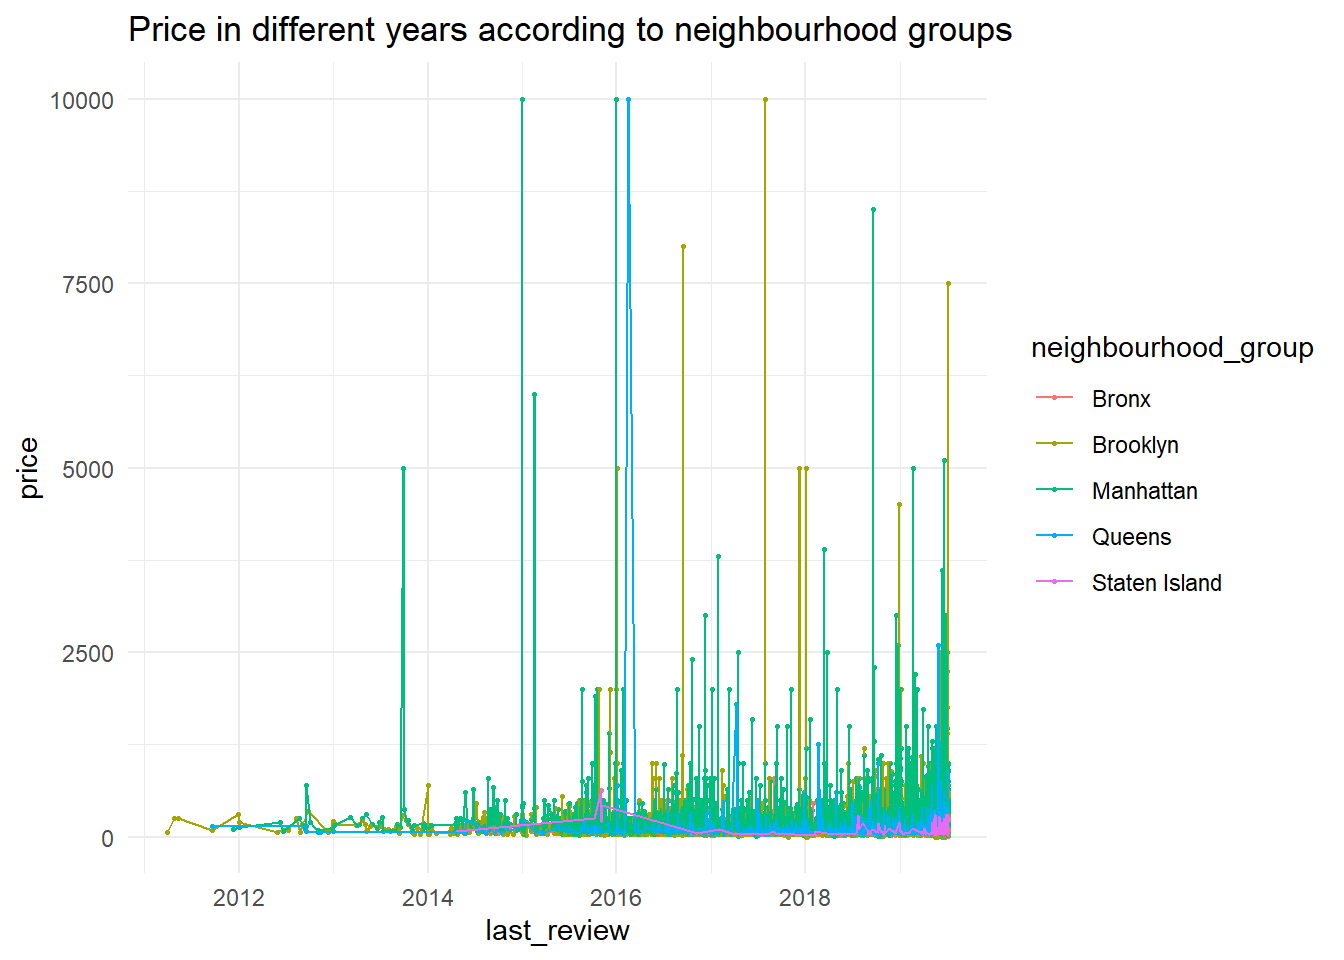
airbnb %>%ggplot(aes(last_review, price, color = neighbourhood_group)) +geom_point(size = .5) +geom_line() +theme_minimal() +labs(title ="Price in different years according to neighbourhood groups")
Code
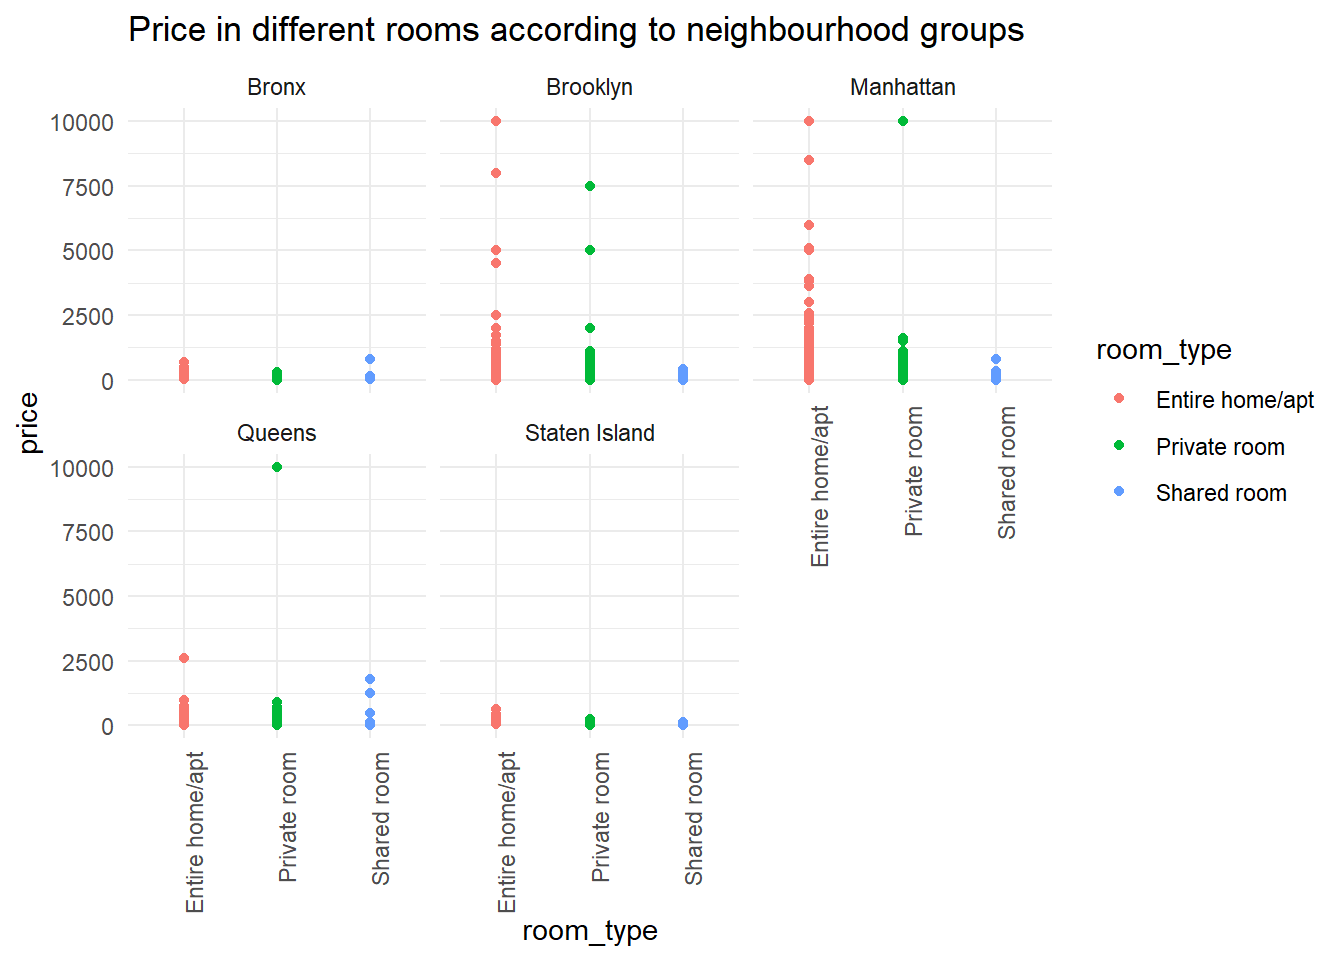
airbnb %>%ggplot(aes(room_type, price, color = room_type)) +geom_point() +theme_minimal() +facet_wrap(vars(neighbourhood_group)) +theme(axis.text.x =element_text(angle =90,hjust =1)) +labs(title ="Price in different rooms according to neighbourhood groups")
Source Code
---title: "Challenge 6"author: "Mani Shanker Kamarapu"description: "Visualizing Time and Relationships"date: "08/23/2022"format: html: df-print: paged toc: true code-fold: true code-copy: true code-tools: true css: styles.csscategories: - challenge_6 - airbnb---```{r}#| label: setup#| warning: false#| message: falselibrary(tidyverse)library(ggplot2)knitr::opts_chunk$set(echo =TRUE, warning=FALSE, message=FALSE)```## Read in data```{r}airbnb <-read_csv("_data/AB_NYC_2019.csv")print(summarytools::dfSummary(airbnb, varnumbers =FALSE, plain.ascii =FALSE, style ="grid", graph.magnif =0.70, valid.col =FALSE), method ='render', table.classes ='table-condensed')``````{r}airbnb <- airbnb %>%select("neighbourhood_group", "room_type", "price", "number_of_reviews", "last_review")print(summarytools::dfSummary(airbnb, varnumbers =FALSE, plain.ascii =FALSE, style ="grid", graph.magnif =0.70, valid.col =FALSE), method ='render', table.classes ='table-condensed')``````{r}airbnb <- airbnb %>%drop_na()```## Time Dependent Visualization```{r}airbnb %>%ggplot(aes(last_review, fill = neighbourhood_group)) +geom_density(alpha =0.9, adjust =5) +facet_wrap(vars(neighbourhood_group)) +theme_minimal() +labs(title ="Last Review dates of different neighbourhood groups")``````{r}airbnb %>%ggplot(aes(last_review, fill = room_type)) +geom_density(alpha=0.9) +facet_wrap(vars(room_type)) +theme_minimal() +labs(title ="Last Review dates of different rooms")``````{r}airbnb %>%ggplot(aes(last_review, number_of_reviews)) +geom_line() +theme_minimal() +labs(title ="Last review date of AB_NYC_2019")```## Visualizing Part-Whole Relationships```{r}airbnb %>%ggplot(aes(last_review, price, color = room_type)) +geom_point(size = .5) +geom_line() +theme_minimal() +labs(title ="Price in differnt years according to room types")airbnb %>%ggplot(aes(last_review, price, color = neighbourhood_group)) +geom_point(size = .5) +geom_line() +theme_minimal() +labs(title ="Price in different years according to neighbourhood groups") ``````{r}airbnb %>%ggplot(aes(room_type, price, color = room_type)) +geom_point() +theme_minimal() +facet_wrap(vars(neighbourhood_group)) +theme(axis.text.x =element_text(angle =90,hjust =1)) +labs(title ="Price in different rooms according to neighbourhood groups")```