library(tidyverse)
library(ggplot2)
library(lubridate)
knitr::opts_chunk$set(echo = TRUE, warning=FALSE, message=FALSE)Challenge 8
challenge_8
FAO
Joining Data
Read in data
birds<-read_csv("_data/birds.csv", col_names = c("Domain_Code", "Domain", "Area_Code", "Area", "Element_Code","Element", "Item_Code","Item", "Year_Code", "Year","Unit", "Value", "Flag", "Flag_Description" ), skip=1)%>%
select(-c("Year_Code"))
birdslivestock <- read_csv("_data/FAOSTAT_livestock.csv", col_names = c("Domain_Code", "Domain", "Area_Code", "Area", "Element_Code","Element", "Item_Code","Item", "Year_Code", "Year","Unit", "Value", "Flag", "Flag_Description" ), skip=1) %>%
select(-c("Year_Code"))
livestockc_groups <- read_csv("_data/FAOSTAT_country_groups.csv",col_names = c("Country_Group_Code","Country_Group","Country_Code", "Country", "M49_Code", "ISO2_Code", "ISO3_Code"), skip=1)
c_groupsc_groups %>%
count(Country_Group_Code,Country_Code) %>%
filter(n > 1)My final filter is what I think the Primary key is for c_groups.
Join pt1
b_sum <-birds %>%
group_by(Item)%>%
summarise(avg_stocks = mean(Value, na.rm=TRUE),
med_stocks = median(Value, na.rm=TRUE),
n_missing = sum(is.na(Value)))
l_sum <-livestock %>%
group_by(Item)%>%
summarise(avg_stocks = mean(Value, na.rm=TRUE),
med_stocks = median(Value, na.rm=TRUE),
n_missing = sum(is.na(Value)))
b_suml_sumitem_sum <- full_join(b_sum,l_sum)
item_sumggplot(item_sum, aes(x=Item, y=avg_stocks))+
geom_bar(stat="identity") +
coord_flip() +
geom_text(aes(label = round(avg_stocks), color = "red"), size=3, hjust=.6) +
theme(legend.position = "none")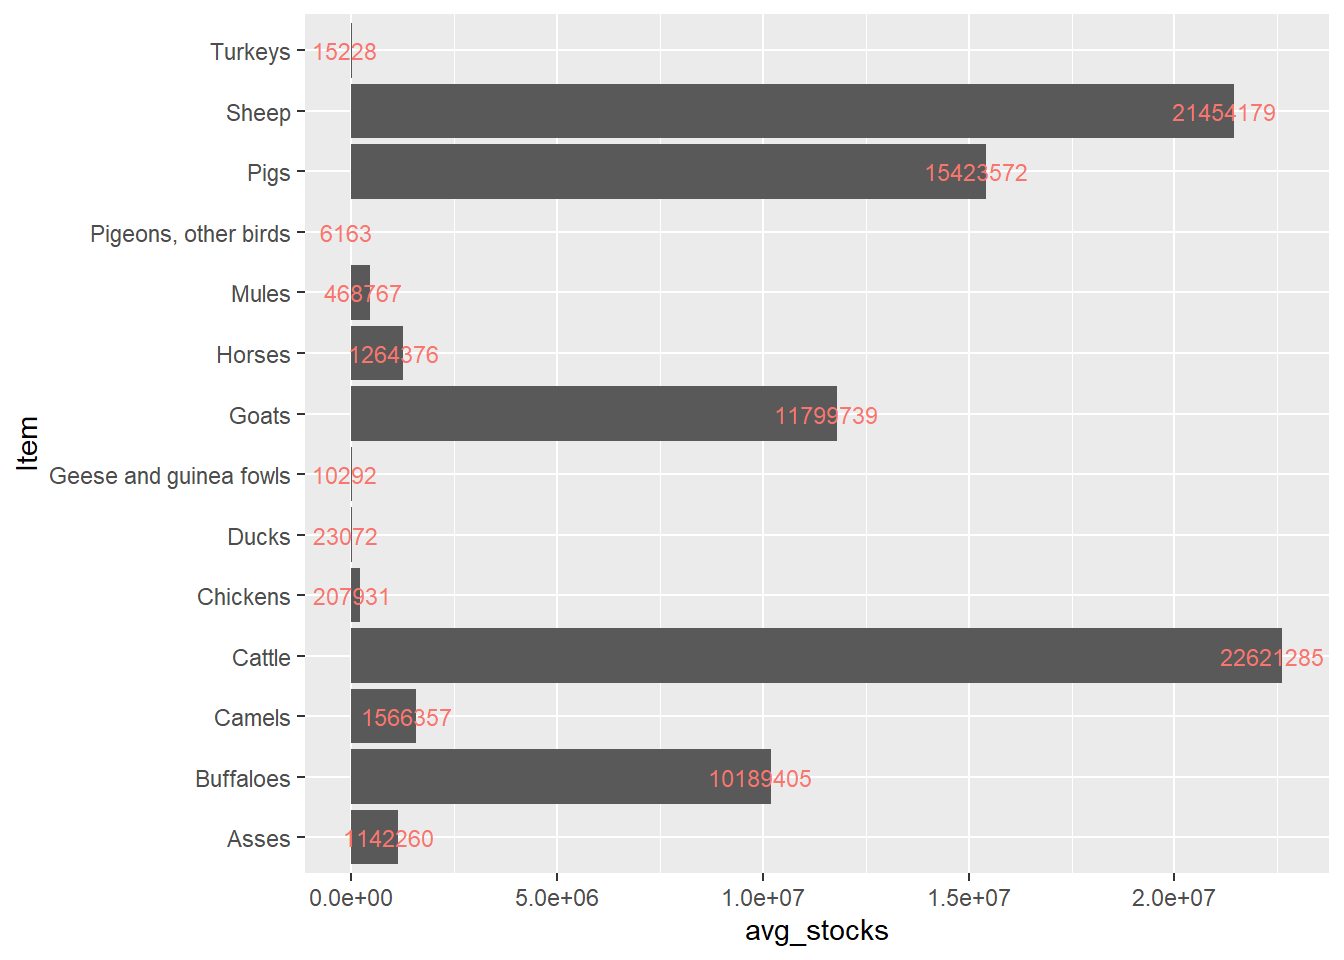
Here I summarized the Birds and Livestock stocks and joined them into one table. I then created a Bar graph showing the average amount of stock for all animals.
livestock %>%
count(Area_Code,Item, Year) %>%
filter(n > 1)livestock_new <- livestock %>%
mutate(index = row_number()) %>%
select(index, everything())
c_groups_new <- c_groups %>%
mutate(index = row_number()) %>%
select(index, everything())
livestock_newc_groups_newThe First filter represents the possible primary key for livestock. I created a Index for livestock and c_groups so that I could join them together.
Join pt2
livestock %>%
full_join(birds)livestock_new %>%
inner_join(c_groups_new)