library(tidyverse)
library(ggplot2)
library(lubridate)

knitr::opts_chunk$set(echo = TRUE, warning=FALSE, message=FALSE)
Challenge 8
challenge_8
snl
Joining Data
Challenge Overview
Today’s challenge is to:
- read in multiple data sets, and describe the data set using both words and any supporting information (e.g., tables, etc)
- tidy data (as needed, including sanity checks)
- mutate variables as needed (including sanity checks)
- join two or more data sets and analyze some aspect of the joined data
(be sure to only include the category tags for the data you use!)
Read in data
Read in one (or more) of the following datasets, using the correct R package and command.
- snl ⭐⭐⭐⭐⭐
snl_actor <- read.csv("_data/snl_actors.csv")
snl_actor
snl_cast <- read_csv("_data/snl_casts.csv")
snl_castBriefly describe the data
#dimensions for snl actor
dim(snl_actor)
[1] 2306 4#column names for snl actor
colnames(snl_actor)[1] "aid" "url" "type" "gender"#dimensions for snl cast
dim(snl_cast)[1] 614 8#column names for snl actor
colnames(snl_cast)[1] "aid" "sid" "featured" "first_epid"
[5] "last_epid" "update_anchor" "n_episodes" "season_fraction"These two data sets provide information about members of the the NBC show: Saturday Night Live. SNL_actor data set consists of 4 columns and 2,306 entries, and SNL_cast consists of 8 columns and 614 entries. The names of all columns for both data sets are included above.
Tidy Data (as needed)
#check for missing values
anyNA(snl_actor, recursive = TRUE)
[1] FALSEanyNA(snl_cast, recursive = TRUE)[1] TRUEThere are no missing values in snl_actor, but there missing values in snl_cast.
#change date column
snl_cast <- snl_cast %>%
  mutate(across(c(first_epid, last_epid), ymd))
head(snl_cast)
Ymd function applied to convert current date format to include dashes so that it’s easier to read.
#removing url column
snl_actor <- snl_actor %>%
  select(-url)
Removed url column as it provides the same information as the following column, type, provides and to make the data set tidier. The total number of columns reduced from 4 to now 3.
Join Data
#joining two data sets using left_join command
snl <- inner_join(snl_actor, snl_cast)
head(snl)
Used inner join command to join both datasets. This command removed non-matching rows from the two data sets, creating a new data set with 10 variables and 614 entries. We can observe the new data set removed all guests, and combined the names column.
  ggplot(snl, aes(x= `aid`, fill = `sid`)) +
  geom_bar(position = "dodge") +
  labs(title= "Cast member participation by seasons", x= "Cast", y= "Count")+
  theme_minimal()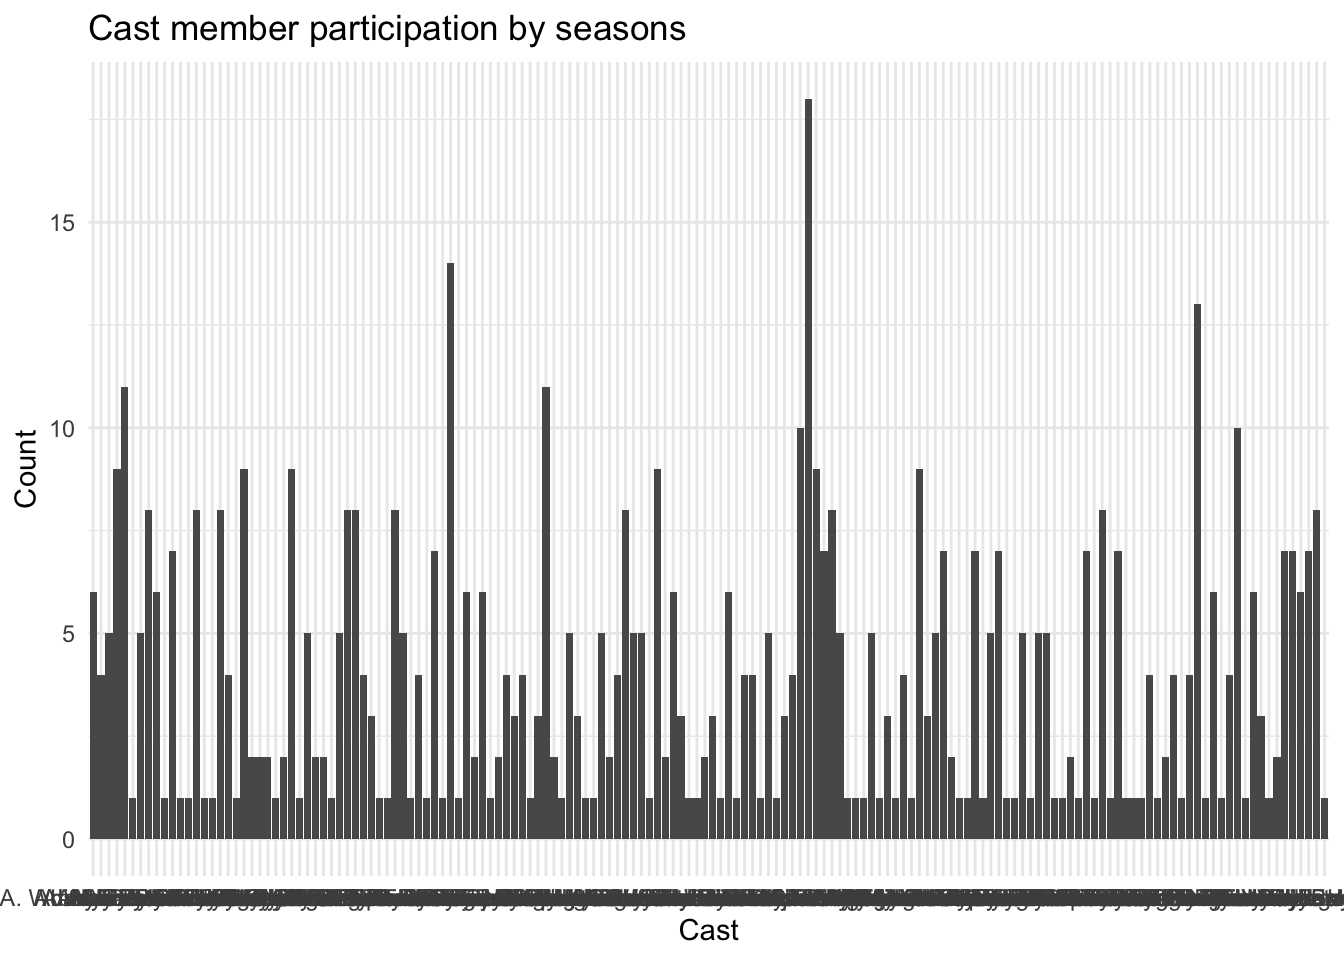
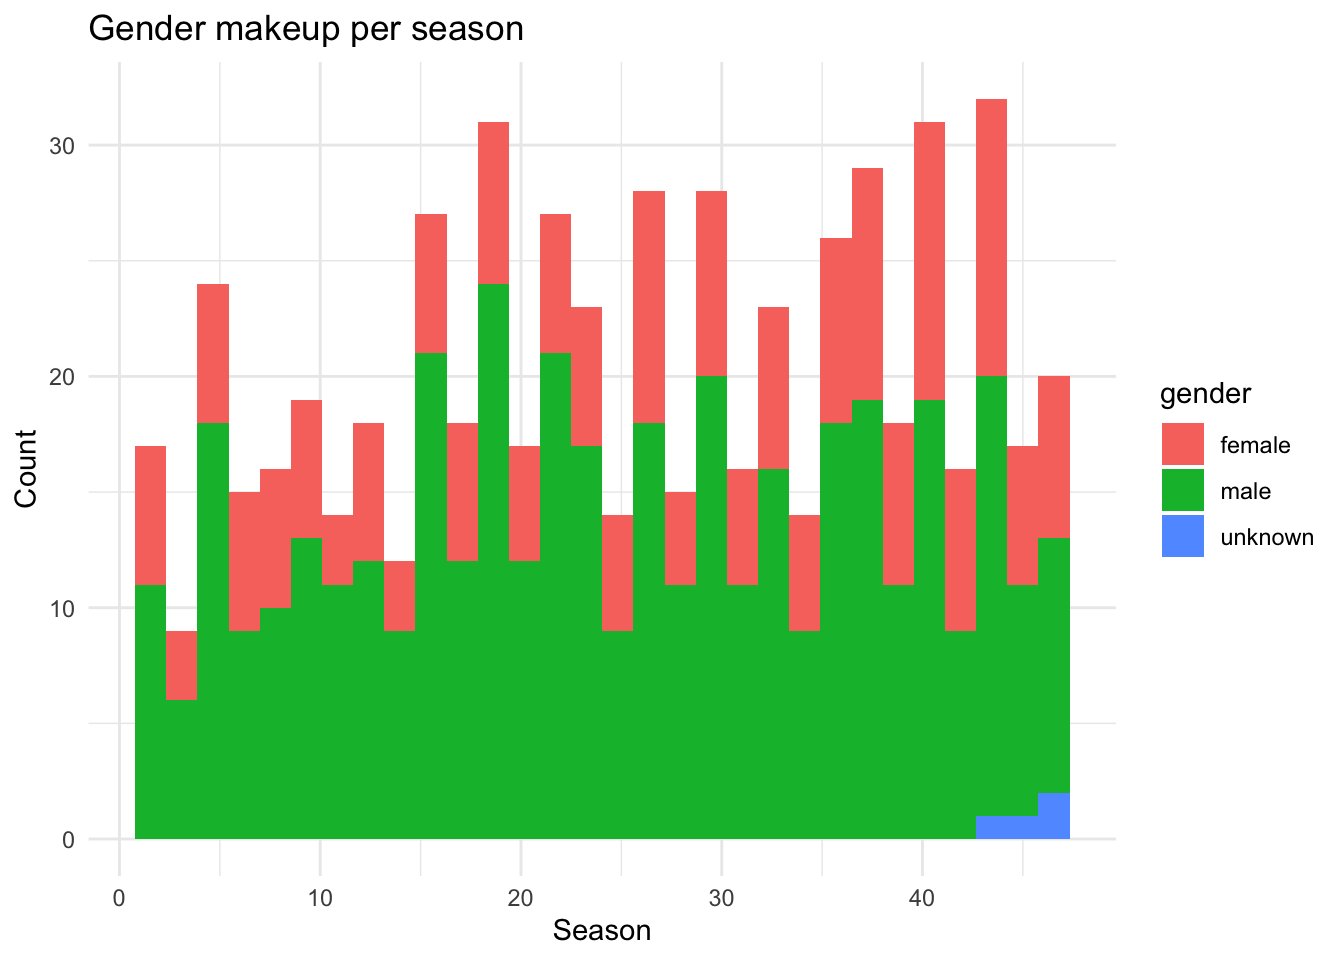
snl %>%
  ggplot(aes (sid, fill= gender)) +
  geom_histogram() +
  labs(title= "Gender makeup per season", x= "Season", y= "Count") +
  theme_minimal()