library(tidyverse)
library(ggplot2)

knitr::opts_chunk$set(echo = TRUE, warning=FALSE, message=FALSE)
Challenge 9 Submission
challenge_9
Creating a function
Challenge
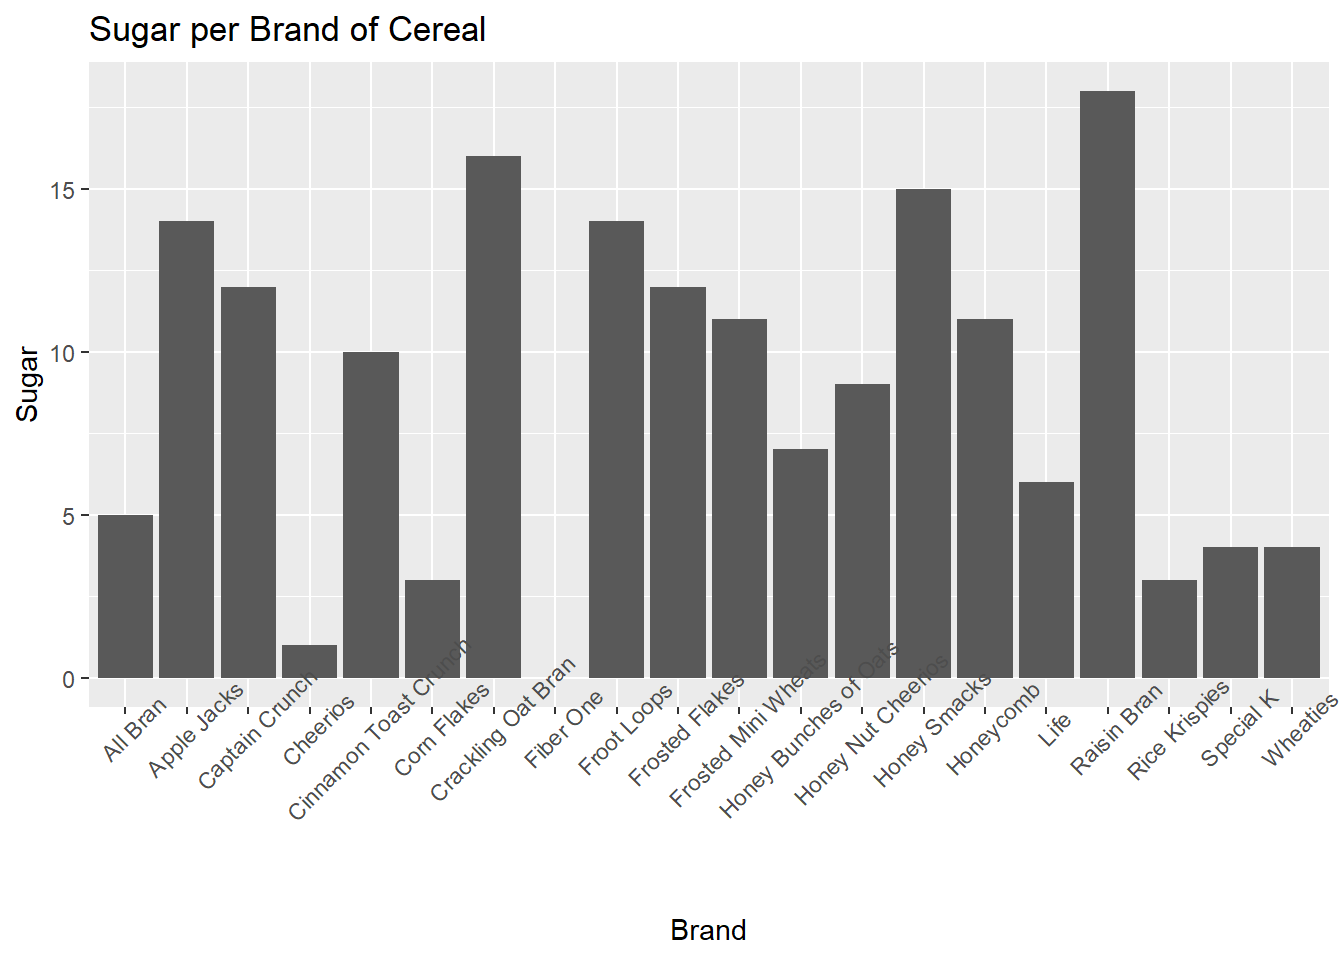
For Challenge 9, I created a function that would take in two variables from a data frame and create a histogram from it.
I have also added an example on how to use it.
plot_histogram <- function(df, varx, vary, title, xlabel, ylabel) {
  df %>%
    ggplot(aes(x={{varx}}, y={{vary}})) +
    geom_histogram(stat='identity') +
    theme(axis.text.x = element_text(angle = 45)) +
    ggtitle(title) +
    labs(y = ylabel, x = xlabel)
}

cereal_tidy = read_csv("_data/cereal.csv")
cereal_tidy
# A tibble: 20 × 4
Cereal Sodium Sugar Type
<chr> <dbl> <dbl> <chr>
1 Frosted Mini Wheats 0 11 A
2 Raisin Bran 340 18 A
3 All Bran 70 5 A
4 Apple Jacks 140 14 C
5 Captain Crunch 200 12 C
6 Cheerios 180 1 C
7 Cinnamon Toast Crunch 210 10 C
8 Crackling Oat Bran 150 16 A
9 Fiber One 100 0 A
10 Frosted Flakes 130 12 C
11 Froot Loops 140 14 C
12 Honey Bunches of Oats 180 7 A
13 Honey Nut Cheerios 190 9 C
14 Life 160 6 C
15 Rice Krispies 290 3 C
16 Honey Smacks 50 15 A
17 Special K 220 4 A
18 Wheaties 180 4 A
19 Corn Flakes 200 3 A
20 Honeycomb 210 11 C plot_histogram(cereal_tidy, Cereal, Sugar, 'Sugar per Brand of Cereal', 'Brand', 'Sugar')