library(tidyverse)
library(ggplot2)

knitr::opts_chunk$set(echo = TRUE, warning=FALSE, message=FALSE)
Challenge 9
challenge_9
Creating a function
Challenge Overview
Today’s challenge is simple. Create a function, and use it to perform a data analysis / cleaning / visualization task:
Examples of such functions are: 1) A function that reads in and cleans a dataset.
2) A function that computes summary statistics (e.g., computes the z score for a variable).
3) A function that plots a histogram.
That’s it!
clean_data
clean_data <- function(file_path, drop_columns = NULL) {
  # Read the CSV file
  data <- read_csv(file_path)

  # Drop rows with NA values in the 'children' column
  data$children[is.na(data$children)] <- 0

  # Combine year, month, and day of month into a single date column and then remove the original columns related to date
  data <- data %>%
    mutate(arrival_date = as.Date(paste(arrival_date_year, arrival_date_month, arrival_date_day_of_month, sep = "-"), format = "%Y-%B-%d")) %>%
    select(-arrival_date_year, -arrival_date_month, -arrival_date_week_number, -arrival_date_day_of_month)

  # Convert the variables 'is_canceled' and 'is_repeated_guest' to logical (boolean) values
  data <- data %>%
    mutate(is_canceled = as.logical(is_canceled), is_repeated_guest = as.logical(is_repeated_guest))

  # Convert categorical variables into factors
  cat_cols <- c('hotel', 'meal', 'country', 'market_segment', 'distribution_channel', 'reserved_room_type',
                'assigned_room_type', 'deposit_type', 'customer_type', 'reservation_status')
  data[cat_cols] <- lapply(data[cat_cols], factor)

  # Drop specified columns if provided
  if (!is.null(drop_columns)) {
    data <- data %>% select(-all_of(drop_columns))
  }

  return(data)
}

# Use the function to read and clean the data
hotel_bookings <- clean_data("_data/hotel_bookings.csv", drop_columns = "reservation_status_date")
head(hotel_bookings)
This script defines a function clean_data for loading and preprocessing a dataset from a CSV file. The function takes as input the file path and a vector of column names to drop. It then reads the file, fills missing values in the ‘children’ column, combines date-related columns into one, converts certain columns to logical type, and transforms categorical variables into factors. If specified, it also drops certain columns. The cleaned data is then returned. The script applies this function to the ‘hotel_bookings.csv’ file and displays the first few rows of the cleaned data.
calculate_z_score
calculate_z_score <- function(data, column_name) {
  # Check if the column is numeric
  if (!is.numeric(data[[column_name]])) {
    message(paste0("The column '", column_name, "' is not numeric. Please choose a numeric column."))
    return(data)  # return the original data frame without changes
  }

  # Calculate the mean of the column
  mean_value <- mean(data[[column_name]], na.rm = TRUE)

  # Calculate the standard deviation of the column
  sd_value <- sd(data[[column_name]], na.rm = TRUE)

  # Calculate the z scores
  z_scores <- (data[[column_name]] - mean_value) / sd_value

  # Create a new data frame with the z scores
  data_z_scores <- data %>%
    select(!!column_name) %>%  # select the column for which z score is calculated
    mutate(!!paste0(column_name, "_z_score") := z_scores)  # add the z scores as a new column

  return(data_z_scores)
}
lead_time_z_scores <- calculate_z_score(hotel_bookings, "lead_time")
lead_time_z_scores
hotel_bookings <- calculate_z_score(hotel_bookings, "hotel")This script defines a function named calculate_z_score that calculates the z-score of a numeric column in a data frame. The function takes as input a data frame and a column name. It first checks if the column is numeric. If not, it prints a message and returns the original data frame without changes. If the column is numeric, it calculates the mean and standard deviation of the column, and then calculates the z-scores. It then creates a new data frame containing the original column and a new column with the z-scores.
The script then applies this function to the ‘lead_time’ column of the ‘hotel_bookings’ data frame and assigns the resulting data frame to ‘lead_time_z_scores’.
Lastly, the script tries to apply the calculate_z_score function to the ‘hotel’ column of the ‘hotel_bookings’ data frame. However, as ‘hotel’ is not a numeric column, the function will print a message stating “The column ‘hotel’ is not numeric. Please choose a numeric column.” and will return the original ‘hotel_bookings’ data frame without changes.
plot_histogram
plot_histogram <- function(data, column_name) {
  # Check if the column is numeric
  if (!is.numeric(data[[column_name]])) {
    message(paste0("The column '", column_name, "' is not numeric. Please choose a numeric column."))
    return(NULL)  # return NULL because a histogram can't be plotted for non-numeric data
  }

  # Create a histogram of the column
  plot <- ggplot(data, aes_string(column_name)) +
    geom_histogram(binwidth = 30, fill = "#69b3a2", color = "#e9ecef", alpha = 0.9) +  # change binwidth as needed
    theme_minimal() +
    labs(title = paste0("Histogram of ", column_name),
         x = column_name,
         y = "Count")

  return(plot)
}
plot_histogram(hotel_bookings, "lead_time")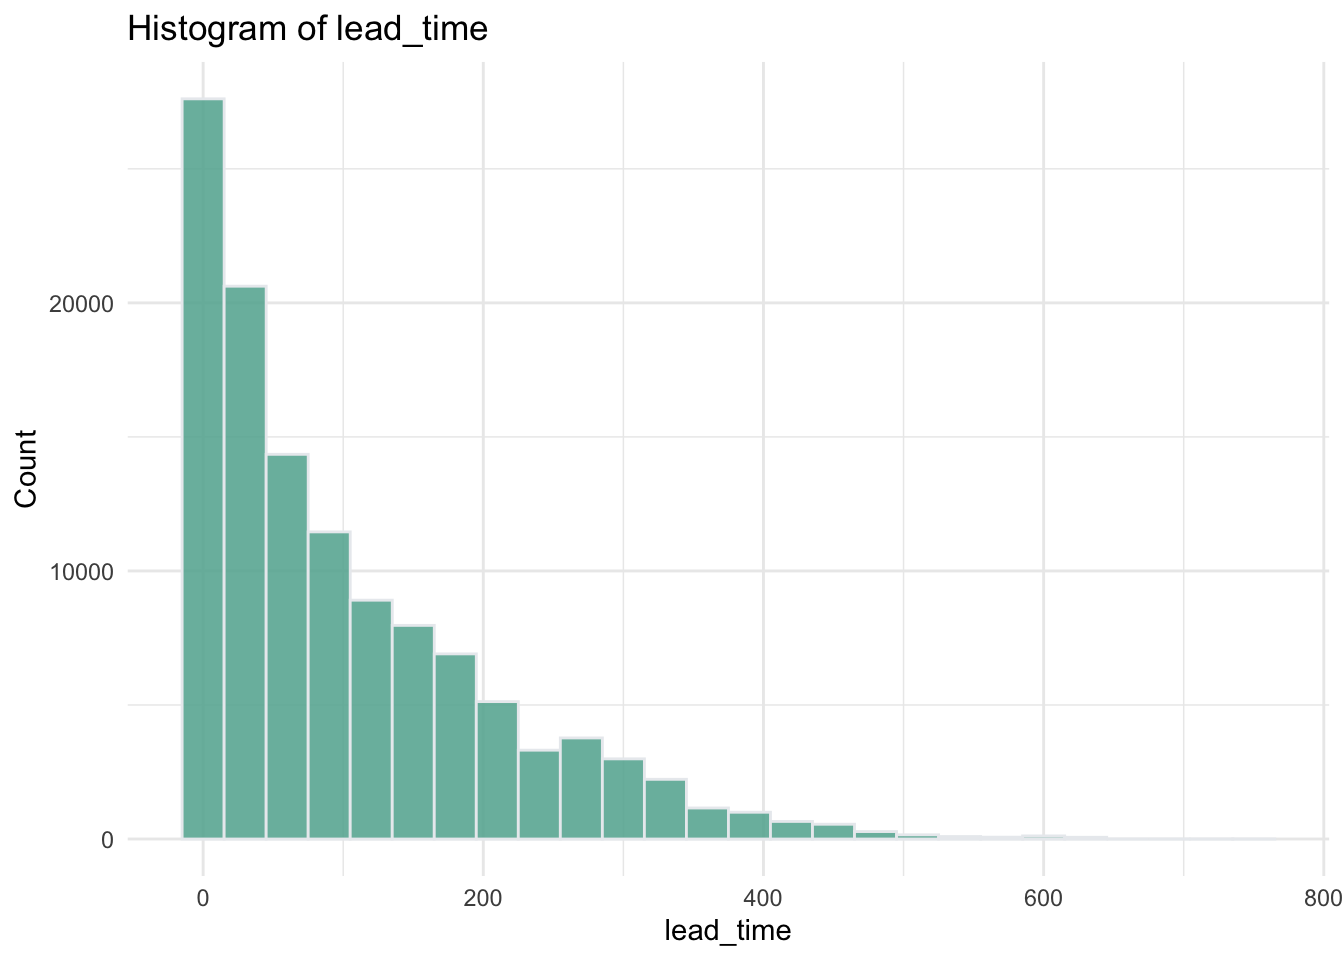
This code defines plot_histogram, a function that generates a histogram for a given numeric column from a data frame. If the column isn’t numeric, a message is returned indicating the need for numeric data. The histogram visualizes data distribution and uses ggplot2’s geom_histogram function with specified aesthetics. The final plot is returned by the function. In the end, the function is used to create a histogram for the ‘lead_time’ column of the ‘hotel_bookings’ data frame.