Code
library(tidyverse)

knitr::opts_chunk$set(echo = TRUE, warning=FALSE, message=FALSE)library(tidyverse)
knitr::opts_chunk$set(echo = TRUE, warning=FALSE, message=FALSE)Today’s challenge is to
read in a dataset, and
describe the dataset using both words and any supporting information (e.g., tables, etc)
Read in one (or more) of the following data sets, using the correct R package and command.
Find the _data folder, located inside the posts folder. Then you can read in the data, using either one of the readr standard tidy read commands, or a specialized package such as readxl.
bird_data <- read.csv("_data/birds.csv")
str(bird_data) # To examine the structure of the bird_data object.
'data.frame': 30977 obs. of 14 variables:
$ Domain.Code : chr "QA" "QA" "QA" "QA" ...
$ Domain : chr "Live Animals" "Live Animals" "Live Animals" "Live Animals" ...
$ Area.Code : int 2 2 2 2 2 2 2 2 2 2 ...
$ Area : chr "Afghanistan" "Afghanistan" "Afghanistan" "Afghanistan" ...
$ Element.Code : int 5112 5112 5112 5112 5112 5112 5112 5112 5112 5112 ...
$ Element : chr "Stocks" "Stocks" "Stocks" "Stocks" ...
$ Item.Code : int 1057 1057 1057 1057 1057 1057 1057 1057 1057 1057 ...
$ Item : chr "Chickens" "Chickens" "Chickens" "Chickens" ...
$ Year.Code : int 1961 1962 1963 1964 1965 1966 1967 1968 1969 1970 ...
$ Year : int 1961 1962 1963 1964 1965 1966 1967 1968 1969 1970 ...
$ Unit : chr "1000 Head" "1000 Head" "1000 Head" "1000 Head" ...
$ Value : int 4700 4900 5000 5300 5500 5800 6600 6290 6300 6000 ...
$ Flag : chr "F" "F" "F" "F" ...
$ Flag.Description: chr "FAO estimate" "FAO estimate" "FAO estimate" "FAO estimate" ...# Convert variables with character to factor format to get insights about data.
bird_data <- bird_data %>% mutate(Domain.Code = factor(Domain.Code),
Domain = factor(Domain),
Area = factor(Area),
Element = factor(Element),
Item = factor(Item),
Unit = factor(Unit),
Flag = factor(Flag),
Flag.Description = factor(Flag.Description))Add any comments or documentation as needed. More challenging data sets may require additional code chunks and documentation.
Using a combination of words and results of R commands, can you provide a high level description of the data? Describe as efficiently as possible where/how the data was (likely) gathered, indicate the cases and variables (both the interpretation and any details you deem useful to the reader to fully understand your chosen data).
The birds data set has 30977 observations and each observation has 14 data points recorded. The variables recorded are Domain.Code, Domain, Area.Code, Area, Element.Code, Element, Item.Code, Item, Year.Code, Year, Unit, Value, Flag, Flag.Description. The below table shows a brief summary of each variable in the data set. For a quantitative variable, descriptive statistics are shown. Whereas, counts for unique values a variable can take are shown for categorical variables.
summary(bird_data) Domain.Code Domain Area.Code Area
QA:30977 Live Animals:30977 Min. : 1 Africa : 290
1st Qu.: 79 Asia : 290
Median : 156 Eastern Asia: 290
Mean :1202 Egypt : 290
3rd Qu.: 231 Europe : 290
Max. :5504 France : 290
(Other) :29237
Element.Code Element Item.Code Item
Min. :5112 Stocks:30977 Min. :1057 Chickens :13074
1st Qu.:5112 1st Qu.:1057 Ducks : 6909
Median :5112 Median :1068 Geese and guinea fowls: 4136
Mean :5112 Mean :1066 Pigeons, other birds : 1165
3rd Qu.:5112 3rd Qu.:1072 Turkeys : 5693
Max. :5112 Max. :1083
Year.Code Year Unit Value Flag
Min. :1961 Min. :1961 1000 Head:30977 Min. : 0 :10773
1st Qu.:1976 1st Qu.:1976 1st Qu.: 171 * : 1494
Median :1992 Median :1992 Median : 1800 A : 6488
Mean :1991 Mean :1991 Mean : 99411 F :10007
3rd Qu.:2005 3rd Qu.:2005 3rd Qu.: 15404 Im: 1213
Max. :2018 Max. :2018 Max. :23707134 M : 1002
NA's :1036
Flag.Description
Aggregate, may include official, semi-official, estimated or calculated data: 6488
Data not available : 1002
FAO data based on imputation methodology : 1213
FAO estimate :10007
Official data :10773
Unofficial figure : 1494
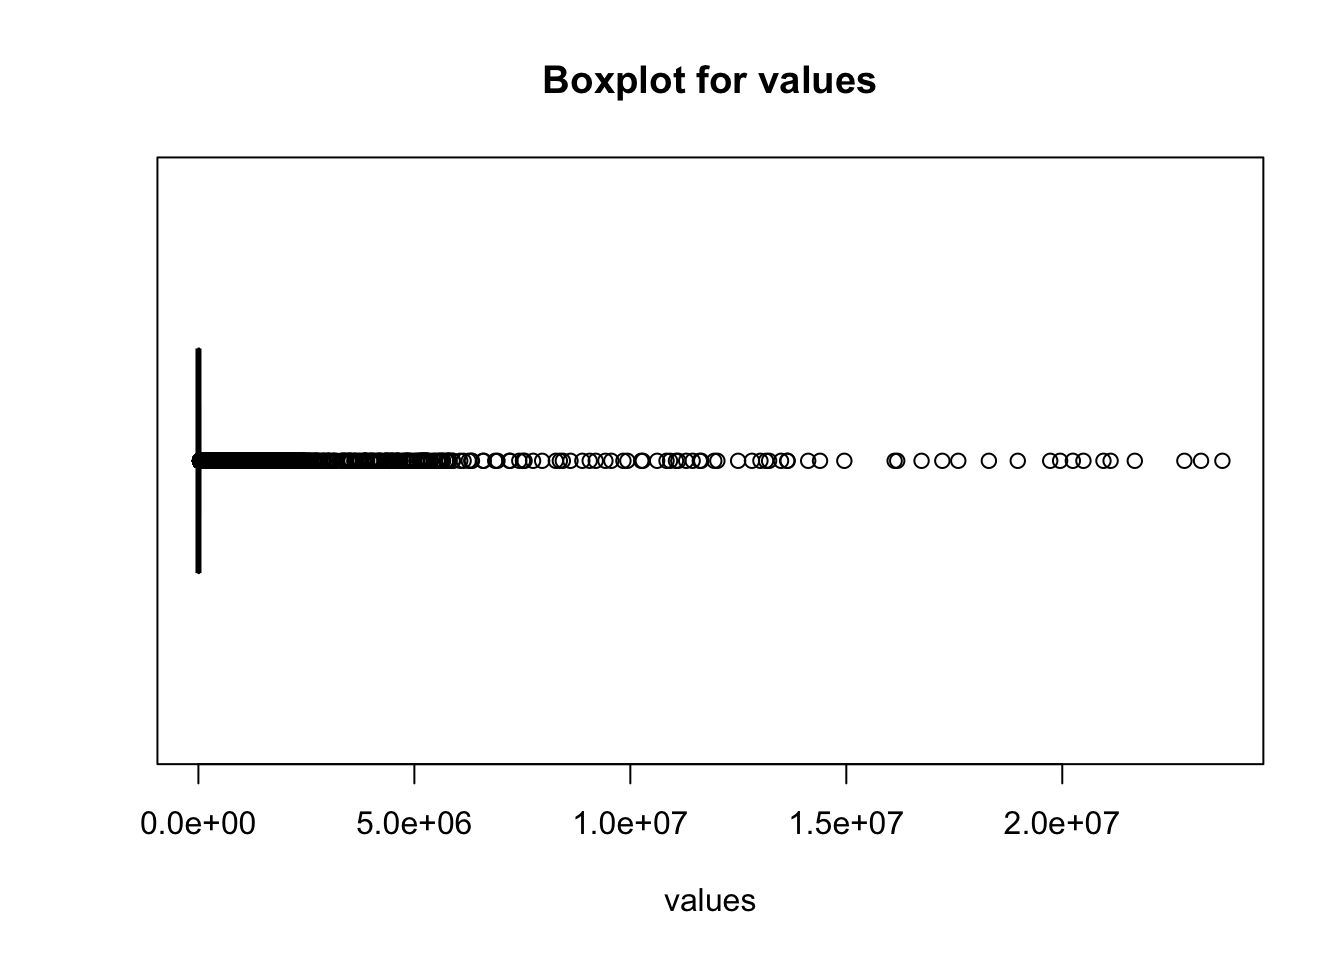
Various types of birds like Chickens, Ducks, Geese and guinea fowls, Turkeys, Pigeons, other birds are considered in this data sample. This data set contains the collection source for each observation. These sources are FAO estimate, Official data, FAO data based on imputation methodology, Data not available, Unofficial figure, Aggregate, may include official, semi-official, estimated or calculated data. Below are pie chart and boxplot for variables Item and Value respectively.
pie(summary(bird_data$Item), col=rainbow(length(summary(bird_data$Item))), main="Types of Birds")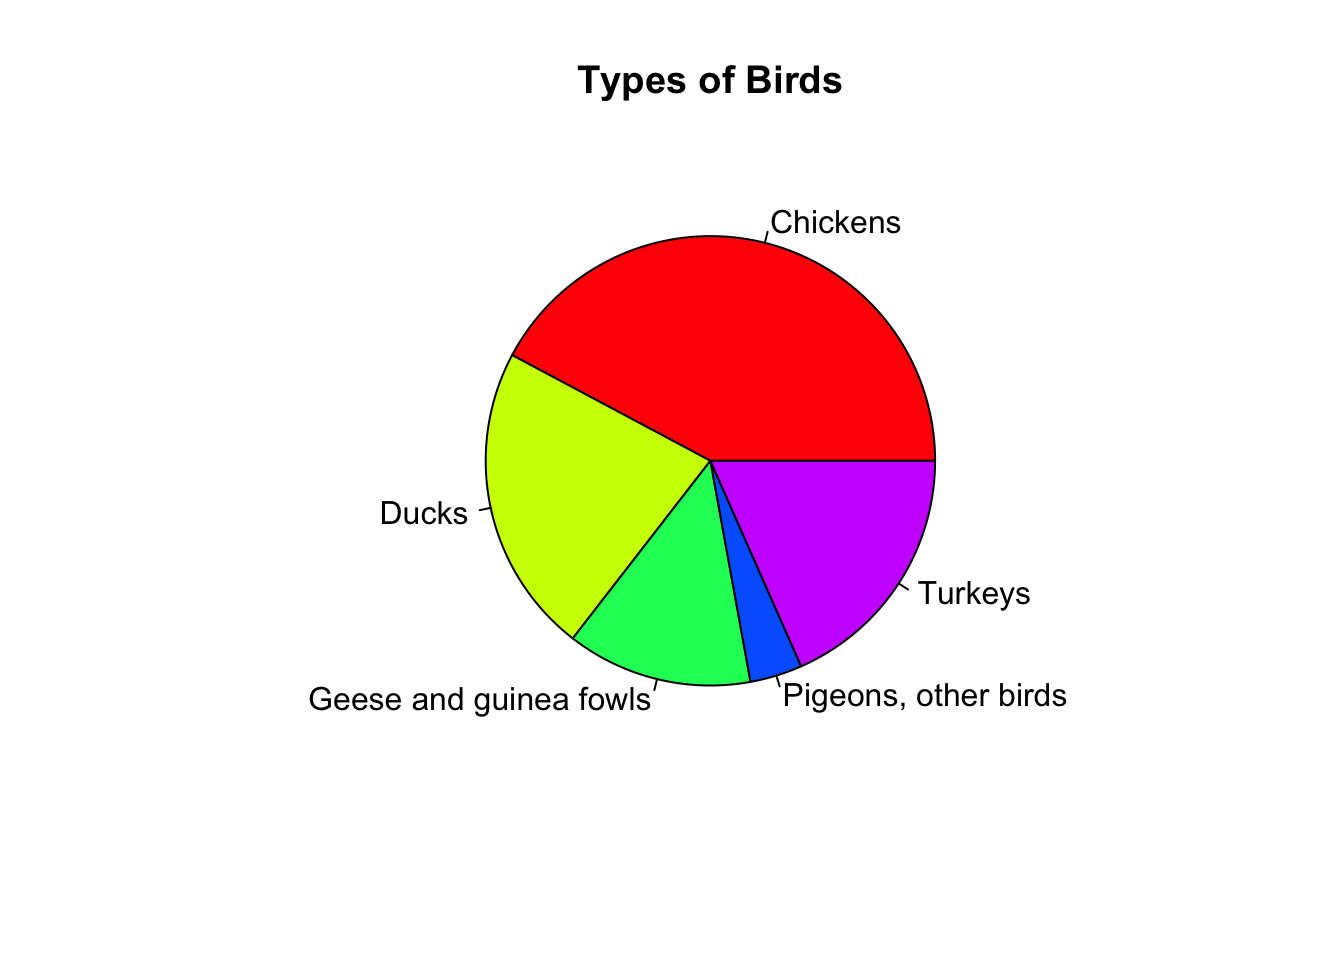
boxplot(bird_data$Value, horizontal=TRUE, main = "Boxplot for values", xlab = "values")