library(tidyverse)
library(ggplot2)

knitr::opts_chunk$set(echo = TRUE, warning=FALSE, message=FALSE)Challenge 7 Solution - Susannah
challenge_7
hotel_bookings
Susannah Reed Poland
Visualizing Multiple Dimensions
Goals for this assignment
This will be my first time working with the Hotel Bookings dataset (a step up from my usual one-star choice) and, while I have added the dimension of color and polished labels and titles, I have not fully realized a “publication-ready” plot. These, therefore, are my goals for this assignment.
The Hotel Booking Demand dataset contains booking information for a city hotel and a resort hotel. It includes information such as the date that a particular reservation was made, the length of stay for that reservation, the number of guests (subdivided by age group eg. adult, child), meals included in the reservation, room type, whether or not they reserved a parking space, etc.
In the original dataframe, each row represents a unique booking. Source: The data was dowloaded from Kaggle and is originally from the article Hotel Booking Demand Datasets, written by Nuno Antonio, Ana Almeida, and Luis Nunes for Data in Brief, Volume 22, February 2019.
Read in and tidy the Hotel_Bookings dataset
We will first read the hotel_bookings dataset and perform the following mutations:
#read in data
hotel_orig<-read_csv("_data/hotel_bookings.csv")
#look only at arrival dates
hotel_orig%>%
  select(starts_with("arrival"))
The arrival dates are currently broken up across three columns and we will combine them into a single column that R can read as a date. To do this, we will use the str_c() argument that combines multiple character vectors in to a single character vector. This character vector can then be transformed into a date using the dmy() from the lubridate package.
hotel_tidy<-hotel_orig%>%
#create a single new column, "date_arrival" that combines the the day, month, and year numbers for each arrival date. Then tell R to read that as a date.
  mutate(date_arrival = str_c(arrival_date_day_of_month, arrival_date_month, arrival_date_year, sep="/"), date_arrival = dmy(date_arrival))%>%
#remove the old disaggregated "arrival" columns
  select(-starts_with("arrival"))
The date of arrival is now in a “date” format, as we can see in the sampling below:
select(hotel_tidy, date_arrival)%>%
  head()
Number of hotel bookings over time, City vs. Resort hotel
Create a new dataframe with a column that contains the number of bookings each month for each type of hotel.
n_bookings_month <- hotel_tidy%>%
#create new column, "month", which rounds the date of arrival down to the nearest boundary of the month (designated unit)
  mutate(start_month=floor_date(date_arrival,unit="month"))%>%
#group by the month and the hotel
  group_by(start_month, hotel)%>%
#count number in each group, then ungroup
  summarize(n=n())%>%
  ungroup()
Here is the new tibble:
n_bookings_month%>%
  head()
Here is a visualisaton of the number of hotel bookings each month over time, separated by type of hotel. This allows us to compare the rates of bookings of City and Resort hotels.
n_bookings_month%>%
  ggplot(aes(start_month,n,col=hotel))+geom_line()+scale_x_date(NULL, date_labels = "%b %y",breaks="3 months") + scale_y_continuous(limits=c(0,5000))+theme(axis.text.x=element_text(angle=90))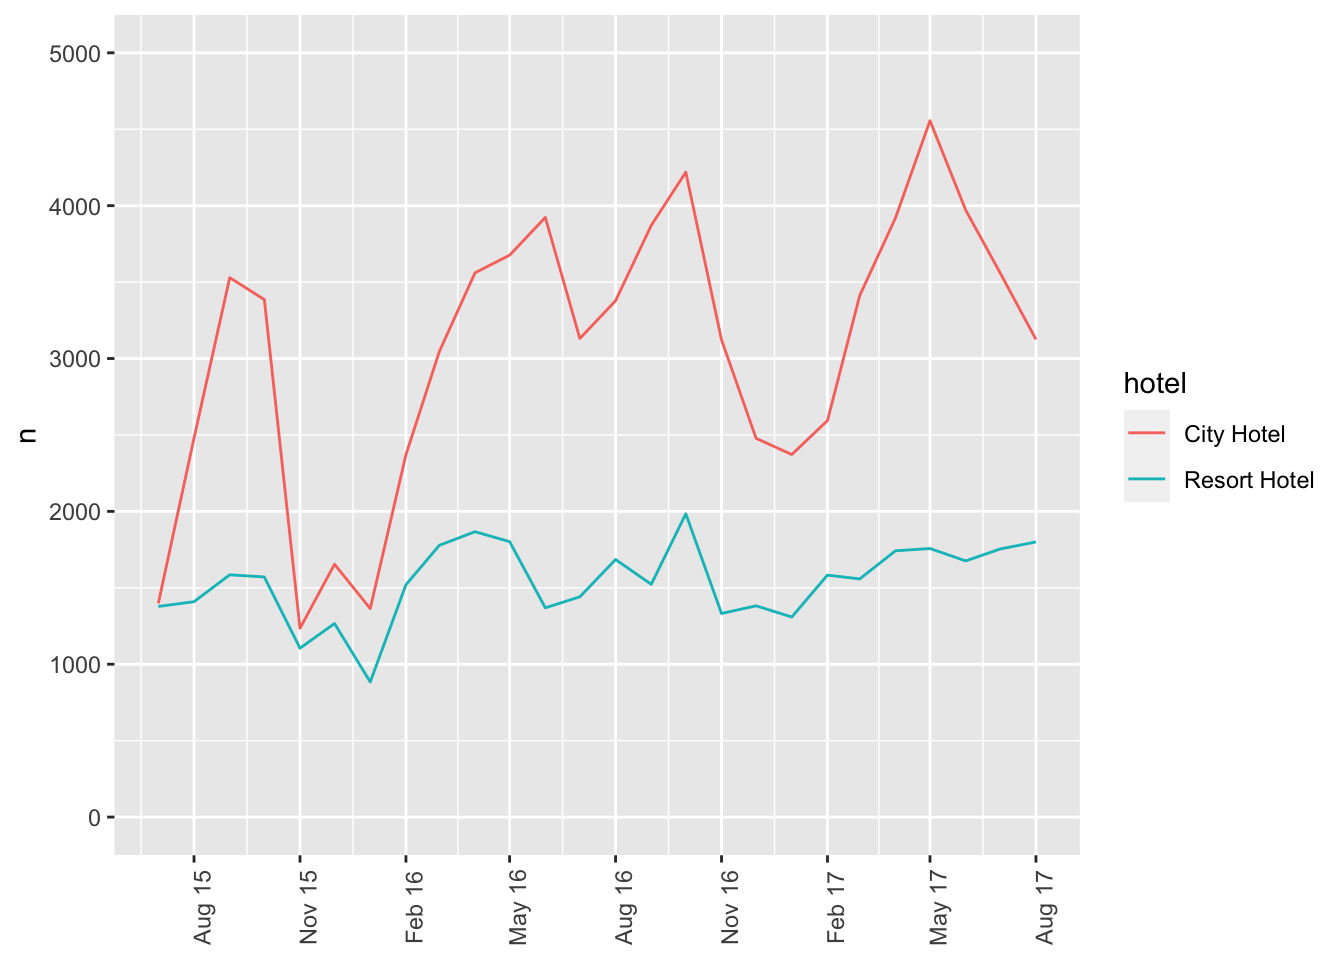
QUESTION: How do I change the start of of the X axis so that the months begin at the start of a quarter, and read the full year? I was hoping that the ticks could be formatted to read as the month at the start of each quarter, i.e. July 2015, October 2015, January 2016, and so on.
Add dimension: room type
According to the metadata on Kaggle, there are 10 unique room types (A-H, L, and P), and the exact descriptions are obscured for privacy reasons.
count(hotel_tidy, reserved_room_type)For the sake of this example, will recode the room type a hypothetical key for the codes (A-H, L, and P).
hotel_room<-hotel_tidy%>%
  mutate(month=floor_date(date_arrival,unit="month"),
         reserved_room_type=recode(reserved_room_type,
                     A="Single",
                     B="Double",
                     C="Queen",
                     D="King",
                     E="Two Singles",
                     F="Two Doubles",
                     G="Two Queens",
                     H="Two Kings",
                     L="Suite",
                     P="Deluxe Suite"
                     ),
         across(c(hotel, reserved_room_type),as.factor))
hotel_room
Now we can compute the number of room types for each hotel across time.
n_room_month_hotel<-hotel_room%>%
  count(month, hotel, reserved_room_type)
With this tibble, we can plot the number of rooms booked, separated by type, for each type of hotel.
ggplot(n_room_month_hotel,aes(month, n, col=reserved_room_type))+
  geom_path()+
  #split the visualization into 2 "subplots" based on the Hotel variable
  facet_wrap(vars(hotel))+
  scale_x_date()+
  theme(axis.text.x=element_text(angle=90))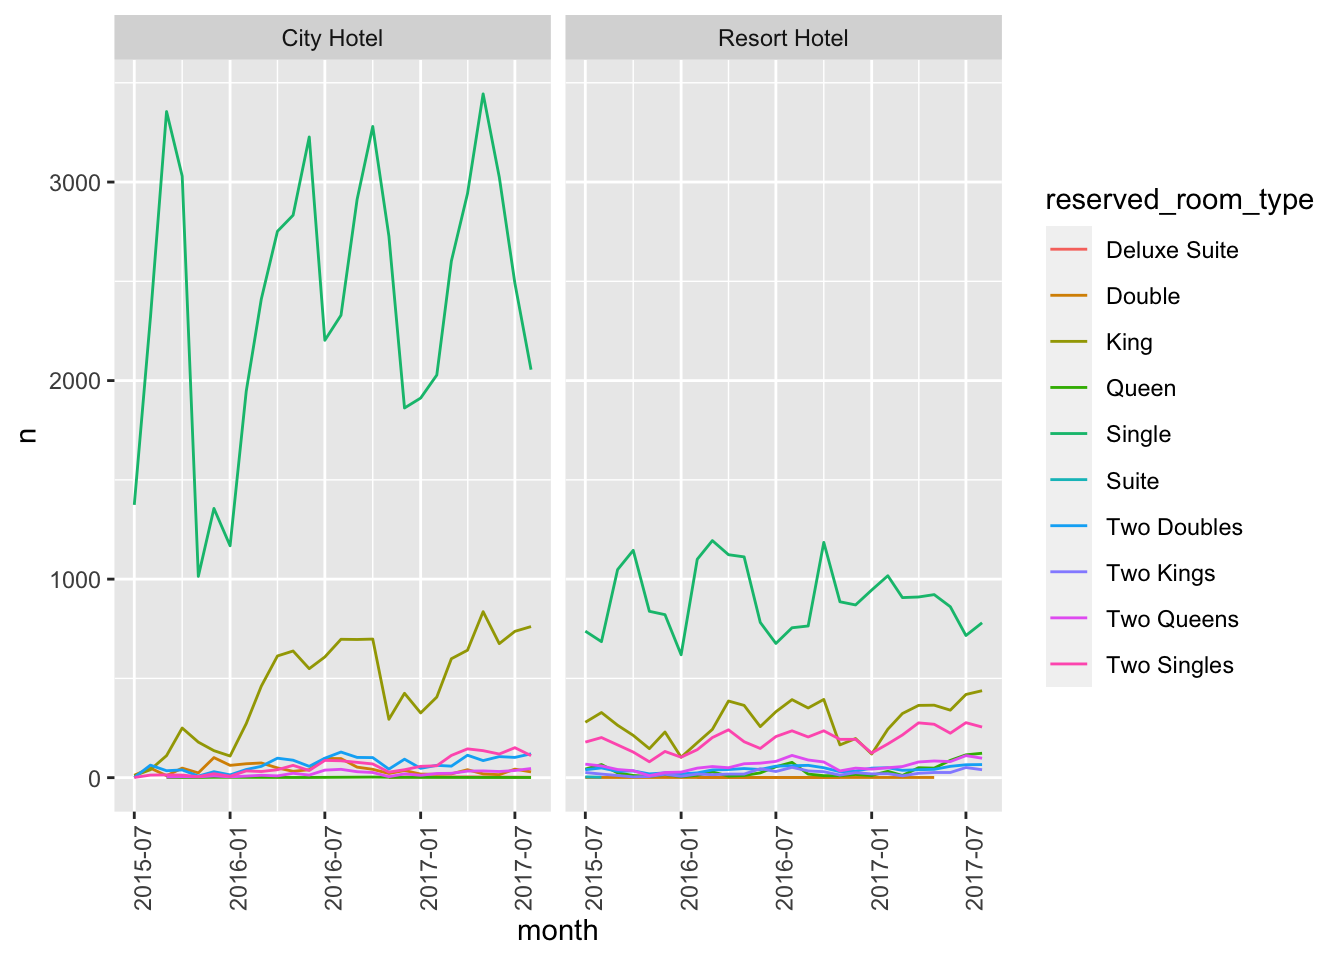
To make a “prettier” version, we can apply a theme to the plots. I am not yet sure how to use the ggthemes package, and familiarize myself with the ggthemes website using the supporting web resources.
However, to make these plots more readable, my first step would be to rename the X-axis tick marks. Ideally, as I mention above, and I would like to change the frequency of the tick marks, and the format of the dates. I will do some research on this as well!