library(tidyverse)
library(ggplot2)
library(dplyr)
library(readxl)
library(readr)
library(here)
library(purrr)

knitr::opts_chunk$set(echo = TRUE, warning=FALSE, message=FALSE)
Challenge 8 Instructions
challenge_8
military marriages
Joining Data
Challenge Overview
Today’s challenge is to:
- read in multiple data sets, and describe the data set using both words and any supporting information (e.g., tables, etc)
- tidy data (as needed, including sanity checks)
- mutate variables as needed (including sanity checks)
- join two or more data sets and analyze some aspect of the joined data
(be sure to only include the category tags for the data you use!)
Read in data
Read in one (or more) of the following datasets, using the correct R package and command.
- military marriages ⭐⭐
- faostat ⭐⭐
- railroads ⭐⭐⭐
- fed_rate ⭐⭐⭐
- debt ⭐⭐⭐
- us_hh ⭐⭐⭐⭐
- snl ⭐⭐⭐⭐⭐
MaritalStatus_untidy<-read_xls("_data/ActiveDuty_MaritalStatus.xls")
view(MaritalStatus_untidy)
Briefly describe the data
This data set specifies (in some complex terms) the marital and parental statuses of military personnel. Subcategories include pay grade, single with children, single without children, joint service marriage, civilian marriage. I notice that there is no overlap between these variables, and no individual could have multiple pay grades or both have and not have children.
There are several datasets with the same variables for different branches of the army.
Tidy Data (as needed)
#designating columns for the first sheet in the dataset, which will be applied to all of them after joining.

marital_status_cols <- c("delete", "payGrade_payLevel",
            "single_nokids_male", "single_nokids_female", "delete",
            "single_kids_male", "single_kids_female", "delete",
            "married_military_male", "married_military_female", "delete",
            "married_civilian_male", "married_civilian_female", "delete",
            rep("delete", 3))

read_excel(here("posts","_data","ActiveDuty_MaritalStatus.xls"),
           skip=8,
           col_names = marital_status_cols)
# A tibble: 31 × 17
delete...1 payGrade_payLevel single_nokids_male single_nokids_female
<chr> <chr> <chr> <chr>
1 <NA> Pay Grade Male Female
2 <NA> E-1 31229 5717
3 <NA> E-2 53094 8388
4 <NA> E-3 131091 21019
5 <NA> E-4 112710 16381
6 <NA> E-5 57989 11021
7 <NA> E-6 19125 4654
8 <NA> E-7 5446 1913
9 <NA> E-8 1009 438
10 <NA> E-9 381 202
# ℹ 21 more rows
# ℹ 13 more variables: delete...5 <chr>, single_kids_male <chr>,
# single_kids_female <chr>, delete...8 <chr>, married_military_male <chr>,
# married_military_female <chr>, delete...11 <chr>,
# married_civilian_male <chr>, married_civilian_female <chr>,
# delete...14 <chr>, delete...15 <chr>, delete...16 <chr>, delete...17 <chr>#deleting unneeded columns from the dataset
maritalstatus_newcol<-read_excel(here("posts","_data","ActiveDuty_MaritalStatus.xls"),
skip=9,
col_names = marital_status_cols
)%>%
select(!contains("delete"))%>%
filter(str_detect(payGrade_payLevel, "TOTAL", negate=TRUE))
maritalstatus_newcol# A tibble: 24 × 9
payGrade_payLevel single_nokids_male single_nokids_female single_kids_male
<chr> <dbl> <dbl> <dbl>
1 E-1 31229 5717 563
2 E-2 53094 8388 1457
3 E-3 131091 21019 4264
4 E-4 112710 16381 9491
5 E-5 57989 11021 10937
6 E-6 19125 4654 10369
7 E-7 5446 1913 6530
8 E-8 1009 438 1786
9 E-9 381 202 579
10 O-1 13495 3081 402
# ℹ 14 more rows
# ℹ 5 more variables: single_kids_female <dbl>, married_military_male <dbl>,
# married_military_female <dbl>, married_civilian_male <dbl>,
# married_civilian_female <dbl>Mutating the dataset for analysis.
#separating payGrade_payLevel and pivoting for tidiness
marital_tidy<-maritalstatus_newcol %>%
  separate(payGrade_payLevel,
           into = c("payGrade", "payLevel"),
           sep = "-") %>%
  pivot_longer(cols = contains(c("male", "female")),
                 names_to = c("Marriage_status", "Kids_or_Spouse_Status", "Gender"),
                 names_sep = "_",
                 values_to = "Count")

view(marital_tidy)
Join Data
I’m going to join by writing a function, which is necessary because I want the input to match the adjustments I made to the first sheet. The [-1] in the code when I run the function indicates to ignore the first sheet because its data is already accounted for.
excel_sheets(here("posts","_data","ActiveDuty_MaritalStatus.xls"))[1] "TotalDoD" "AirForce" "MarineCorps" "Navy" "Army" militaryreader<-function(sheet_name){
dat <- read_excel(here("posts","_data","ActiveDuty_MaritalStatus.xls"),
sheet = sheet_name,
skip = 9,
col_names = marital_status_cols) %>%
mutate("branch" = sheet_name) %>%
select(!contains("delete"))%>%
filter(str_detect(payGrade_payLevel, "TOTAL", negate=TRUE)) %>%
separate(payGrade_payLevel,
into = c("payGrade", "payLevel"),
sep = "-") %>%
pivot_longer(cols = contains(c("male", "female")),
names_to = c("Marriage_status", "Kids_or_Spouse_Status", "Gender"),
names_sep = "_",
values_to = "Count")
return(dat)}
enlisted_military_status<-map_dfr(excel_sheets(here("posts","_data","ActiveDuty_MaritalStatus.xls"))[-1], militaryreader)
head(enlisted_military_status)# A tibble: 6 × 7
payGrade payLevel branch Marriage_status Kids_or_Spouse_Status Gender Count
<chr> <chr> <chr> <chr> <chr> <chr> <dbl>
1 E 1 AirForce single nokids male 7721
2 E 1 AirForce single nokids female 1550
3 E 1 AirForce single kids male 27
4 E 1 AirForce single kids female 5
5 E 1 AirForce married military male 49
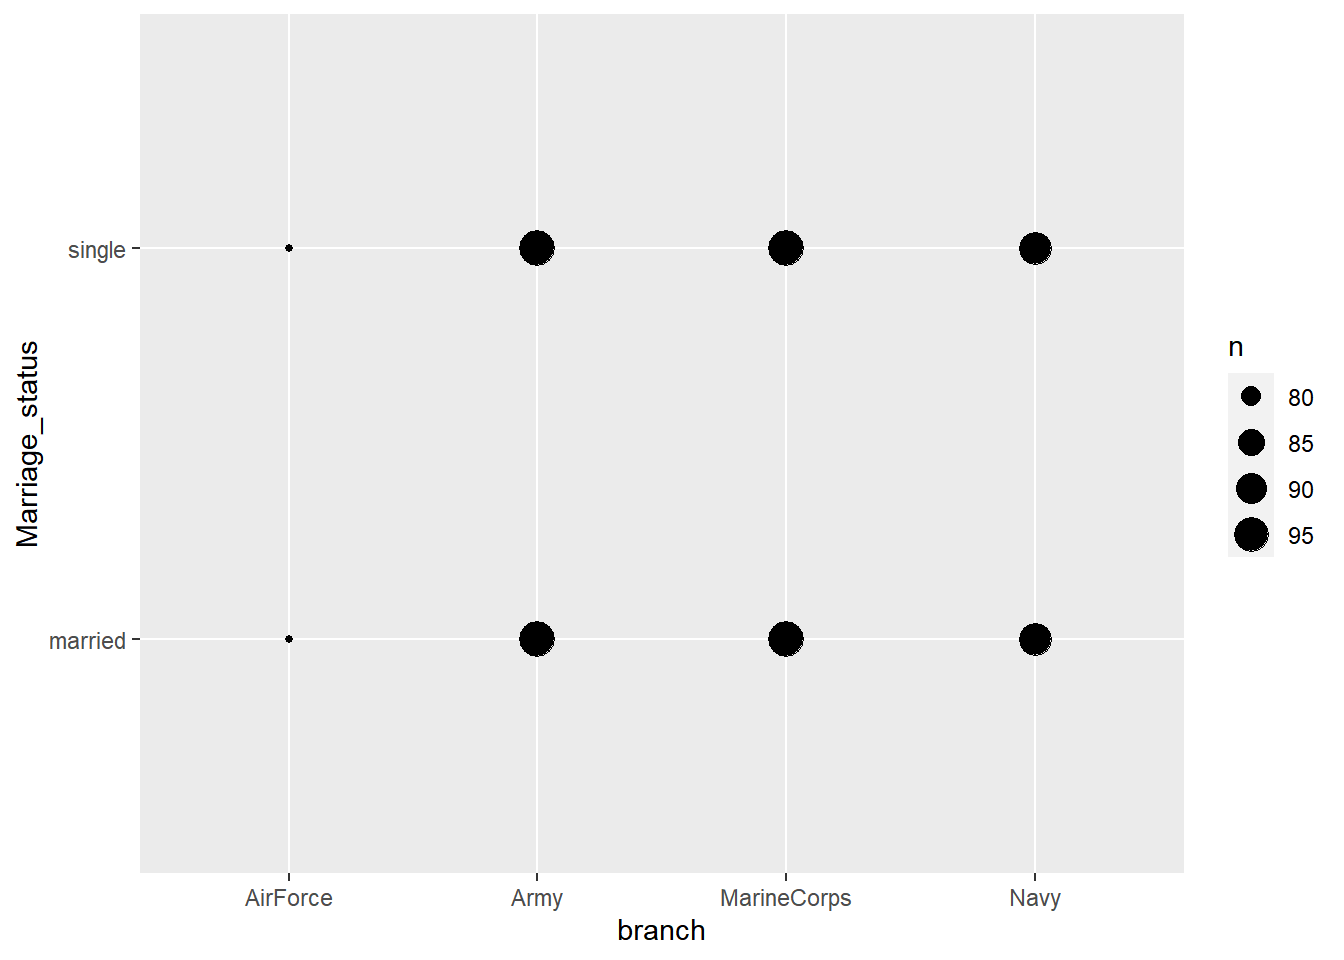
6 E 1 AirForce married military female 27#Comparing the branches by marriage status:
unique(enlisted_military_status$branch)[1] "AirForce" "MarineCorps" "Navy" "Army" ggplot(enlisted_military_status, aes(branch, Marriage_status))+
geom_count()