library(tidyverse)
library(ggplot2)
library(readxl)

knitr::opts_chunk$set(echo = TRUE, warning=FALSE, message=FALSE)Challenge 8 Solution
challenge_8
military_marriages
Susannah Reed Poland
Joining Data
Read in the Military Marital Status dataset and tidy
Read in one the “Military Marital Status” dataset, and tidy it in preparation for wrangling. This dataset is an excel workbook that is spread across several sheets, so I will need to join sheets together to create a single dataframe for analysis.
THe Military Marital Status dataset contains information on all activie military members in April of 2010. It classifies each member by marital and family status, and groups them by their respective branch of government. It also provides data on the military as whole, as a kind of “cover sheet”. The following sheets represent the same classifications for each of branches: Air Force, Marine Corps, Navy, and Army.
From inspection, I can see that the spreadsheet title and other metadata span 7 rows, and the data actually begin on row 9, so will need to skip 7 or 8 rows as I read it in. (Column headers span 2 rows, so I will need to collapse them into 1.) The values represent the number of employees that fall into various categories. The categories are created by the variables: Pay Grade Type, Pay Grade Level, Marital Status, Parent, Spouse affiliation, and Gender.
To tidy the data, I will want to delete the “total” columns and rename the other variables so that each designates the gender with the respective variable. I will also collapse the Spouse and Parent variables.
#Create a vector with the desired column names, and label the ones to be deleted as "delete"
marital_status_cols<-c("delete", "payGrade_payLevel",
            "single_nokids_male", "single_nokids_female", "delete",
            "single_kids_male", "single_kids_female", "delete",
            "married_military_male", "married_military_female", "delete",
            "married_civilian_male", "married_civilian_female", "delete", "delete", "delete", "delete")

mm_orig<-read_excel("_data/ActiveDuty_MaritalStatus.xls", skip=8, col_names=marital_status_cols)

#check out the new headers:
mm_orig%>%
  head()
I can now delete the old header row, and the columns that contain the totaled values, which I won’t need in my analysis.
#delete 1st row (old header)
mm_tidy_sheet<-mm_orig[-c(1),]%>%
  select(!starts_with("delete"))%>% #select all columns that are NOT "delete"
  filter(str_detect(payGrade_payLevel, "TOTAL", negate=TRUE)) #negate=true will invert this function, so that filter OUT the "total" columns

mm_tidy_sheet%>%
  head()
Now I can pivot the Marital, Other, and Gender columns into rows, and put their values in a “count” column. I can also separate out pay grade and pay level.
mm_tidy_long <-mm_tidy_sheet %>%
#pivot with every column except for the first column
  pivot_longer(cols = -1,
#these are the only distinct categories remaining
               names_to = c("Marital", "Other", "Gender"),
               names_sep = "_",
               values_to = "count")%>%
#separate pay grades and pay levels into their own columns
  separate(payGrade_payLevel,
           into = c("payGrade", "payLevel"),
           sep="-")%>%
#make these values more readable -- we could also have used "recode"
  mutate(payGrade = case_when(
    payGrade == "E" ~ "Enlisted",
    payGrade == "O" ~ "Officer",
    payGrade == "W" ~ "Warrant Officer"
  ))

mm_tidy_long%>%
  head()
The data of the first sheet are now tidy and relatively readable.
Join sheets (or, merge data from all sheets into one dataframe)
To join the data of the various sheets, I need to create a function that will run all the arguments that I just performed on the 1st sheet on any sheet in the workbook. The command “sheet_name” will stand in for any sheet in the workbook.
As I read in the data, I can tell read_excel to call the name of each sheet “sheet_name”. This allows us to create a column with values that are the name of the given sheet.
#sheet_name becomes an argument or command that can be applied to any sheet
read_mm<-function(sheet_name){
  dat <- read_excel("_data/ActiveDuty_MaritalStatus.xls",
#the name of each sheet is stored as "sheet_name"
             sheet = sheet_name,
             skip=9,
             col_names = marital_status_cols
             )%>%
#branch will be a new column with the sheet name (which indicates the branch of the military for each member listed)
    mutate(branch=sheet_name) %>%
    select(!starts_with("delete"))%>%
    filter(str_detect(payGrade_payLevel, "TOTAL", negate=TRUE))%>%
    pivot_longer(cols = contains(c("male", "female")),
                 names_to = c("Marital", "Other", "Gender"),
                 names_sep = "_",
                 values_to = "count")%>%
    separate(payGrade_payLevel,
             into = c("payGrade", "payLevel"),
             sep="-")%>%
    mutate(payGrade = case_when(
      payGrade == "E" ~ "Enlisted",
      payGrade == "O" ~ "Officer",
      payGrade == "W" ~ "Warrant Officer"
    ))
  return(dat)
}
I will create a vector of sheet names to run through the new function:
mm_sheet_names<-excel_sheets("_data/ActiveDuty_MaritalStatus.xls")
mm_sheet_names
[1] "TotalDoD" "AirForce" "MarineCorps" "Navy" "Army" Now I can use map_dfr from the purrr package to join the sheets into a single dataframe. “dfr” indicates data frame rows, and implies the action: the function will add the list elements created by purrr as rows in a single dataframe.
#make sure that purrr is loaded
library(purrr)
#create a new sheet, mm_all_sheets, that is the joint of all the sheets in Military Marital Status that have been transformed by the new function read_mm
mm_all_sheets<- map_dfr(excel_sheets("_data/ActiveDuty_MaritalStatus.xls")[-1],read_mm)

mm_all_sheets
The resulting dataframe has 720 rows, which is the sum of the rows in each of the sheets. Success!!
Demonstrate that we can analyze the whole dataset
We can now calculate statistics on all members of the military and visualize trends across the whole military. For example, in this plot that we can see that there are more married than single active members of the military, and for each group we can compare the porportion of members affiliated with the four different branches.
ggplot(mm_all_sheets, aes(fill=branch, x=Marital, y=count)) +
  geom_bar(stat = "identity")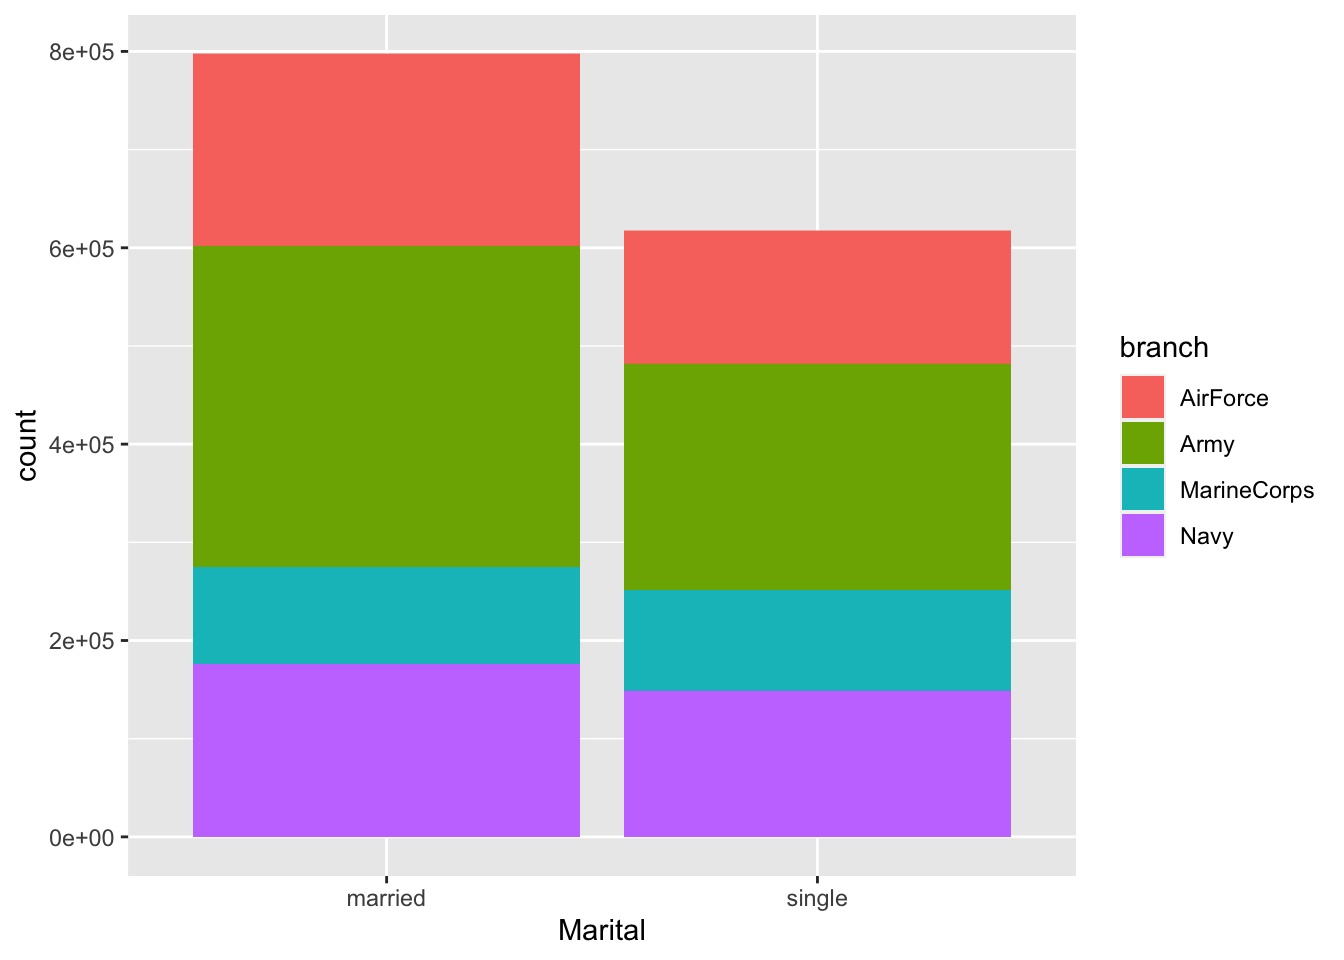
(I recognize that this is not a great plot, since it is hard to compare the relative sizes of the proportions across the two bars, except for the Navy’s relative proportions… Even a position=dodge format doesn’t do this well. I will need to think about a more appropriate plot!)