library(tidyverse)
library(ggplot2)
library(readxl)
library(dplyr)
knitr::opts_chunk$set(echo = TRUE, warning=FALSE, message=FALSE)Challenge 8 Submission
challenge_8
railroads
snl
faostat
debt
Joining Data
Challenge Overview
Today’s challenge is to:
- read in multiple data sets, and describe the data set using both words and any supporting information (e.g., tables, etc)
- tidy data (as needed, including sanity checks)
- mutate variables as needed (including sanity checks)
- join two or more data sets and analyze some aspect of the joined data
(be sure to only include the category tags for the data you use!)
Read in data
Read in one (or more) of the following datasets, using the correct R package and command.
- military marriages ⭐⭐
- faostat ⭐⭐
- railroads ⭐⭐⭐
- fed_rate ⭐⭐⭐
- debt ⭐⭐⭐
- us_hh ⭐⭐⭐⭐
- snl ⭐⭐⭐⭐⭐
we choose faostat for this challengs
cattle_dairy <- read_csv("_data/FAOSTAT_cattle_dairy.csv")
country_groups <- read_csv("_data/FAOSTAT_country_groups.csv")
egg_chicken <- read_csv("_data/FAOSTAT_egg_chicken.csv")
livestock <- read_csv("_data/FAOSTAT_livestock.csv")
cattle_dairycountry_groupsegg_chickenlivestockBriefly describe the data
These datasets appear to come from the Food and Agriculture Organization of the United Nations (FAO) and relate to livestock and agricultural statistics from different countries. The datasets include the following:
- FAOSTAT_cattle_dairy.csv: This dataset contains information about dairy cattle across different countries. For each record, the data includes the country name, the year, and various information about dairy cattle including the number of milk animals, the yield of milk per animal, and the total production of milk. Data also include information about whether the data is an estimate, calculated data, or official data.
- FAOSTAT_country_groups.csv: This is a lookup table containing details about different countries and their respective groupings. This can be useful when comparing data between different regions or groups of countries. The information includes country code, country name, M49 code, and ISO2 and ISO3 codes. The M49 and ISO codes are standardized country codes used in international data.
- FAOSTAT_egg_chicken.csv: This dataset has information on chicken egg production across different countries. Similar to the cattle dataset, it includes information about the number of laying chickens, yield of eggs per chicken, and total egg production for each year. Again, data also include information about whether the data is an estimate, calculated data, or official data.
- FAOSTAT_livestock.csv: This dataset includes information about livestock populations (specifically, it mentions asses) in different countries. The data includes the country, the year, and the number of animals in the livestock population.
Sanity checks
we make four step to do sanity checks
- Check the first few and the last few records of the dataset.
- Check the structure and summary of the dataset.
- Look for missing values.
- Check for duplicate rows.
# Function to perform sanity checks
sanity_check <- function(df) {
print(head(df)) # check first few rows
print(tail(df)) # check last few rows
print(str(df)) # check structure
print(summary(df)) # check summary
print(any(is.na(df))) # check for missing values
print(anyDuplicated(df)) # check for duplicates
}
# Perform sanity checks
sanity_check(cattle_dairy)# A tibble: 6 × 14
`Domain Code` Domain `Area Code` Area `Element Code` Element `Item Code`
<chr> <chr> <dbl> <chr> <dbl> <chr> <dbl>
1 QL Livestock … 2 Afgh… 5318 Milk A… 882
2 QL Livestock … 2 Afgh… 5420 Yield 882
3 QL Livestock … 2 Afgh… 5510 Produc… 882
4 QL Livestock … 2 Afgh… 5318 Milk A… 882
5 QL Livestock … 2 Afgh… 5420 Yield 882
6 QL Livestock … 2 Afgh… 5510 Produc… 882
# ℹ 7 more variables: Item <chr>, `Year Code` <dbl>, Year <dbl>, Unit <chr>,
# Value <dbl>, Flag <chr>, `Flag Description` <chr>
# A tibble: 6 × 14
`Domain Code` Domain `Area Code` Area `Element Code` Element `Item Code`
<chr> <chr> <dbl> <chr> <dbl> <chr> <dbl>
1 QL Livestock … 5504 Poly… 5318 Milk A… 882
2 QL Livestock … 5504 Poly… 5420 Yield 882
3 QL Livestock … 5504 Poly… 5510 Produc… 882
4 QL Livestock … 5504 Poly… 5318 Milk A… 882
5 QL Livestock … 5504 Poly… 5420 Yield 882
6 QL Livestock … 5504 Poly… 5510 Produc… 882
# ℹ 7 more variables: Item <chr>, `Year Code` <dbl>, Year <dbl>, Unit <chr>,
# Value <dbl>, Flag <chr>, `Flag Description` <chr>
spc_tbl_ [36,449 × 14] (S3: spec_tbl_df/tbl_df/tbl/data.frame)
$ Domain Code : chr [1:36449] "QL" "QL" "QL" "QL" ...
$ Domain : chr [1:36449] "Livestock Primary" "Livestock Primary" "Livestock Primary" "Livestock Primary" ...
$ Area Code : num [1:36449] 2 2 2 2 2 2 2 2 2 2 ...
$ Area : chr [1:36449] "Afghanistan" "Afghanistan" "Afghanistan" "Afghanistan" ...
$ Element Code : num [1:36449] 5318 5420 5510 5318 5420 ...
$ Element : chr [1:36449] "Milk Animals" "Yield" "Production" "Milk Animals" ...
$ Item Code : num [1:36449] 882 882 882 882 882 882 882 882 882 882 ...
$ Item : chr [1:36449] "Milk, whole fresh cow" "Milk, whole fresh cow" "Milk, whole fresh cow" "Milk, whole fresh cow" ...
$ Year Code : num [1:36449] 1961 1961 1961 1962 1962 ...
$ Year : num [1:36449] 1961 1961 1961 1962 1962 ...
$ Unit : chr [1:36449] "Head" "hg/An" "tonnes" "Head" ...
$ Value : num [1:36449] 700000 5000 350000 700000 5000 ...
$ Flag : chr [1:36449] "F" "Fc" "F" "F" ...
$ Flag Description: chr [1:36449] "FAO estimate" "Calculated data" "FAO estimate" "FAO estimate" ...
- attr(*, "spec")=
.. cols(
.. `Domain Code` = col_character(),
.. Domain = col_character(),
.. `Area Code` = col_double(),
.. Area = col_character(),
.. `Element Code` = col_double(),
.. Element = col_character(),
.. `Item Code` = col_double(),
.. Item = col_character(),
.. `Year Code` = col_double(),
.. Year = col_double(),
.. Unit = col_character(),
.. Value = col_double(),
.. Flag = col_character(),
.. `Flag Description` = col_character()
.. )
- attr(*, "problems")=<externalptr>
NULL
Domain Code Domain Area Code Area
Length:36449 Length:36449 Min. : 1.0 Length:36449
Class :character Class :character 1st Qu.: 69.0 Class :character
Mode :character Mode :character Median : 141.0 Mode :character
Mean : 775.2
3rd Qu.: 215.0
Max. :5504.0
Element Code Element Item Code Item
Min. :5318 Length:36449 Min. :882 Length:36449
1st Qu.:5318 Class :character 1st Qu.:882 Class :character
Median :5420 Mode :character Median :882 Mode :character
Mean :5416 Mean :882
3rd Qu.:5510 3rd Qu.:882
Max. :5510 Max. :882
Year Code Year Unit Value
Min. :1961 Min. :1961 Length:36449 Min. : 7
1st Qu.:1976 1st Qu.:1976 Class :character 1st Qu.: 7849
Median :1991 Median :1991 Mode :character Median : 43266
Mean :1990 Mean :1990 Mean : 4410235
3rd Qu.:2005 3rd Qu.:2005 3rd Qu.: 700000
Max. :2018 Max. :2018 Max. :683217055
NA's :74
Flag Flag Description
Length:36449 Length:36449
Class :character Class :character
Mode :character Mode :character
[1] TRUE
[1] 0sanity_check(country_groups)# A tibble: 6 × 7
`Country Group Code` `Country Group` `Country Code` Country `M49 Code`
<dbl> <chr> <dbl> <chr> <chr>
1 5100 Africa 4 Algeria 012
2 5100 Africa 7 Angola 024
3 5100 Africa 53 Benin 204
4 5100 Africa 20 Botswana 072
5 5100 Africa 233 Burkina Faso 854
6 5100 Africa 29 Burundi 108
# ℹ 2 more variables: `ISO2 Code` <chr>, `ISO3 Code` <chr>
# A tibble: 6 × 7
`Country Group Code` `Country Group` `Country Code` Country `M49 Code`
<dbl> <chr> <dbl> <chr> <chr>
1 5000 World 249 Yemen 887
2 5000 World 246 Yemen Ar Rp 886
3 5000 World 247 Yemen Dem 720
4 5000 World 248 Yugoslav SFR 890
5 5000 World 251 Zambia 894
6 5000 World 181 Zimbabwe 716
# ℹ 2 more variables: `ISO2 Code` <chr>, `ISO3 Code` <chr>
spc_tbl_ [1,943 × 7] (S3: spec_tbl_df/tbl_df/tbl/data.frame)
$ Country Group Code: num [1:1943] 5100 5100 5100 5100 5100 5100 5100 5100 5100 5100 ...
$ Country Group : chr [1:1943] "Africa" "Africa" "Africa" "Africa" ...
$ Country Code : num [1:1943] 4 7 53 20 233 29 35 32 37 39 ...
$ Country : chr [1:1943] "Algeria" "Angola" "Benin" "Botswana" ...
$ M49 Code : chr [1:1943] "012" "024" "204" "072" ...
$ ISO2 Code : chr [1:1943] "DZ" "AO" "BJ" "BW" ...
$ ISO3 Code : chr [1:1943] "DZA" "AGO" "BEN" "BWA" ...
- attr(*, "spec")=
.. cols(
.. `Country Group Code` = col_double(),
.. `Country Group` = col_character(),
.. `Country Code` = col_double(),
.. Country = col_character(),
.. `M49 Code` = col_character(),
.. `ISO2 Code` = col_character(),
.. `ISO3 Code` = col_character()
.. )
- attr(*, "problems")=<externalptr>
NULL
Country Group Code Country Group Country Code Country
Min. : 336 Length:1943 Min. : 1.0 Length:1943
1st Qu.:5200 Class :character 1st Qu.: 69.0 Class :character
Median :5403 Mode :character Median :136.0 Mode :character
Mean :5502 Mean :142.2
3rd Qu.:5848 3rd Qu.:202.0
Max. :9011 Max. :622.0
M49 Code ISO2 Code ISO3 Code
Length:1943 Length:1943 Length:1943
Class :character Class :character Class :character
Mode :character Mode :character Mode :character
[1] TRUE
[1] 0sanity_check(egg_chicken)# A tibble: 6 × 14
`Domain Code` Domain `Area Code` Area `Element Code` Element `Item Code`
<chr> <chr> <dbl> <chr> <dbl> <chr> <dbl>
1 QL Livestock … 2 Afgh… 5313 Laying 1062
2 QL Livestock … 2 Afgh… 5410 Yield 1062
3 QL Livestock … 2 Afgh… 5510 Produc… 1062
4 QL Livestock … 2 Afgh… 5313 Laying 1062
5 QL Livestock … 2 Afgh… 5410 Yield 1062
6 QL Livestock … 2 Afgh… 5510 Produc… 1062
# ℹ 7 more variables: Item <chr>, `Year Code` <dbl>, Year <dbl>, Unit <chr>,
# Value <dbl>, Flag <chr>, `Flag Description` <chr>
# A tibble: 6 × 14
`Domain Code` Domain `Area Code` Area `Element Code` Element `Item Code`
<chr> <chr> <dbl> <chr> <dbl> <chr> <dbl>
1 QL Livestock … 5504 Poly… 5313 Laying 1062
2 QL Livestock … 5504 Poly… 5410 Yield 1062
3 QL Livestock … 5504 Poly… 5510 Produc… 1062
4 QL Livestock … 5504 Poly… 5313 Laying 1062
5 QL Livestock … 5504 Poly… 5410 Yield 1062
6 QL Livestock … 5504 Poly… 5510 Produc… 1062
# ℹ 7 more variables: Item <chr>, `Year Code` <dbl>, Year <dbl>, Unit <chr>,
# Value <dbl>, Flag <chr>, `Flag Description` <chr>
spc_tbl_ [38,170 × 14] (S3: spec_tbl_df/tbl_df/tbl/data.frame)
$ Domain Code : chr [1:38170] "QL" "QL" "QL" "QL" ...
$ Domain : chr [1:38170] "Livestock Primary" "Livestock Primary" "Livestock Primary" "Livestock Primary" ...
$ Area Code : num [1:38170] 2 2 2 2 2 2 2 2 2 2 ...
$ Area : chr [1:38170] "Afghanistan" "Afghanistan" "Afghanistan" "Afghanistan" ...
$ Element Code : num [1:38170] 5313 5410 5510 5313 5410 ...
$ Element : chr [1:38170] "Laying" "Yield" "Production" "Laying" ...
$ Item Code : num [1:38170] 1062 1062 1062 1062 1062 ...
$ Item : chr [1:38170] "Eggs, hen, in shell" "Eggs, hen, in shell" "Eggs, hen, in shell" "Eggs, hen, in shell" ...
$ Year Code : num [1:38170] 1961 1961 1961 1962 1962 ...
$ Year : num [1:38170] 1961 1961 1961 1962 1962 ...
$ Unit : chr [1:38170] "1000 Head" "100mg/An" "tonnes" "1000 Head" ...
$ Value : num [1:38170] 4000 25000 10000 4400 25000 11000 4600 25000 11500 4800 ...
$ Flag : chr [1:38170] "F" "Fc" "F" "F" ...
$ Flag Description: chr [1:38170] "FAO estimate" "Calculated data" "FAO estimate" "FAO estimate" ...
- attr(*, "spec")=
.. cols(
.. `Domain Code` = col_character(),
.. Domain = col_character(),
.. `Area Code` = col_double(),
.. Area = col_character(),
.. `Element Code` = col_double(),
.. Element = col_character(),
.. `Item Code` = col_double(),
.. Item = col_character(),
.. `Year Code` = col_double(),
.. Year = col_double(),
.. Unit = col_character(),
.. Value = col_double(),
.. Flag = col_character(),
.. `Flag Description` = col_character()
.. )
- attr(*, "problems")=<externalptr>
NULL
Domain Code Domain Area Code Area
Length:38170 Length:38170 Min. : 1.0 Length:38170
Class :character Class :character 1st Qu.: 70.0 Class :character
Mode :character Mode :character Median : 143.0 Mode :character
Mean : 771.1
3rd Qu.: 215.0
Max. :5504.0
Element Code Element Item Code Item
Min. :5313 Length:38170 Min. :1062 Length:38170
1st Qu.:5313 Class :character 1st Qu.:1062 Class :character
Median :5410 Mode :character Median :1062 Mode :character
Mean :5411 Mean :1062
3rd Qu.:5510 3rd Qu.:1062
Max. :5510 Max. :1062
Year Code Year Unit Value
Min. :1961 Min. :1961 Length:38170 Min. : 1
1st Qu.:1976 1st Qu.:1976 Class :character 1st Qu.: 2600
Median :1991 Median :1991 Mode :character Median : 31996
Mean :1990 Mean :1990 Mean : 291341
3rd Qu.:2005 3rd Qu.:2005 3rd Qu.: 93836
Max. :2018 Max. :2018 Max. :76769955
NA's :40
Flag Flag Description
Length:38170 Length:38170
Class :character Class :character
Mode :character Mode :character
[1] TRUE
[1] 0sanity_check(livestock)# A tibble: 6 × 14
`Domain Code` Domain `Area Code` Area `Element Code` Element `Item Code`
<chr> <chr> <dbl> <chr> <dbl> <chr> <dbl>
1 QA Live Anima… 2 Afgh… 5111 Stocks 1107
2 QA Live Anima… 2 Afgh… 5111 Stocks 1107
3 QA Live Anima… 2 Afgh… 5111 Stocks 1107
4 QA Live Anima… 2 Afgh… 5111 Stocks 1107
5 QA Live Anima… 2 Afgh… 5111 Stocks 1107
6 QA Live Anima… 2 Afgh… 5111 Stocks 1107
# ℹ 7 more variables: Item <chr>, `Year Code` <dbl>, Year <dbl>, Unit <chr>,
# Value <dbl>, Flag <chr>, `Flag Description` <chr>
# A tibble: 6 × 14
`Domain Code` Domain `Area Code` Area `Element Code` Element `Item Code`
<chr> <chr> <dbl> <chr> <dbl> <chr> <dbl>
1 QA Live Anima… 5504 Poly… 5111 Stocks 976
2 QA Live Anima… 5504 Poly… 5111 Stocks 976
3 QA Live Anima… 5504 Poly… 5111 Stocks 976
4 QA Live Anima… 5504 Poly… 5111 Stocks 976
5 QA Live Anima… 5504 Poly… 5111 Stocks 976
6 QA Live Anima… 5504 Poly… 5111 Stocks 976
# ℹ 7 more variables: Item <chr>, `Year Code` <dbl>, Year <dbl>, Unit <chr>,
# Value <dbl>, Flag <chr>, `Flag Description` <chr>
spc_tbl_ [82,116 × 14] (S3: spec_tbl_df/tbl_df/tbl/data.frame)
$ Domain Code : chr [1:82116] "QA" "QA" "QA" "QA" ...
$ Domain : chr [1:82116] "Live Animals" "Live Animals" "Live Animals" "Live Animals" ...
$ Area Code : num [1:82116] 2 2 2 2 2 2 2 2 2 2 ...
$ Area : chr [1:82116] "Afghanistan" "Afghanistan" "Afghanistan" "Afghanistan" ...
$ Element Code : num [1:82116] 5111 5111 5111 5111 5111 ...
$ Element : chr [1:82116] "Stocks" "Stocks" "Stocks" "Stocks" ...
$ Item Code : num [1:82116] 1107 1107 1107 1107 1107 ...
$ Item : chr [1:82116] "Asses" "Asses" "Asses" "Asses" ...
$ Year Code : num [1:82116] 1961 1962 1963 1964 1965 ...
$ Year : num [1:82116] 1961 1962 1963 1964 1965 ...
$ Unit : chr [1:82116] "Head" "Head" "Head" "Head" ...
$ Value : num [1:82116] 1300000 851850 1001112 1150000 1300000 ...
$ Flag : chr [1:82116] NA NA NA "F" ...
$ Flag Description: chr [1:82116] "Official data" "Official data" "Official data" "FAO estimate" ...
- attr(*, "spec")=
.. cols(
.. `Domain Code` = col_character(),
.. Domain = col_character(),
.. `Area Code` = col_double(),
.. Area = col_character(),
.. `Element Code` = col_double(),
.. Element = col_character(),
.. `Item Code` = col_double(),
.. Item = col_character(),
.. `Year Code` = col_double(),
.. Year = col_double(),
.. Unit = col_character(),
.. Value = col_double(),
.. Flag = col_character(),
.. `Flag Description` = col_character()
.. )
- attr(*, "problems")=<externalptr>
NULL
Domain Code Domain Area Code Area
Length:82116 Length:82116 Min. : 1.0 Length:82116
Class :character Class :character 1st Qu.: 73.0 Class :character
Mode :character Mode :character Median : 146.0 Mode :character
Mean : 912.7
3rd Qu.: 221.0
Max. :5504.0
Element Code Element Item Code Item
Min. :5111 Length:82116 Min. : 866 Length:82116
1st Qu.:5111 Class :character 1st Qu.: 976 Class :character
Median :5111 Mode :character Median :1034 Mode :character
Mean :5111 Mean :1018
3rd Qu.:5111 3rd Qu.:1096
Max. :5111 Max. :1126
Year Code Year Unit Value
Min. :1961 Min. :1961 Length:82116 Min. :0.000e+00
1st Qu.:1976 1st Qu.:1976 Class :character 1st Qu.:1.250e+04
Median :1991 Median :1991 Mode :character Median :2.247e+05
Mean :1990 Mean :1990 Mean :1.163e+07
3rd Qu.:2005 3rd Qu.:2005 3rd Qu.:2.377e+06
Max. :2018 Max. :2018 Max. :1.490e+09
NA's :1301
Flag Flag Description
Length:82116 Length:82116
Class :character Class :character
Mode :character Mode :character
[1] TRUE
[1] 0Join Data
Be sure to include a sanity check, and double-check that case count is correct!
We used left_join() function from the dplyr package in R to join our datasets. The data from different sources, ‘livestock’, ‘egg_chicken’, and ‘cattle_dairy’, share common variables such as ‘Area’ and ‘Year’. This makes these variables ideal keys for joining the data. We chose a left join because we wanted to keep all rows from the livestock dataset (our left dataset), and add matching rows from egg_chicken and cattle_dairy datasets to it.
dplyr::glimpse(cattle_dairy)Rows: 36,449
Columns: 14
$ `Domain Code` <chr> "QL", "QL", "QL", "QL", "QL", "QL", "QL", "QL", "QL…
$ Domain <chr> "Livestock Primary", "Livestock Primary", "Livestoc…
$ `Area Code` <dbl> 2, 2, 2, 2, 2, 2, 2, 2, 2, 2, 2, 2, 2, 2, 2, 2, 2, …
$ Area <chr> "Afghanistan", "Afghanistan", "Afghanistan", "Afgha…
$ `Element Code` <dbl> 5318, 5420, 5510, 5318, 5420, 5510, 5318, 5420, 551…
$ Element <chr> "Milk Animals", "Yield", "Production", "Milk Animal…
$ `Item Code` <dbl> 882, 882, 882, 882, 882, 882, 882, 882, 882, 882, 8…
$ Item <chr> "Milk, whole fresh cow", "Milk, whole fresh cow", "…
$ `Year Code` <dbl> 1961, 1961, 1961, 1962, 1962, 1962, 1963, 1963, 196…
$ Year <dbl> 1961, 1961, 1961, 1962, 1962, 1962, 1963, 1963, 196…
$ Unit <chr> "Head", "hg/An", "tonnes", "Head", "hg/An", "tonnes…
$ Value <dbl> 700000, 5000, 350000, 700000, 5000, 350000, 780000,…
$ Flag <chr> "F", "Fc", "F", "F", "Fc", "F", "F", "Fc", "F", "F"…
$ `Flag Description` <chr> "FAO estimate", "Calculated data", "FAO estimate", …dplyr::glimpse(country_groups)Rows: 1,943
Columns: 7
$ `Country Group Code` <dbl> 5100, 5100, 5100, 5100, 5100, 5100, 5100, 5100, 5…
$ `Country Group` <chr> "Africa", "Africa", "Africa", "Africa", "Africa",…
$ `Country Code` <dbl> 4, 7, 53, 20, 233, 29, 35, 32, 37, 39, 24, 45, 46…
$ Country <chr> "Algeria", "Angola", "Benin", "Botswana", "Burkin…
$ `M49 Code` <chr> "012", "024", "204", "072", "854", "108", "132", …
$ `ISO2 Code` <chr> "DZ", "AO", "BJ", "BW", "BF", "BI", "CV", "CM", "…
$ `ISO3 Code` <chr> "DZA", "AGO", "BEN", "BWA", "BFA", "BDI", "CPV", …dplyr::glimpse(egg_chicken)Rows: 38,170
Columns: 14
$ `Domain Code` <chr> "QL", "QL", "QL", "QL", "QL", "QL", "QL", "QL", "QL…
$ Domain <chr> "Livestock Primary", "Livestock Primary", "Livestoc…
$ `Area Code` <dbl> 2, 2, 2, 2, 2, 2, 2, 2, 2, 2, 2, 2, 2, 2, 2, 2, 2, …
$ Area <chr> "Afghanistan", "Afghanistan", "Afghanistan", "Afgha…
$ `Element Code` <dbl> 5313, 5410, 5510, 5313, 5410, 5510, 5313, 5410, 551…
$ Element <chr> "Laying", "Yield", "Production", "Laying", "Yield",…
$ `Item Code` <dbl> 1062, 1062, 1062, 1062, 1062, 1062, 1062, 1062, 106…
$ Item <chr> "Eggs, hen, in shell", "Eggs, hen, in shell", "Eggs…
$ `Year Code` <dbl> 1961, 1961, 1961, 1962, 1962, 1962, 1963, 1963, 196…
$ Year <dbl> 1961, 1961, 1961, 1962, 1962, 1962, 1963, 1963, 196…
$ Unit <chr> "1000 Head", "100mg/An", "tonnes", "1000 Head", "10…
$ Value <dbl> 4000, 25000, 10000, 4400, 25000, 11000, 4600, 25000…
$ Flag <chr> "F", "Fc", "F", "F", "Fc", "F", "F", "Fc", "F", "F"…
$ `Flag Description` <chr> "FAO estimate", "Calculated data", "FAO estimate", …dplyr::glimpse(livestock)Rows: 82,116
Columns: 14
$ `Domain Code` <chr> "QA", "QA", "QA", "QA", "QA", "QA", "QA", "QA", "QA…
$ Domain <chr> "Live Animals", "Live Animals", "Live Animals", "Li…
$ `Area Code` <dbl> 2, 2, 2, 2, 2, 2, 2, 2, 2, 2, 2, 2, 2, 2, 2, 2, 2, …
$ Area <chr> "Afghanistan", "Afghanistan", "Afghanistan", "Afgha…
$ `Element Code` <dbl> 5111, 5111, 5111, 5111, 5111, 5111, 5111, 5111, 511…
$ Element <chr> "Stocks", "Stocks", "Stocks", "Stocks", "Stocks", "…
$ `Item Code` <dbl> 1107, 1107, 1107, 1107, 1107, 1107, 1107, 1107, 110…
$ Item <chr> "Asses", "Asses", "Asses", "Asses", "Asses", "Asses…
$ `Year Code` <dbl> 1961, 1962, 1963, 1964, 1965, 1966, 1967, 1968, 196…
$ Year <dbl> 1961, 1962, 1963, 1964, 1965, 1966, 1967, 1968, 196…
$ Unit <chr> "Head", "Head", "Head", "Head", "Head", "Head", "He…
$ Value <dbl> 1300000, 851850, 1001112, 1150000, 1300000, 1200000…
$ Flag <chr> NA, NA, NA, "F", NA, NA, NA, NA, NA, NA, NA, NA, "F…
$ `Flag Description` <chr> "Official data", "Official data", "Official data", …livestock <- livestock %>% rename(Livestock_Stock = Value)
egg_chicken <- egg_chicken %>% rename(Egg_Production = Value)
cattle_dairy <- cattle_dairy %>% rename(Dairy_Production = Value)
df_joined <- livestock %>%
left_join(egg_chicken, by = c("Area", "Year")) %>%
left_join(cattle_dairy, by = c("Area", "Year"))
correlation_egg <- cor(df_joined$Livestock_Stock, df_joined$Egg_Production, use = "complete.obs")
correlation_dairy <- cor(df_joined$Livestock_Stock, df_joined$Dairy_Production, use = "complete.obs")Data analysis
For the analysis, we chose to use scatter plots. A scatter plot is a type of plot using Cartesian coordinates to display values for two variables for a set of data. In our case, the variables are livestock population and production outputs. This type of plot is particularly useful when we want to see if there’s a correlation or pattern between two numeric variables, as it allows us to visually examine possible relationships.
print(paste("Correlation between livestock stock and egg production:", correlation_egg))[1] "Correlation between livestock stock and egg production: 0.368586036987474"print(paste("Correlation between livestock stock and dairy production:", correlation_dairy))[1] "Correlation between livestock stock and dairy production: 0.448223582832865"ggplot(df_joined, aes(x = Livestock_Stock, y = Egg_Production)) +
geom_point() +
theme_minimal() +
labs(title = "Livestock Stock vs Egg Production",
x = "Livestock Stock",
y = "Egg Production")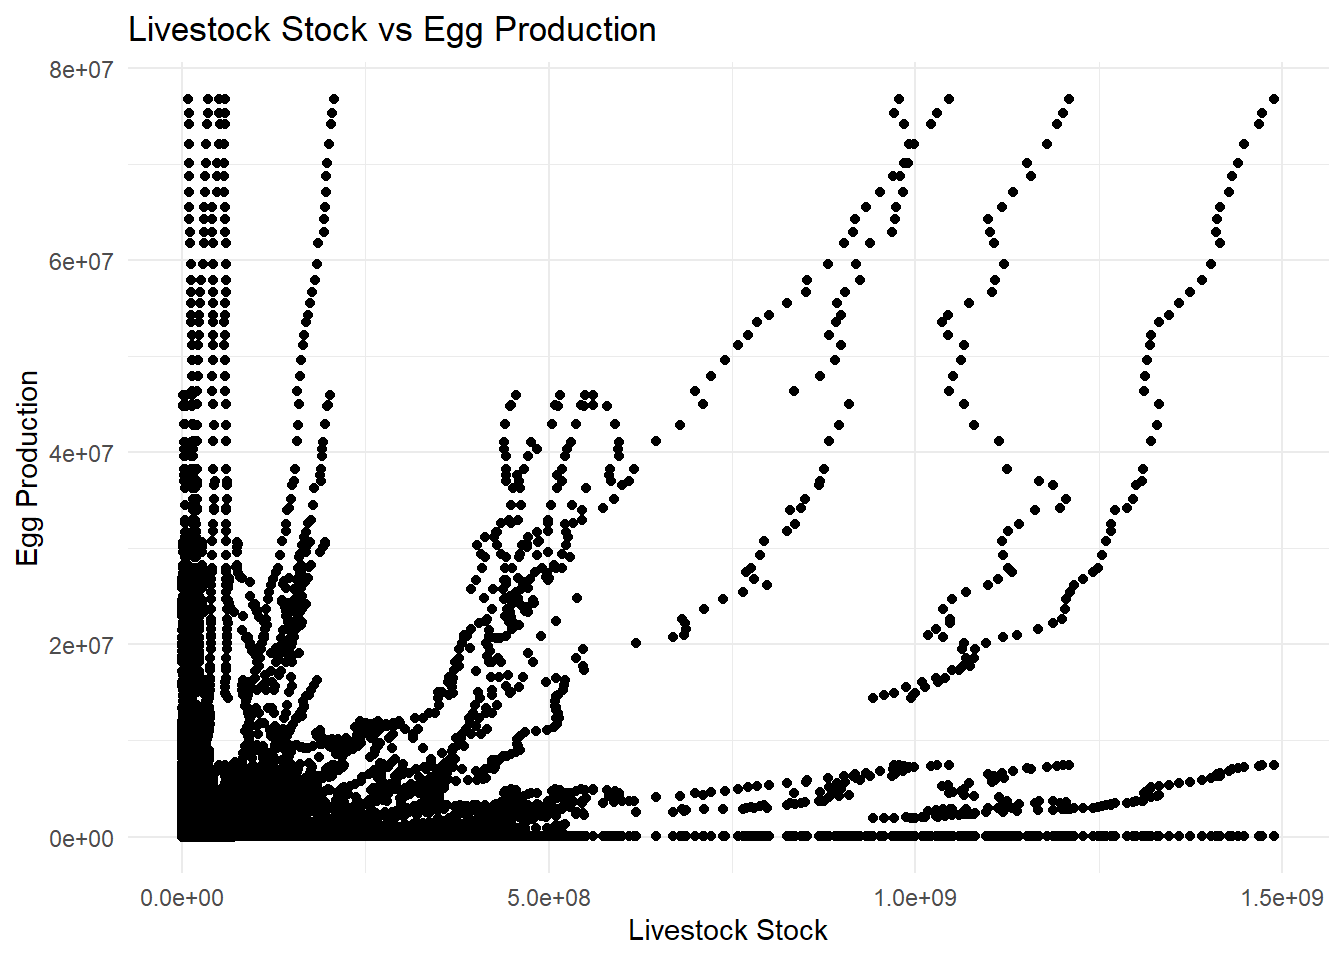
# Scatter plot of Livestock Stock vs Dairy Production
ggplot(df_joined, aes(x = Livestock_Stock, y = Dairy_Production)) +
geom_point() +
theme_minimal() +
labs(title = "Livestock Stock vs Dairy Production",
x = "Livestock Stock",
y = "Dairy Production")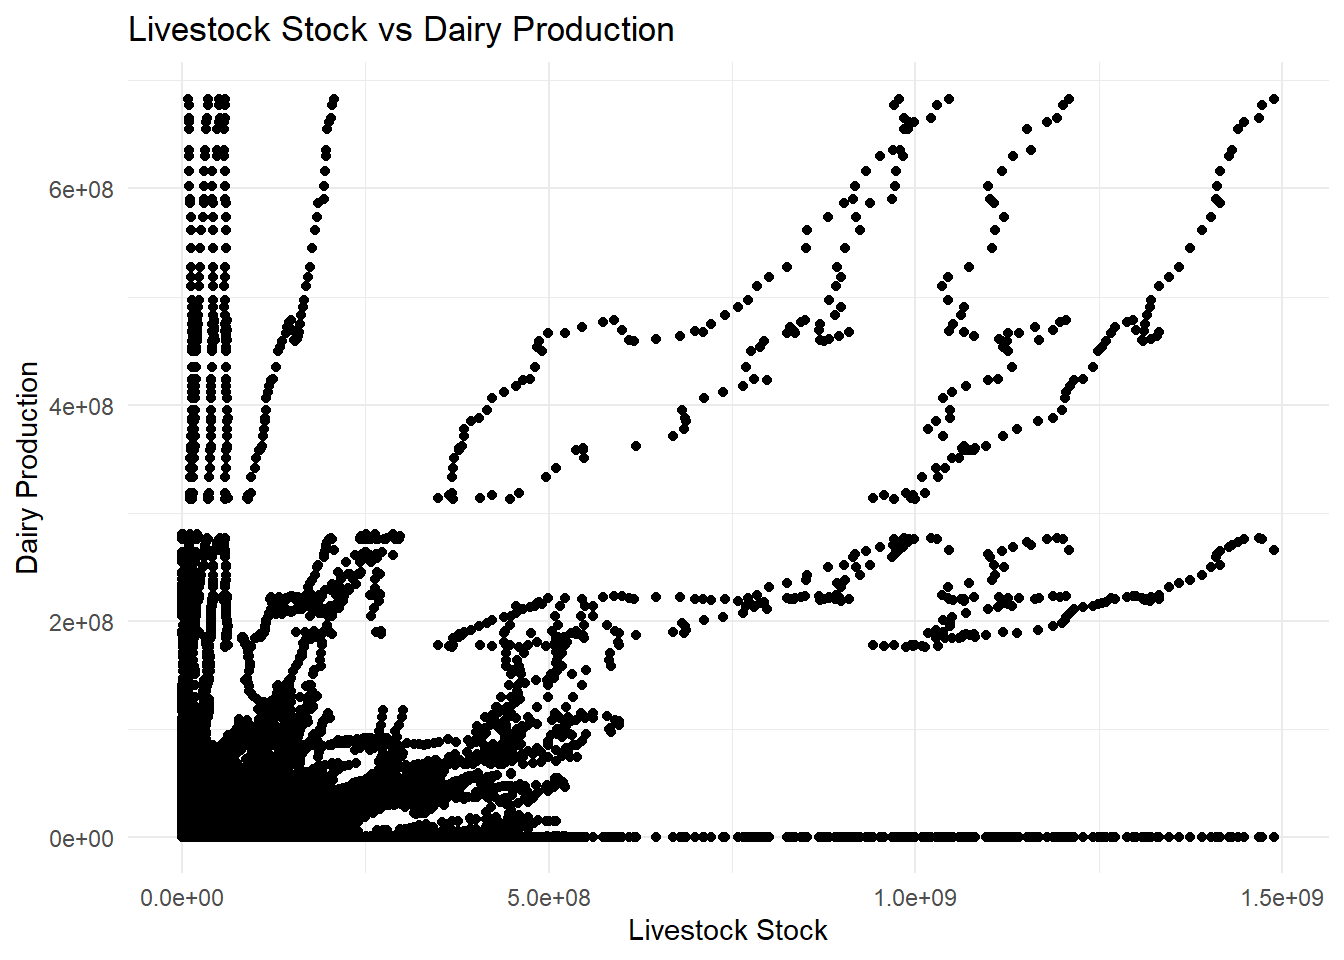
By visually inspecting the scatter plots, we can identify trends and correlations between the variables. For instance, if we observe an upward trend, it would suggest that as livestock population increases, so does egg or dairy production, indicating a positive correlation. On the contrary, a downward trend would suggest a negative correlation.